Download to read offline

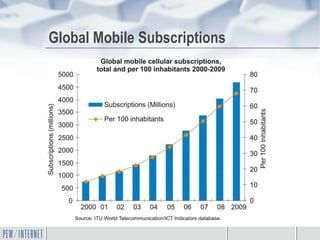
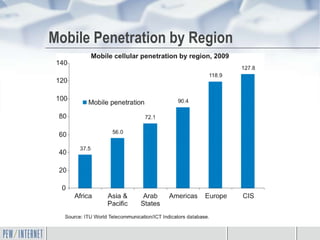
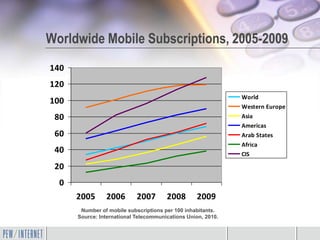
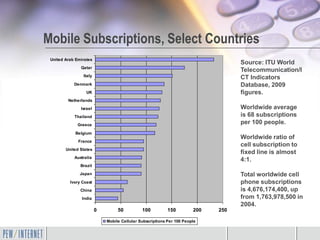
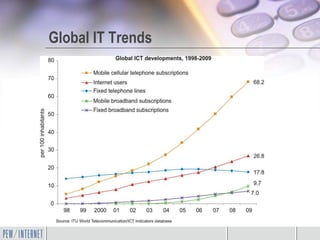
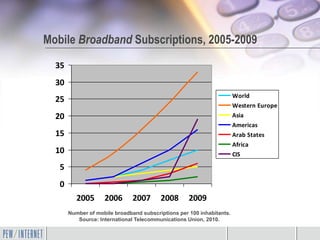
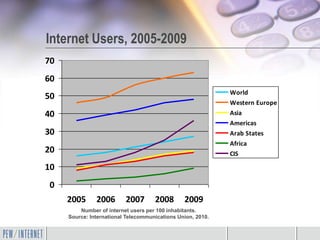
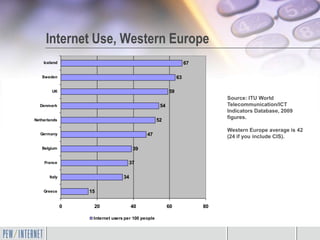
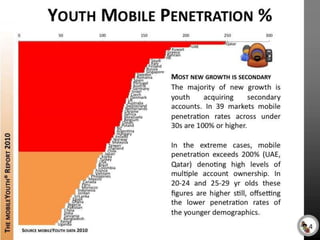
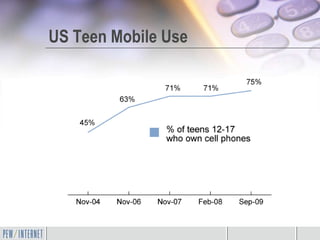
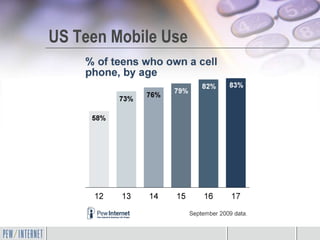
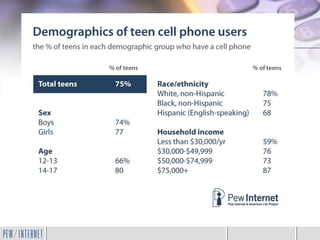
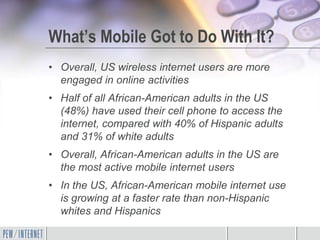
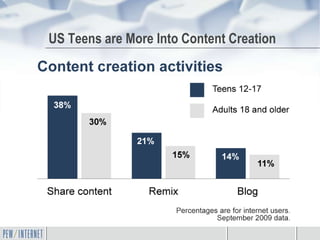
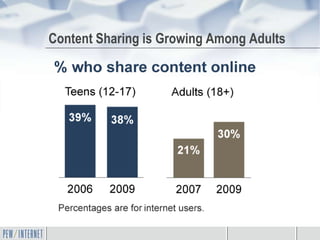
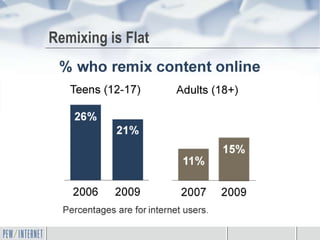
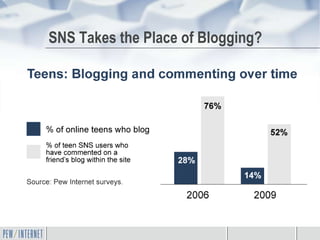
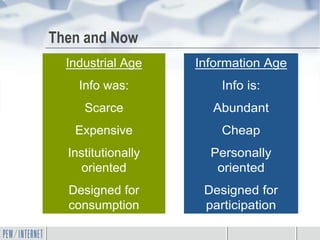
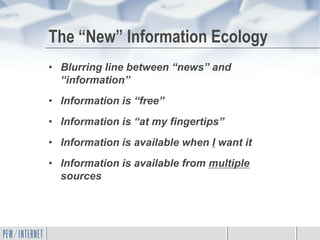
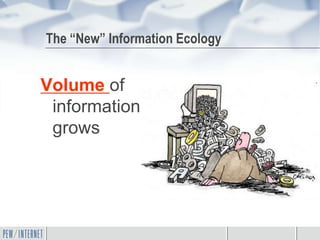
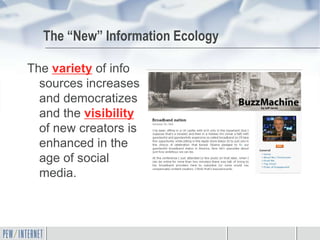
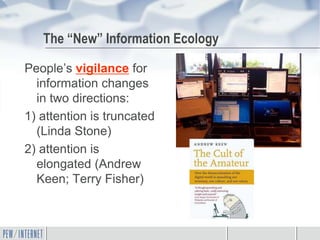
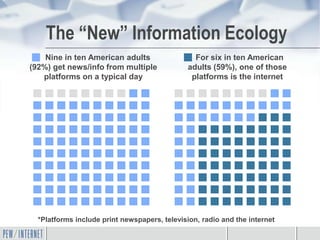
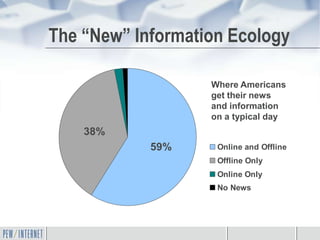
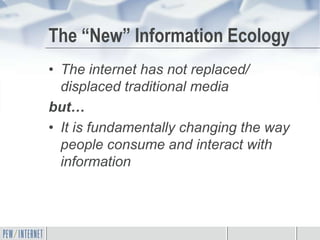
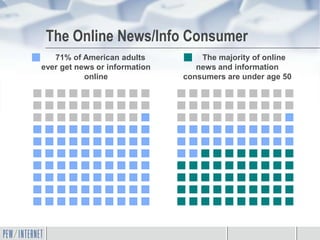
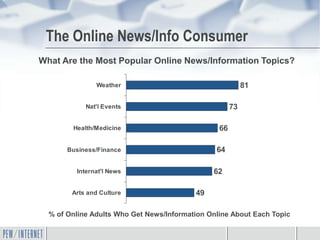
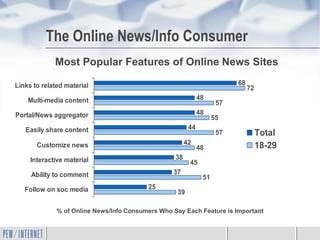
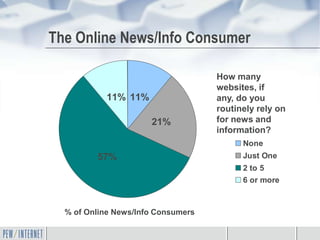
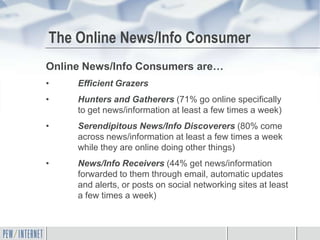
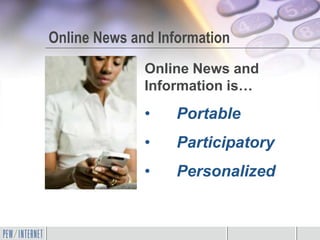
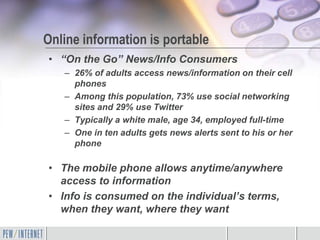
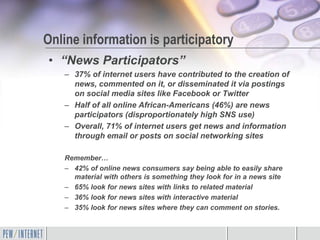
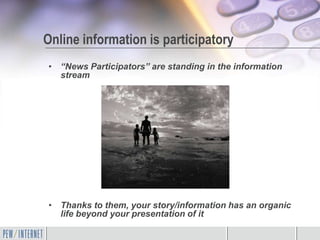


This document summarizes a presentation given by Kristen Purcell from the Pew Internet Project. The presentation discusses trends in mobile device and internet use globally and in the US. It highlights that mobile use is growing rapidly worldwide, with the number of mobile subscriptions exceeding the global population. In the US, African Americans have higher rates of mobile internet access compared to other racial groups. The presentation also characterizes the new information ecology as more abundant, cheap, and personalized compared to the past. It notes people now access information from many sources and platforms. Finally, it provides details on characteristics and behaviors of online news and information consumers in the US.


![ITU in Asia Pacific : Cooperation with APNIC on IPv6 Migration [APRICOT 2015]](https://cdn.slidesharecdn.com/ss_thumbnails/ituasproactivities2015andipv61425342342-150302191645-conversion-gate01-thumbnail.jpg?width=640&height=640&fit=bounds)