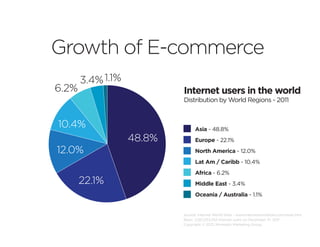
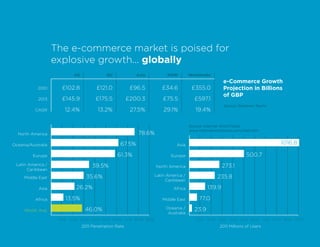
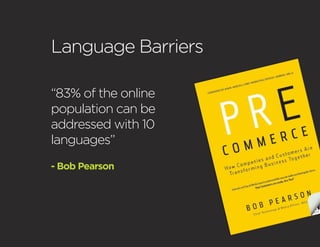
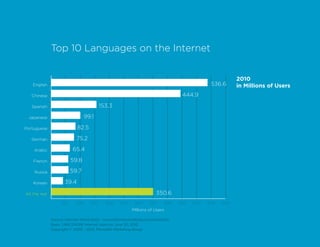
SlideShare a Scribd company logo
Greetings
Melissa Blackburn
Senior Manager, Sales
International E-commerce
The benefits and challenges of selling globally
Growth of E-commerce
       3.4% 1.1%
6.2%                       Internet users in the world
                           Distribution by World Regions - 2011


10.4%                            Asia - 48.8%
                   48.8%         Europe - 22.1%
12.0%                            North America - 12.0%
                                 Lat Am / Caribb - 10.4%
                                 Africa - 6.2%
       22.1%                     Middle East - 3.4%
                                 Oceania / Australia - 1.1%


                           Source: Internet World Stats - www.internetworldstats.com/stats.htm
                           Basis: 2,267,233,742 Internet users on December 31, 2011
                           Copyright © 2012, Miniwatts Marketing Group
The e-commerce market is poised for
                    explosive growth... globally
                          US               EU             Asia         ROW         Worldwide
                                                                                                    e-Commerce Growth
            2010      £102.8          £121.0            £96.5       £34.6           £355.0          Projection in Billions
                                                                                                    of GBP
            2013      £145.9          £175.5           £200.3        £75.5           £597.1
                                                                                                    Source: Goldman Sachs
           CAGR        12.4%           13.2%            27.5%        29.1%            19.4%

                                                                                   Source: Internet World Stats
                                                                                   www.internetworldstats.com/stats.htm
  North America                                           78.6%

Oceania/Australia                                 67.5%                    Asia                                             1016.8

          Europe                                61.3%                    Europe                                 500.7
 Latin America /                    39.5%                         North America                     273.1
       Caribbean
                                 35.6%                           Latin America /                 235.8
     Middle East
                                                                       Caribbean

            Asia           26.2%                                          Africa            139.9

           Africa      13.5%                                        Middle East         77.0
                                46.0%                                 Oceania /      23.9
     World, Avg.
                                                                       Australia
                     10% 20% 30% 40% 50% 60% 70% 80% 90%                              100 200 300 400 500 600 700 800 900 1000
                               2011 Penetration Rate                                              2011 Millions of Users
What to think about?
Language Barriers

“83% of the online
population can be
addressed with 10
languages”
- Bob Pearson
Top 10 Languages on the Internet


                                                                                                             2010
    English                                                                                       536.6      in Millions of Users
   Chinese                                                                            444.9

   Spanish                                 153.3

 Japanese                          99.1

Portuguese                   82.5

   German                    75.2

    Arabic                 65.4

    French                59.8

    Russia                59.7

    Korean            39.4

All the rest                                                              350.6
                     50      100     150     200      250     300     350     400    450   500   550   600
                                                            Millions of Users

               Source: Internet World Stats - www.internetworldstats.com/stats.htm
               Basis: 1,966,514,816 Internet users on June 30, 2010
               Copyright © 2000 - 2010, Miniwatts Marketing Group
Currency Options


                                                                                        (excludes USD)
            Euros                                                              11.14%
                                                                                        Source: 2Checkout
   British Pounds
           Sterling
                                                                7.18%


Canadian Dollars                          4.27%

Australian Dollars                       3.94%


   Japanese Yen         .70%

   South African        .68%
           Rand


    Mexican Peso        .64%


    Indian Rupee        .62%

                               2%   4%             6%               8%   10%      12%
                                          Percent of Transactions
Preferred Payment Methods

Survey (19,000 consumers in 15 countries)
Cards are the most popular - 69%
PayPal next most popular - 40%
Debit cards coming in third - 37%
Source: Internet Retailer
Preferred Payment Methods by Region (Online)
                        Credit Card              Bank Transfer                  COD - Cash on Delivery                  PayPal         Debit Card

            100%


            90%
                                                                                                                                   86
                                                                                                                                   %
            80%


            70%                                                                           69
                                            64                                            %                   63
            60%       59                    %                                                                 %
 Percent                                                            56
                      %
Preferred                                                           %
            50%


            40%


            30%                                                           28                           29
                           23                                             %                            % 22                             23
                                                 21
            20%            %                                                                             %                18            %
                                13 12 11
                                                 % 15                          14 13 12                            13                        13 12 11
                                                               12                                                         %
                                % %%               %                           % %%                                % 7         9             % %%
             10%                                         6 %
                                                                                               4
                                                                                                   2                 %         %
                                                        %
                                                                                               % %
                            Global              Asia Pacific               Europe         North America        Latin America        South Africa

                   Source: AC Nielson Global Consumer Attitudes Towards
                   Online Purchases
                                                                                      Region
Fraudulent Orders

              3.0
                                                                                                  Online Revenue Loss
                                                                                                  Due to Fraud Estimated
                                                                      2.5                         £2.1B in 2011
              2.5
                                                               2.3
                                                                       £
                                                                  £                        2.1
                                                                             2.0
              2.0                                        1.9                               £
                                                                                    1.7
                                                                              £
                                          1.6
                                                 1.7     £                                        Source: CyberSource and
  £ Loss                                                                            £             Merchant Risk Council
in Billions   1.5                          £     £
                            1.3
                                   1.2
                      1.1   £
                                   £
              1.0     £

               .5


                     2001   2002   2003   2004   2005   2006   2007   2008   2009   2010   2011

                                                       Per Year
Where Fraud Typically Appears
           Decreased

           5%


    Increased                                    Yes

    35%                Remainded                 46%        No
                       the Same
                                                            54%
                       60%
                                                             = % of merchants that
                                                             claim current fraudulent
                                                             orders are cleaner than
                                                             those from 12 months ago


“Friendly Fraud” over                           Fraudulent orders continue
the last 2 Years                                to look like Valid orders
Source: CyberSource and Merchant Risk Council
Countries/Regions where Merchants
have stopped shipping...
Asia Pacific
                                     Europe                                                                      60%
                                     38%


                Venezuela
                                         Ghana                                        Malaysia
                25%                      35%                                          33%
                                                                  Africa &
                               West Africa                        Middle East                    Indonesia
Latin &
Central                        35%            Nigeria
                                                                  65%                            30%
America                                       50%
30%


          2011 Riskiest Countries
          1. Nigeria - 50%          5. Venezuela - 25%              9. China, Philippines, Signapore, India, Ukraine - 15%
          2. Ghana - 35%            6. Vietnam, Russia - 23%        10. Egypt, Myanmar, Mexico - 13%
          3. Malaysia - 33%         7. Iran, South Africa - 20%
          4. Indonesia - 30%        8. Pakistan - 18%
In the past year, 25% of Merchants who accept
international orders, stopped from at least one country
due to high Fraud levels


                                Up from 20% in 2010

    Stopped

    25%


              Continue

              75%
Percent of Orders Rejected for Fraud


                                                Increase in Fraud orders
                                                outside your border


                              2.8%
                                                           7.3%
                                                           Outside your border


Source: CyberSource and Merchant Risk Council
Impact of Fraud

Real Cost = Fraud Prevention Expenditures
What are you spending?
Measure how many orders are:
    - Flagged for review?
    - Rejected for fraud?
    - Accepted that turn out to be fraudulent?
Most Effective Fraud Tools


                                                                                                             Merchants Most
            Device fingerprint results                                                                46%
                                                                                                             Effective Tools
              Fraud model (in-house)                                                       39%
        Negative lists (in-house lists)                                                   38%
                                                                                                             Source: CyberSource and
                       IP geolocation                                                     37%                Merchant Risk Council
     Paid-for public records services                                               33%
           Order velocity monitoring                                        29%
              Customer order history                                      27%
         Address Verification Service                                     26%
     CVN (Card Verification Number)                                   25%
    Contact customer to verify order                                 24%
         Multi-merchant Fraud Model                                  24%
              Payer Auth / 3D Secure                          18%
                 Credit history check                       17%
Shared negative lists - shared hotlists                    15%
                                          5%   10%   15%     20%    25%    30%      35%   40%   45%    50%
                                                             Percent of Merchants
Our Recommendation

Threshold for Loss
Fraud Model
   - Negative & Positive Lists
   - Device Finger printing
   - IP Geo Location

Outsource
Choose your Overseas Markets
Pinpoint the best country or region
   -   International traffic & order origination
   -   Cultural & language differences
   -   Economic & political policies
   -   Tariffs or trade barriers


                            SR
                            SR
Research with Social Media
          5%
     5%                Facebook users
6%                     Distribution by Countries

                            US - 34%

 7%              34%
                            Brazil - 10%
                            India - 10%

 7%                         Indonesia - 9%
                            Mexico - 7%
 7%                         UK - 7%
                 10%
      9%                    Turkey - 7%
           10%              Philippines - 6%
                            France - 5%
                            Germany - 5%

                       Source: www.checkfacebook.com
Facebook
Buy credits by country
Wall posts


LinkedIn
Groups by region
Forums
Connect with e-commerce partners
We’re here to help, cheers!
2Checkout
Stand #822


Melissa Blackburn
mblackburn@2co.com

salesteam@2co.com
+44 (0)808 234 0487
Find us at the show!


                   Stand
                   #822

More Related Content

Similar to International eCommerce

Asia’s social media map and users’ online (june 2010)
Asia’s social media map and users’ online (june 2010)Asia’s social media map and users’ online (june 2010)
Asia’s social media map and users’ online (june 2010)
Michael Netzley, Ph.D.
 
Online Video - State of the Nation December 2011
Online Video - State of the Nation December 2011Online Video - State of the Nation December 2011
Online Video - State of the Nation December 2011
Viocorp
 
Digital Media Landscap of Pakistan & Lahore
Digital Media Landscap of Pakistan & LahoreDigital Media Landscap of Pakistan & Lahore
Digital Media Landscap of Pakistan & Lahore
Waqas Nasir
 
Diversity Recruiting Social Graph.V6
Diversity Recruiting Social Graph.V6Diversity Recruiting Social Graph.V6
Diversity Recruiting Social Graph.V6
Ananda Chakravarty
 
Thinkdigitalgoogle 11-12-12comscore-121211021612-phpapp02
Thinkdigitalgoogle 11-12-12comscore-121211021612-phpapp02Thinkdigitalgoogle 11-12-12comscore-121211021612-phpapp02
Thinkdigitalgoogle 11-12-12comscore-121211021612-phpapp02
dong euro
 
comScore's Presentation Google's Think Digital Vietnam 11-Dec-2012
comScore's Presentation Google's Think Digital Vietnam 11-Dec-2012comScore's Presentation Google's Think Digital Vietnam 11-Dec-2012
comScore's Presentation Google's Think Digital Vietnam 11-Dec-2012
Joe Nguyen
 
Thinkdigitalgoogle 11-12-12comscore-121211021612-phpapp02
Thinkdigitalgoogle 11-12-12comscore-121211021612-phpapp02Thinkdigitalgoogle 11-12-12comscore-121211021612-phpapp02
Thinkdigitalgoogle 11-12-12comscore-121211021612-phpapp02
Tuong Nguyen Duy
 
Tuning in the rise of online video in latin america
Tuning in the rise of online video in latin americaTuning in the rise of online video in latin america
Tuning in the rise of online video in latin america
Bruno Jorge
 
O crescimento de vídeo online na América Latina
O crescimento de vídeo online na América LatinaO crescimento de vídeo online na América Latina
O crescimento de vídeo online na América Latina
Leonardo Diogo Silva
 
Tuning in the rise of online video in latin america (4)
Tuning in the rise of online video in latin america (4)Tuning in the rise of online video in latin america (4)
Tuning in the rise of online video in latin america (4)
FAIR PLAY AD / @VeronicaRRSouza
 
Tuning in the rise of online video in latin america
Tuning in the rise of online video in latin americaTuning in the rise of online video in latin america
Tuning in the rise of online video in latin america
SoyArmenio
 
OMMA Display 2011 -- Transformation of the Measurement Industry: How Much Can...
OMMA Display 2011 -- Transformation of the Measurement Industry: How Much Can...OMMA Display 2011 -- Transformation of the Measurement Industry: How Much Can...
OMMA Display 2011 -- Transformation of the Measurement Industry: How Much Can...
Linda Gridley
 
The state of social media_2012 Comscore report
The state of social media_2012 Comscore reportThe state of social media_2012 Comscore report
The state of social media_2012 Comscore report
Karan Bhujbal
 
The State of Social Media 2012
The State of Social Media 2012The State of Social Media 2012
The State of Social Media 2012
immediate future
 
Philippines Tourism Overview and Directions 2011 - 2016
Philippines Tourism Overview and Directions 2011 - 2016Philippines Tourism Overview and Directions 2011 - 2016
Philippines Tourism Overview and Directions 2011 - 2016
Janette Toral
 
The OCWC's Next Frontier-Learning Ecosystems.
The OCWC's Next Frontier-Learning Ecosystems. The OCWC's Next Frontier-Learning Ecosystems.
The OCWC's Next Frontier-Learning Ecosystems.
Gary Matkin, Ph.D.
 
Online Newspaper Readership in Turkey
Online Newspaper Readership in TurkeyOnline Newspaper Readership in Turkey
Online Newspaper Readership in Turkey
Deniz Utku
 
Social media
Social mediaSocial media
Social media
Laween Hamza
 
It's More Fun Investing in the Philippines
It's More Fun Investing in the PhilippinesIt's More Fun Investing in the Philippines
It's More Fun Investing in the Philippines
Aldrin Bibon
 
Grp 3 3 2008 Final 2
Grp 3 3 2008 Final 2Grp 3 3 2008 Final 2
Grp 3 3 2008 Final 2
Hugues Rey
 

Similar to International eCommerce (20)

Asia’s social media map and users’ online (june 2010)
Asia’s social media map and users’ online (june 2010)Asia’s social media map and users’ online (june 2010)
Asia’s social media map and users’ online (june 2010)
 
Online Video - State of the Nation December 2011
Online Video - State of the Nation December 2011Online Video - State of the Nation December 2011
Online Video - State of the Nation December 2011
 
Digital Media Landscap of Pakistan & Lahore
Digital Media Landscap of Pakistan & LahoreDigital Media Landscap of Pakistan & Lahore
Digital Media Landscap of Pakistan & Lahore
 
Diversity Recruiting Social Graph.V6
Diversity Recruiting Social Graph.V6Diversity Recruiting Social Graph.V6
Diversity Recruiting Social Graph.V6
 
Thinkdigitalgoogle 11-12-12comscore-121211021612-phpapp02
Thinkdigitalgoogle 11-12-12comscore-121211021612-phpapp02Thinkdigitalgoogle 11-12-12comscore-121211021612-phpapp02
Thinkdigitalgoogle 11-12-12comscore-121211021612-phpapp02
 
comScore's Presentation Google's Think Digital Vietnam 11-Dec-2012
comScore's Presentation Google's Think Digital Vietnam 11-Dec-2012comScore's Presentation Google's Think Digital Vietnam 11-Dec-2012
comScore's Presentation Google's Think Digital Vietnam 11-Dec-2012
 
Thinkdigitalgoogle 11-12-12comscore-121211021612-phpapp02
Thinkdigitalgoogle 11-12-12comscore-121211021612-phpapp02Thinkdigitalgoogle 11-12-12comscore-121211021612-phpapp02
Thinkdigitalgoogle 11-12-12comscore-121211021612-phpapp02
 
Tuning in the rise of online video in latin america
Tuning in the rise of online video in latin americaTuning in the rise of online video in latin america
Tuning in the rise of online video in latin america
 
O crescimento de vídeo online na América Latina
O crescimento de vídeo online na América LatinaO crescimento de vídeo online na América Latina
O crescimento de vídeo online na América Latina
 
Tuning in the rise of online video in latin america (4)
Tuning in the rise of online video in latin america (4)Tuning in the rise of online video in latin america (4)
Tuning in the rise of online video in latin america (4)
 
Tuning in the rise of online video in latin america
Tuning in the rise of online video in latin americaTuning in the rise of online video in latin america
Tuning in the rise of online video in latin america
 
OMMA Display 2011 -- Transformation of the Measurement Industry: How Much Can...
OMMA Display 2011 -- Transformation of the Measurement Industry: How Much Can...OMMA Display 2011 -- Transformation of the Measurement Industry: How Much Can...
OMMA Display 2011 -- Transformation of the Measurement Industry: How Much Can...
 
The state of social media_2012 Comscore report
The state of social media_2012 Comscore reportThe state of social media_2012 Comscore report
The state of social media_2012 Comscore report
 
The State of Social Media 2012
The State of Social Media 2012The State of Social Media 2012
The State of Social Media 2012
 
Philippines Tourism Overview and Directions 2011 - 2016
Philippines Tourism Overview and Directions 2011 - 2016Philippines Tourism Overview and Directions 2011 - 2016
Philippines Tourism Overview and Directions 2011 - 2016
 
The OCWC's Next Frontier-Learning Ecosystems.
The OCWC's Next Frontier-Learning Ecosystems. The OCWC's Next Frontier-Learning Ecosystems.
The OCWC's Next Frontier-Learning Ecosystems.
 
Online Newspaper Readership in Turkey
Online Newspaper Readership in TurkeyOnline Newspaper Readership in Turkey
Online Newspaper Readership in Turkey
 
Social media
Social mediaSocial media
Social media
 
It's More Fun Investing in the Philippines
It's More Fun Investing in the PhilippinesIt's More Fun Investing in the Philippines
It's More Fun Investing in the Philippines
 
Grp 3 3 2008 Final 2
Grp 3 3 2008 Final 2Grp 3 3 2008 Final 2
Grp 3 3 2008 Final 2
 

Recently uploaded

amptalk_RecruitingDeck_english_2024.06.05
amptalk_RecruitingDeck_english_2024.06.05amptalk_RecruitingDeck_english_2024.06.05
amptalk_RecruitingDeck_english_2024.06.05
marketing317746
 
Event Report - SAP Sapphire 2024 Orlando - lots of innovation and old challenges
Event Report - SAP Sapphire 2024 Orlando - lots of innovation and old challengesEvent Report - SAP Sapphire 2024 Orlando - lots of innovation and old challenges
Event Report - SAP Sapphire 2024 Orlando - lots of innovation and old challenges
Holger Mueller
 
Lundin Gold Corporate Presentation - June 2024
Lundin Gold Corporate Presentation - June 2024Lundin Gold Corporate Presentation - June 2024
Lundin Gold Corporate Presentation - June 2024
Adnet Communications
 
Mastering B2B Payments Webinar from BlueSnap
Mastering B2B Payments Webinar from BlueSnapMastering B2B Payments Webinar from BlueSnap
Mastering B2B Payments Webinar from BlueSnap
Norma Mushkat Gaffin
 
Organizational Change Leadership Agile Tour Geneve 2024
Organizational Change Leadership Agile Tour Geneve 2024Organizational Change Leadership Agile Tour Geneve 2024
Organizational Change Leadership Agile Tour Geneve 2024
Kirill Klimov
 
Industrial Tech SW: Category Renewal and Creation
Industrial Tech SW:  Category Renewal and CreationIndustrial Tech SW:  Category Renewal and Creation
Industrial Tech SW: Category Renewal and Creation
Christian Dahlen
 
Dpboss Matka Guessing Satta Matta Matka Kalyan Chart Satta Matka
Dpboss Matka Guessing Satta Matta Matka Kalyan Chart Satta MatkaDpboss Matka Guessing Satta Matta Matka Kalyan Chart Satta Matka
Dpboss Matka Guessing Satta Matta Matka Kalyan Chart Satta Matka
➒➌➎➏➑➐➋➑➐➐Dpboss Matka Guessing Satta Matka Kalyan Chart Indian Matka
 
Chapter 7 Final business management sciences .ppt
Chapter 7 Final business management sciences .pptChapter 7 Final business management sciences .ppt
Chapter 7 Final business management sciences .ppt
ssuser567e2d
 
Top mailing list providers in the USA.pptx
Top mailing list providers in the USA.pptxTop mailing list providers in the USA.pptx
Top mailing list providers in the USA.pptx
JeremyPeirce1
 
Digital Transformation Frameworks: Driving Digital Excellence
Digital Transformation Frameworks: Driving Digital ExcellenceDigital Transformation Frameworks: Driving Digital Excellence
Digital Transformation Frameworks: Driving Digital Excellence
Operational Excellence Consulting
 
Call 8867766396 Satta Matka Dpboss Matka Guessing Satta batta Matka 420 Satta...
Call 8867766396 Satta Matka Dpboss Matka Guessing Satta batta Matka 420 Satta...Call 8867766396 Satta Matka Dpboss Matka Guessing Satta batta Matka 420 Satta...
Call 8867766396 Satta Matka Dpboss Matka Guessing Satta batta Matka 420 Satta...
bosssp10
 
Business storytelling: key ingredients to a story
Business storytelling: key ingredients to a storyBusiness storytelling: key ingredients to a story
Business storytelling: key ingredients to a story
Alexandra Fulford
 
HOW TO START UP A COMPANY A STEP-BY-STEP GUIDE.pdf
HOW TO START UP A COMPANY A STEP-BY-STEP GUIDE.pdfHOW TO START UP A COMPANY A STEP-BY-STEP GUIDE.pdf
HOW TO START UP A COMPANY A STEP-BY-STEP GUIDE.pdf
46adnanshahzad
 
Unveiling the Dynamic Personalities, Key Dates, and Horoscope Insights: Gemin...
Unveiling the Dynamic Personalities, Key Dates, and Horoscope Insights: Gemin...Unveiling the Dynamic Personalities, Key Dates, and Horoscope Insights: Gemin...
Unveiling the Dynamic Personalities, Key Dates, and Horoscope Insights: Gemin...
my Pandit
 
The 10 Most Influential Leaders Guiding Corporate Evolution, 2024.pdf
The 10 Most Influential Leaders Guiding Corporate Evolution, 2024.pdfThe 10 Most Influential Leaders Guiding Corporate Evolution, 2024.pdf
The 10 Most Influential Leaders Guiding Corporate Evolution, 2024.pdf
thesiliconleaders
 
The Heart of Leadership_ How Emotional Intelligence Drives Business Success B...
The Heart of Leadership_ How Emotional Intelligence Drives Business Success B...The Heart of Leadership_ How Emotional Intelligence Drives Business Success B...
The Heart of Leadership_ How Emotional Intelligence Drives Business Success B...
Stephen Cashman
 
-- June 2024 is National Volunteer Month --
-- June 2024 is National Volunteer Month ---- June 2024 is National Volunteer Month --
-- June 2024 is National Volunteer Month --
NZSG
 
Zodiac Signs and Food Preferences_ What Your Sign Says About Your Taste
Zodiac Signs and Food Preferences_ What Your Sign Says About Your TasteZodiac Signs and Food Preferences_ What Your Sign Says About Your Taste
Zodiac Signs and Food Preferences_ What Your Sign Says About Your Taste
my Pandit
 
Best practices for project execution and delivery
Best practices for project execution and deliveryBest practices for project execution and delivery
Best practices for project execution and delivery
CLIVE MINCHIN
 
Authentically Social by Corey Perlman - EO Puerto Rico
Authentically Social by Corey Perlman - EO Puerto RicoAuthentically Social by Corey Perlman - EO Puerto Rico
Authentically Social by Corey Perlman - EO Puerto Rico
Corey Perlman, Social Media Speaker and Consultant
 

Recently uploaded (20)

amptalk_RecruitingDeck_english_2024.06.05
amptalk_RecruitingDeck_english_2024.06.05amptalk_RecruitingDeck_english_2024.06.05
amptalk_RecruitingDeck_english_2024.06.05
 
Event Report - SAP Sapphire 2024 Orlando - lots of innovation and old challenges
Event Report - SAP Sapphire 2024 Orlando - lots of innovation and old challengesEvent Report - SAP Sapphire 2024 Orlando - lots of innovation and old challenges
Event Report - SAP Sapphire 2024 Orlando - lots of innovation and old challenges
 
Lundin Gold Corporate Presentation - June 2024
Lundin Gold Corporate Presentation - June 2024Lundin Gold Corporate Presentation - June 2024
Lundin Gold Corporate Presentation - June 2024
 
Mastering B2B Payments Webinar from BlueSnap
Mastering B2B Payments Webinar from BlueSnapMastering B2B Payments Webinar from BlueSnap
Mastering B2B Payments Webinar from BlueSnap
 
Organizational Change Leadership Agile Tour Geneve 2024
Organizational Change Leadership Agile Tour Geneve 2024Organizational Change Leadership Agile Tour Geneve 2024
Organizational Change Leadership Agile Tour Geneve 2024
 
Industrial Tech SW: Category Renewal and Creation
Industrial Tech SW:  Category Renewal and CreationIndustrial Tech SW:  Category Renewal and Creation
Industrial Tech SW: Category Renewal and Creation
 
Dpboss Matka Guessing Satta Matta Matka Kalyan Chart Satta Matka
Dpboss Matka Guessing Satta Matta Matka Kalyan Chart Satta MatkaDpboss Matka Guessing Satta Matta Matka Kalyan Chart Satta Matka
Dpboss Matka Guessing Satta Matta Matka Kalyan Chart Satta Matka
 
Chapter 7 Final business management sciences .ppt
Chapter 7 Final business management sciences .pptChapter 7 Final business management sciences .ppt
Chapter 7 Final business management sciences .ppt
 
Top mailing list providers in the USA.pptx
Top mailing list providers in the USA.pptxTop mailing list providers in the USA.pptx
Top mailing list providers in the USA.pptx
 
Digital Transformation Frameworks: Driving Digital Excellence
Digital Transformation Frameworks: Driving Digital ExcellenceDigital Transformation Frameworks: Driving Digital Excellence
Digital Transformation Frameworks: Driving Digital Excellence
 
Call 8867766396 Satta Matka Dpboss Matka Guessing Satta batta Matka 420 Satta...
Call 8867766396 Satta Matka Dpboss Matka Guessing Satta batta Matka 420 Satta...Call 8867766396 Satta Matka Dpboss Matka Guessing Satta batta Matka 420 Satta...
Call 8867766396 Satta Matka Dpboss Matka Guessing Satta batta Matka 420 Satta...
 
Business storytelling: key ingredients to a story
Business storytelling: key ingredients to a storyBusiness storytelling: key ingredients to a story
Business storytelling: key ingredients to a story
 
HOW TO START UP A COMPANY A STEP-BY-STEP GUIDE.pdf
HOW TO START UP A COMPANY A STEP-BY-STEP GUIDE.pdfHOW TO START UP A COMPANY A STEP-BY-STEP GUIDE.pdf
HOW TO START UP A COMPANY A STEP-BY-STEP GUIDE.pdf
 
Unveiling the Dynamic Personalities, Key Dates, and Horoscope Insights: Gemin...
Unveiling the Dynamic Personalities, Key Dates, and Horoscope Insights: Gemin...Unveiling the Dynamic Personalities, Key Dates, and Horoscope Insights: Gemin...
Unveiling the Dynamic Personalities, Key Dates, and Horoscope Insights: Gemin...
 
The 10 Most Influential Leaders Guiding Corporate Evolution, 2024.pdf
The 10 Most Influential Leaders Guiding Corporate Evolution, 2024.pdfThe 10 Most Influential Leaders Guiding Corporate Evolution, 2024.pdf
The 10 Most Influential Leaders Guiding Corporate Evolution, 2024.pdf
 
The Heart of Leadership_ How Emotional Intelligence Drives Business Success B...
The Heart of Leadership_ How Emotional Intelligence Drives Business Success B...The Heart of Leadership_ How Emotional Intelligence Drives Business Success B...
The Heart of Leadership_ How Emotional Intelligence Drives Business Success B...
 
-- June 2024 is National Volunteer Month --
-- June 2024 is National Volunteer Month ---- June 2024 is National Volunteer Month --
-- June 2024 is National Volunteer Month --
 
Zodiac Signs and Food Preferences_ What Your Sign Says About Your Taste
Zodiac Signs and Food Preferences_ What Your Sign Says About Your TasteZodiac Signs and Food Preferences_ What Your Sign Says About Your Taste
Zodiac Signs and Food Preferences_ What Your Sign Says About Your Taste
 
Best practices for project execution and delivery
Best practices for project execution and deliveryBest practices for project execution and delivery
Best practices for project execution and delivery
 
Authentically Social by Corey Perlman - EO Puerto Rico
Authentically Social by Corey Perlman - EO Puerto RicoAuthentically Social by Corey Perlman - EO Puerto Rico
Authentically Social by Corey Perlman - EO Puerto Rico
 

International eCommerce

  • 2. International E-commerce The benefits and challenges of selling globally
  • 3. Growth of E-commerce 3.4% 1.1% 6.2% Internet users in the world Distribution by World Regions - 2011 10.4% Asia - 48.8% 48.8% Europe - 22.1% 12.0% North America - 12.0% Lat Am / Caribb - 10.4% Africa - 6.2% 22.1% Middle East - 3.4% Oceania / Australia - 1.1% Source: Internet World Stats - www.internetworldstats.com/stats.htm Basis: 2,267,233,742 Internet users on December 31, 2011 Copyright © 2012, Miniwatts Marketing Group
  • 4. The e-commerce market is poised for explosive growth... globally US EU Asia ROW Worldwide e-Commerce Growth 2010 £102.8 £121.0 £96.5 £34.6 £355.0 Projection in Billions of GBP 2013 £145.9 £175.5 £200.3 £75.5 £597.1 Source: Goldman Sachs CAGR 12.4% 13.2% 27.5% 29.1% 19.4% Source: Internet World Stats www.internetworldstats.com/stats.htm North America 78.6% Oceania/Australia 67.5% Asia 1016.8 Europe 61.3% Europe 500.7 Latin America / 39.5% North America 273.1 Caribbean 35.6% Latin America / 235.8 Middle East Caribbean Asia 26.2% Africa 139.9 Africa 13.5% Middle East 77.0 46.0% Oceania / 23.9 World, Avg. Australia 10% 20% 30% 40% 50% 60% 70% 80% 90% 100 200 300 400 500 600 700 800 900 1000 2011 Penetration Rate 2011 Millions of Users
  • 5. What to think about?
  • 6. Language Barriers “83% of the online population can be addressed with 10 languages” - Bob Pearson
  • 7. Top 10 Languages on the Internet 2010 English 536.6 in Millions of Users Chinese 444.9 Spanish 153.3 Japanese 99.1 Portuguese 82.5 German 75.2 Arabic 65.4 French 59.8 Russia 59.7 Korean 39.4 All the rest 350.6 50 100 150 200 250 300 350 400 450 500 550 600 Millions of Users Source: Internet World Stats - www.internetworldstats.com/stats.htm Basis: 1,966,514,816 Internet users on June 30, 2010 Copyright © 2000 - 2010, Miniwatts Marketing Group
  • 8. Currency Options (excludes USD) Euros 11.14% Source: 2Checkout British Pounds Sterling 7.18% Canadian Dollars 4.27% Australian Dollars 3.94% Japanese Yen .70% South African .68% Rand Mexican Peso .64% Indian Rupee .62% 2% 4% 6% 8% 10% 12% Percent of Transactions
  • 9. Preferred Payment Methods Survey (19,000 consumers in 15 countries) Cards are the most popular - 69% PayPal next most popular - 40% Debit cards coming in third - 37% Source: Internet Retailer
  • 10. Preferred Payment Methods by Region (Online) Credit Card Bank Transfer COD - Cash on Delivery PayPal Debit Card 100% 90% 86 % 80% 70% 69 64 % 63 60% 59 % % Percent 56 % Preferred % 50% 40% 30% 28 29 23 % % 22 23 21 20% % % 18 % 13 12 11 % 15 14 13 12 13 13 12 11 12 % % %% % % %% % 7 9 % %% 10% 6 % 4 2 % % % % % Global Asia Pacific Europe North America Latin America South Africa Source: AC Nielson Global Consumer Attitudes Towards Online Purchases Region
  • 11. Fraudulent Orders 3.0 Online Revenue Loss Due to Fraud Estimated 2.5 £2.1B in 2011 2.5 2.3 £ £ 2.1 2.0 2.0 1.9 £ 1.7 £ 1.6 1.7 £ Source: CyberSource and £ Loss £ Merchant Risk Council in Billions 1.5 £ £ 1.3 1.2 1.1 £ £ 1.0 £ .5 2001 2002 2003 2004 2005 2006 2007 2008 2009 2010 2011 Per Year
  • 12. Where Fraud Typically Appears Decreased 5% Increased Yes 35% Remainded 46% No the Same 54% 60% = % of merchants that claim current fraudulent orders are cleaner than those from 12 months ago “Friendly Fraud” over Fraudulent orders continue the last 2 Years to look like Valid orders Source: CyberSource and Merchant Risk Council
  • 14. Asia Pacific Europe 60% 38% Venezuela Ghana Malaysia 25% 35% 33% Africa & West Africa Middle East Indonesia Latin & Central 35% Nigeria 65% 30% America 50% 30% 2011 Riskiest Countries 1. Nigeria - 50% 5. Venezuela - 25% 9. China, Philippines, Signapore, India, Ukraine - 15% 2. Ghana - 35% 6. Vietnam, Russia - 23% 10. Egypt, Myanmar, Mexico - 13% 3. Malaysia - 33% 7. Iran, South Africa - 20% 4. Indonesia - 30% 8. Pakistan - 18%
  • 15. In the past year, 25% of Merchants who accept international orders, stopped from at least one country due to high Fraud levels Up from 20% in 2010 Stopped 25% Continue 75%
  • 16. Percent of Orders Rejected for Fraud Increase in Fraud orders outside your border 2.8% 7.3% Outside your border Source: CyberSource and Merchant Risk Council
  • 17. Impact of Fraud Real Cost = Fraud Prevention Expenditures What are you spending? Measure how many orders are: - Flagged for review? - Rejected for fraud? - Accepted that turn out to be fraudulent?
  • 18. Most Effective Fraud Tools Merchants Most Device fingerprint results 46% Effective Tools Fraud model (in-house) 39% Negative lists (in-house lists) 38% Source: CyberSource and IP geolocation 37% Merchant Risk Council Paid-for public records services 33% Order velocity monitoring 29% Customer order history 27% Address Verification Service 26% CVN (Card Verification Number) 25% Contact customer to verify order 24% Multi-merchant Fraud Model 24% Payer Auth / 3D Secure 18% Credit history check 17% Shared negative lists - shared hotlists 15% 5% 10% 15% 20% 25% 30% 35% 40% 45% 50% Percent of Merchants
  • 19. Our Recommendation Threshold for Loss Fraud Model - Negative & Positive Lists - Device Finger printing - IP Geo Location Outsource
  • 20. Choose your Overseas Markets Pinpoint the best country or region - International traffic & order origination - Cultural & language differences - Economic & political policies - Tariffs or trade barriers SR SR
  • 21. Research with Social Media 5% 5% Facebook users 6% Distribution by Countries US - 34% 7% 34% Brazil - 10% India - 10% 7% Indonesia - 9% Mexico - 7% 7% UK - 7% 10% 9% Turkey - 7% 10% Philippines - 6% France - 5% Germany - 5% Source: www.checkfacebook.com
  • 22. Facebook Buy credits by country Wall posts LinkedIn Groups by region Forums Connect with e-commerce partners
  • 23. We’re here to help, cheers! 2Checkout Stand #822 Melissa Blackburn mblackburn@2co.com salesteam@2co.com +44 (0)808 234 0487
  • 24. Find us at the show! Stand #822