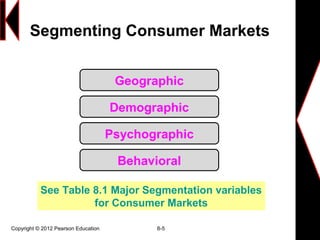
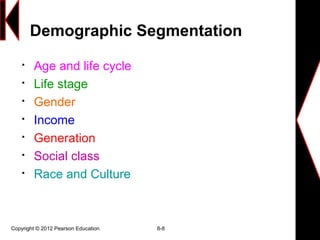
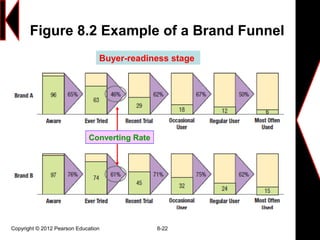
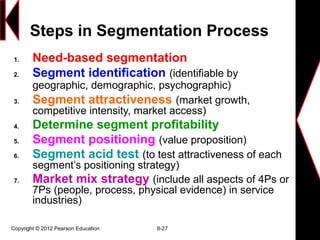
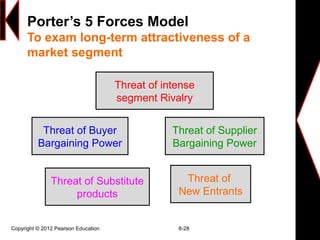
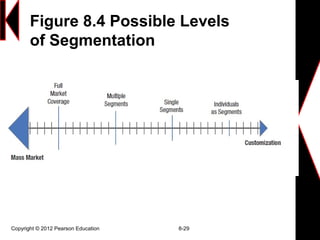
8
Identifying Market
Segments and Targets
1
Copyright © 2012 Pearson Education 8-2
Chapter Questions

What are the different levels of market
segmentation?

How can a company divide a market into
segments?

What are the requirements for effective
segmentation?

How should business markets be segmented?

How should a company choose the most
attractive target markets?
Copyright © 2012 Pearson Education 8-3
Effective Targeting Requires…

Identify and profile distinct groups of buyers
who differ in their needs and preferences

Select one or more market segments to enter

Establish and communicate the distinctive
benefits of the market offering
Copyright © 2012 Pearson Education 8-4
What is a Market Segment?
A market segment consists of a group
of customers who share a similar set
of
Needs
and wants.
Copyright © 2012 Pearson Education 8-5
Segmenting Consumer Markets
Geographic
Demographic
Psychographic
Behavioral
See Table 8.1 Major Segmentation variables
for Consumer Markets
Geographic Segmentation
Copyright © 2012 Pearson Education 8-6
Copyright © 2012 Pearson Education 8-7
Claritas’ Prizm
Geoclustering Approach called PRIZM:
Taking 39 factors in 5 broad categories:
1. Education and affluence
2. Family life cycle
3. Urbanization
4. Race and ethnicity
5. Mobility
Copyright © 2012 Pearson Education 8-8
Demographic Segmentation

Age and life cycle

Life stage

Gender

Income

Generation

Social class

Race and Culture
Age and Lifecycle Stage
Copyright © 2012 Pearson Education 8-9
Consumers wants and abilities change with age
Psychologically young: Baby boomers seeking to stay young by ?
Gender and Income
Copyright © 2012 Pearson Education 8-10
Men and women are different in attitudes and behave differently
Women need underwear, but women want lingerie
Generational Influences
Copyright © 2012 Pearson Education 8-11
• Each generation or cohort
is profoundly influenced
by the times in which it
grows up –
Music, movies, politics,
and defining events of
that period
Table 8.3 Profiling U.S. Generation Cohorts
Generation
Cohort
Birth
Range
Defining Features
Gen Y
78 million
1979~1994 Raised with relative affluence,
technologically plugged in and
concerned with the environment and
social issues, independence, and
immunity from marketing
Gen X
50 million
1964~1978 Bridge the technological savvy of
Gen Y with the adult realities of the
baby boomers
Baby
Boomers 76
million
1946~1964 Embrace products and lifestyles that
allow them to turn back the hands of
time
Silent
Generation
42 million
1925~1945 Defying their advancing age, they
maintain active lives and products
and marketing that help them to
achieve that
Race and Culture
Copyright © 2012 Pearson Education 8-13

Psychographic is the science of using
psychology and demographics to better
understand consumers

PS: Buyers are divided into different groups on
the basis of psychological/personality traits,
lifestyle, or values

People in the same demographic group can
exhibit very different psychographic profiles

VALS framework: signifying values and
lifestyles based on a questionnaire featuring 4
demographic and 35 attitudinal questions
Psychographic Segmentation
and The VALS Framework
Copyright © 2012 Pearson Education 8-15

Horizontal dimension: Consumer motivation
1. Ideals are guided by knowledge and
principles
2. Achievement looks for products and
services that demonstrate success to their
peers
3. Self-expression desires social or physical
activity, variety, and risk

Vertical dimension: Consumer resources
different levels of resources enhance or
constrain a person’s expression of his or her
primary motivation
Psychographic Segmentation
The four groups with higher resources are:
1. Innovators: Successful, sophisticated, active, “ take
charge” people with high self-esteem. Purchases
often reflect cultivated tastes for relatively upscale,
niche-oriented products and services
2. Thinkers: Mature, satisfied, and reflective people
motivated by ideals and who value order, knowledge,
and responsibilities. They seek durability,
functionality, and value in products
3. Achievers: Successful, goal-oriented people who
focus on career and family. They favor premium
products that demonstrate success to their peers
4. Experiencers: Young, enthusiastic, impulsive people
who seek variety and excitement. They spend a
comparatively high proportion of income on fashion,
entertainment, and socializing
VALS Framework
The four groups with lower resources are:
1. Believers: conservative, conventional, and traditional
people with concrete beliefs. They prefer familiar,
U.S.-made products and are loyal to established
brands
2. Strivers: Trendy and fun-loving people who are
resource-constrained. They favor stylish products
that emulate the purchases of those with greater
material wealth
3. Makers: Practical, down-to-earth, self-sufficient
people who like to work with their hands. They seek
U.S.-made products with a practical or functional
purpose
4. Survivors: Elderly, passive people concerned about
change and loyal to their favorable brands
VALS Framework
Behavioral Segmentation Based
on Needs and Benefits
Copyright © 2012 Pearson Education 8-19
Needs-based or benefit-based segmentation
is a widely used approach
Copyright © 2012 Pearson Education 8-20
Behavioral Segmentation:
Decision Roles
Initiator
Influencer
Decider
Buyer
User
Behavioral Segmentation:
Behavioral Variables

Occasions (how
often, the time)

User Status
(nonusers, ex-users,
potential users, first-
time users, and regular
users)

Usage Rate (light,
medium, & heavy
product users)

Buyer-Readiness
(unaware, aware,
informed, interested,
desired, intended to buy)

Loyalty Status (Hard-
core, split, shifting loyals
& switchers)

Attitude (enthusiastic,
positive, indifferent,
negative & hostile)
Copyright © 2012 Pearson Education 8-21
Figure 8.2 Example of a Brand Funnel
Copyright © 2012 Pearson Education 8-22
Buyer-readiness stage
Converting Rate
Copyright © 2012 Pearson Education 8-23
Loyalty Status

Hard-core
(loyal to one brand)

Split loyals (loyal
to two or three brands)

Shifting loyals
(shift from one to
another brand)

Switchers (no
loyalty to any brand)
Figure 8.3 Behavioral
Segmentation Breakdown
Copyright © 2012 Pearson Education 8-24
Copyright © 2012 Pearson Education 8-25
Segmenting for Business Markets

Demographic

Operating variable

Purchasing approaches

Situational factors

Personal characteristics
Copyright © 2012 Pearson Education 8-26
Effective Segmentation Criteria

Measurable: Size, purchasing power and
characteristics of the segments can be measured

Substantial: Segments are large and profitable
enough to serve

Accessible: Segments can be effectively reached
and served

Differentiable: Segments are conceptually
distinguishable and respond differently to different
market-mix elements and programs

Actionable: Effective programs can be formulated
for attracting and serving the segments
Market Targeting
Copyright © 2012 Pearson Education 8-27
Steps in Segmentation Process
1. Need-based segmentation
2. Segment identification (identifiable by
geographic, demographic, psychographic)
3. Segment attractiveness (market growth,
competitive intensity, market access)
4. Determine segment profitability
5. Segment positioning (value proposition)
6. Segment acid test (to test attractiveness of each
segment’s positioning strategy)
7. Market mix strategy (include all aspects of 4Ps or
7Ps (people, process, physical evidence) in service
industries)
Porter’s 5 Forces Model
To exam long-term attractiveness of a
market segment
Copyright © 2012 Pearson Education 8-28
Threat of intense
segment Rivalry
Threat of Supplier
Bargaining Power
Threat of Buyer
Bargaining Power
Threat of
New Entrants
Threat of Substitute
products
Figure 8.4 Possible Levels
of Segmentation
Copyright © 2012 Pearson Education 8-29
For Review

What are the different levels of market
segmentation?

How can a company divide a market into
segments?

What are the requirements for effective
segmentation?

How should business markets be segmented?

How should a company choose the most
attractive target markets?
Copyright © 2012 Pearson Education 8-30

Kotler14e ippt ch8

  • 1.
  • 2.
    Copyright © 2012Pearson Education 8-2 Chapter Questions  What are the different levels of market segmentation?  How can a company divide a market into segments?  What are the requirements for effective segmentation?  How should business markets be segmented?  How should a company choose the most attractive target markets?
  • 3.
    Copyright © 2012Pearson Education 8-3 Effective Targeting Requires…  Identify and profile distinct groups of buyers who differ in their needs and preferences  Select one or more market segments to enter  Establish and communicate the distinctive benefits of the market offering
  • 4.
    Copyright © 2012Pearson Education 8-4 What is a Market Segment? A market segment consists of a group of customers who share a similar set of Needs and wants.
  • 5.
    Copyright © 2012Pearson Education 8-5 Segmenting Consumer Markets Geographic Demographic Psychographic Behavioral See Table 8.1 Major Segmentation variables for Consumer Markets
  • 6.
    Geographic Segmentation Copyright ©2012 Pearson Education 8-6
  • 7.
    Copyright © 2012Pearson Education 8-7 Claritas’ Prizm Geoclustering Approach called PRIZM: Taking 39 factors in 5 broad categories: 1. Education and affluence 2. Family life cycle 3. Urbanization 4. Race and ethnicity 5. Mobility
  • 8.
    Copyright © 2012Pearson Education 8-8 Demographic Segmentation  Age and life cycle  Life stage  Gender  Income  Generation  Social class  Race and Culture
  • 9.
    Age and LifecycleStage Copyright © 2012 Pearson Education 8-9 Consumers wants and abilities change with age Psychologically young: Baby boomers seeking to stay young by ?
  • 10.
    Gender and Income Copyright© 2012 Pearson Education 8-10 Men and women are different in attitudes and behave differently Women need underwear, but women want lingerie
  • 11.
    Generational Influences Copyright ©2012 Pearson Education 8-11 • Each generation or cohort is profoundly influenced by the times in which it grows up – Music, movies, politics, and defining events of that period
  • 12.
    Table 8.3 ProfilingU.S. Generation Cohorts Generation Cohort Birth Range Defining Features Gen Y 78 million 1979~1994 Raised with relative affluence, technologically plugged in and concerned with the environment and social issues, independence, and immunity from marketing Gen X 50 million 1964~1978 Bridge the technological savvy of Gen Y with the adult realities of the baby boomers Baby Boomers 76 million 1946~1964 Embrace products and lifestyles that allow them to turn back the hands of time Silent Generation 42 million 1925~1945 Defying their advancing age, they maintain active lives and products and marketing that help them to achieve that
  • 13.
    Race and Culture Copyright© 2012 Pearson Education 8-13
  • 14.
     Psychographic is thescience of using psychology and demographics to better understand consumers  PS: Buyers are divided into different groups on the basis of psychological/personality traits, lifestyle, or values  People in the same demographic group can exhibit very different psychographic profiles  VALS framework: signifying values and lifestyles based on a questionnaire featuring 4 demographic and 35 attitudinal questions Psychographic Segmentation
  • 15.
    Psychographic Segmentation and TheVALS Framework Copyright © 2012 Pearson Education 8-15
  • 16.
     Horizontal dimension: Consumermotivation 1. Ideals are guided by knowledge and principles 2. Achievement looks for products and services that demonstrate success to their peers 3. Self-expression desires social or physical activity, variety, and risk  Vertical dimension: Consumer resources different levels of resources enhance or constrain a person’s expression of his or her primary motivation Psychographic Segmentation
  • 17.
    The four groupswith higher resources are: 1. Innovators: Successful, sophisticated, active, “ take charge” people with high self-esteem. Purchases often reflect cultivated tastes for relatively upscale, niche-oriented products and services 2. Thinkers: Mature, satisfied, and reflective people motivated by ideals and who value order, knowledge, and responsibilities. They seek durability, functionality, and value in products 3. Achievers: Successful, goal-oriented people who focus on career and family. They favor premium products that demonstrate success to their peers 4. Experiencers: Young, enthusiastic, impulsive people who seek variety and excitement. They spend a comparatively high proportion of income on fashion, entertainment, and socializing VALS Framework
  • 18.
    The four groupswith lower resources are: 1. Believers: conservative, conventional, and traditional people with concrete beliefs. They prefer familiar, U.S.-made products and are loyal to established brands 2. Strivers: Trendy and fun-loving people who are resource-constrained. They favor stylish products that emulate the purchases of those with greater material wealth 3. Makers: Practical, down-to-earth, self-sufficient people who like to work with their hands. They seek U.S.-made products with a practical or functional purpose 4. Survivors: Elderly, passive people concerned about change and loyal to their favorable brands VALS Framework
  • 19.
    Behavioral Segmentation Based onNeeds and Benefits Copyright © 2012 Pearson Education 8-19 Needs-based or benefit-based segmentation is a widely used approach
  • 20.
    Copyright © 2012Pearson Education 8-20 Behavioral Segmentation: Decision Roles Initiator Influencer Decider Buyer User
  • 21.
    Behavioral Segmentation: Behavioral Variables  Occasions(how often, the time)  User Status (nonusers, ex-users, potential users, first- time users, and regular users)  Usage Rate (light, medium, & heavy product users)  Buyer-Readiness (unaware, aware, informed, interested, desired, intended to buy)  Loyalty Status (Hard- core, split, shifting loyals & switchers)  Attitude (enthusiastic, positive, indifferent, negative & hostile) Copyright © 2012 Pearson Education 8-21
  • 22.
    Figure 8.2 Exampleof a Brand Funnel Copyright © 2012 Pearson Education 8-22 Buyer-readiness stage Converting Rate
  • 23.
    Copyright © 2012Pearson Education 8-23 Loyalty Status  Hard-core (loyal to one brand)  Split loyals (loyal to two or three brands)  Shifting loyals (shift from one to another brand)  Switchers (no loyalty to any brand)
  • 24.
    Figure 8.3 Behavioral SegmentationBreakdown Copyright © 2012 Pearson Education 8-24
  • 25.
    Copyright © 2012Pearson Education 8-25 Segmenting for Business Markets  Demographic  Operating variable  Purchasing approaches  Situational factors  Personal characteristics
  • 26.
    Copyright © 2012Pearson Education 8-26 Effective Segmentation Criteria  Measurable: Size, purchasing power and characteristics of the segments can be measured  Substantial: Segments are large and profitable enough to serve  Accessible: Segments can be effectively reached and served  Differentiable: Segments are conceptually distinguishable and respond differently to different market-mix elements and programs  Actionable: Effective programs can be formulated for attracting and serving the segments Market Targeting
  • 27.
    Copyright © 2012Pearson Education 8-27 Steps in Segmentation Process 1. Need-based segmentation 2. Segment identification (identifiable by geographic, demographic, psychographic) 3. Segment attractiveness (market growth, competitive intensity, market access) 4. Determine segment profitability 5. Segment positioning (value proposition) 6. Segment acid test (to test attractiveness of each segment’s positioning strategy) 7. Market mix strategy (include all aspects of 4Ps or 7Ps (people, process, physical evidence) in service industries)
  • 28.
    Porter’s 5 ForcesModel To exam long-term attractiveness of a market segment Copyright © 2012 Pearson Education 8-28 Threat of intense segment Rivalry Threat of Supplier Bargaining Power Threat of Buyer Bargaining Power Threat of New Entrants Threat of Substitute products
  • 29.
    Figure 8.4 PossibleLevels of Segmentation Copyright © 2012 Pearson Education 8-29
  • 30.
    For Review  What arethe different levels of market segmentation?  How can a company divide a market into segments?  What are the requirements for effective segmentation?  How should business markets be segmented?  How should a company choose the most attractive target markets? Copyright © 2012 Pearson Education 8-30

Editor's Notes

  • #3 Companies cannot connect with all customers in large, broad, or diverse markets. But they can divide such markets into groups of consumers or segments with distinct needs and wants. A company then needs to identify which market segments it can serve effectively. This decision requires a keen understanding of consumer behavior and careful strategic thinking. To develop the best marketing plans, managers need to understand what makes each segment unique and different. Identifying and satisfying the right market segments is often the key to marketing success.
  • #4 Companies cannot connect with all customers in large, broad, or diverse markets. But they can divide such markets into groups of consumers or segments with distinct needs and wants. A company then needs to identify which market segments it can serve effectively. This decision requires a keen understanding of consumer behavior and careful strategic thinking. To develop the best marketing plans, managers need to understand what makes each segment unique and different. Identifying and satisfying the right market segments is often the key to marketing success.
  • #5 Market segmentation divides a market into well-defined slices. A market segment consists of a group of customers who share a similar set of needs and wants. The marketer’s task is to identify the appropriate number and nature of market segments and decide which one(s) to target. We use two broad groups of variables to segment consumer markets. Some researchers try to define segments by looking at descriptive characteristics: geographic, demographic, and psychographic. Then they examine whether these customer segments exhibit different needs or product responses. For example, they might examine the differing attitudes of “professionals,”“blue collars,” and other groups toward, say, “safety” as a car benefit. Other researchers try to define segments by looking at behavioral considerations, such as consumer responses to benefits, usage occasions, or brands.
  • #6 The major segmentation variables—geographic, demographic, psychographic, and behavioral segmentation—are summarized in Table 8.1.
  • #7 Geographic segmentation divides the market into geographical units such as nations, states, regions, counties, cities, or neighborhoods. The company can operate in one or a few areas, or it can operate in all but pay attention to local variations. In that way it can tailor marketing programs to the needs and wants of local customer groups in trading areas, neighborhoods, even individual stores.
  • #8 Some approaches combine geographic data with demographic data to yield even richer descriptions of consumers and neighborhoods. Nielsen Claritas has developed a geoclustering approach called PRIZM (Potential Rating Index by Zip Markets) that classifies over half a million U.S. residential neighborhoods into 14 distinct groups and 66 distinct lifestyle segments called PRIZM Clusters. The groupings take into consideration 39 factors in five broad categories: (1) education and affluence, (2) family life cycle, (3) urbanization, (4) race and ethnicity, and (5) mobility. The neighborhoods are broken down by zip code, zip+4, or census tract and block group. The clusters have descriptive titles such as Blue Blood Estates, Winner’s Circle, Hometown Retired, Shotguns and Pickups, and Back Country Folks. The inhabitants in a cluster tend to lead similar lives, drive similar cars, have similar jobs, and read similar magazines. Table 8.2 has examples of four PRIZM clusters.
  • #9 In demographic segmentation, we divide the market on variables such as age, family size, family life cycle, gender, income, occupation, education, religion, race, generation, nationality, and social class. One reason demographic variables are so popular with marketers is that they’re often associated with consumer needs and wants. Another is that they’re easy to measure. Even when we describe the target market in nondemographic terms (say, by personality type), we may need the link back to demographic characteristics in order to estimate the size of the market and the media we should use to reach it efficiently.
  • #10 Consumer wants and abilities change with age. People in the same part of the life cycle may still differ in their life stage. Life stage defines a person’s major concern, such as going through a divorce, going into a second marriage, taking care of an older parent, deciding to cohabit with another person, deciding to buy a new home, and so on. These life stages present opportunities for marketers who can help people cope with their major concerns
  • #11 Men and women have different attitudes and behave differently, based partly on genetic makeup and partly on socialization. Women tend to be more communal-minded and men more self-expressive and goal-directed; women tend to take in more of the data in their immediate environment and men to focus on the part of the environment that helps them achieve a goal. A research study examining how men and women shop found that men often need to be invited to touch a product, whereas women are likely to pick it up without prompting. Men often like to read product information; women may relate to a product on a more personal level. Victoria’s Secret studied women and learned that while women need underwear, they want lingerie. It went on to develop the retail chain very successfully based on this insight. Income segmentation is a long-standing practice in such categories as automobiles, clothing, cosmetics, financial services, and travel. However, income does not always predict the best customers for a given product. Blue-collar workers were among the first purchasers of color television sets; it was cheaper for them to buy these sets than to go to movies and restaurants.
  • #12 Each generation or cohort is profoundly influenced by the times in which it grows up—the music, movies, politics, and defining events of that period. Members share the same major cultural, political, and economic experiences and have similar outlooks and values. Marketers often advertise to a cohort by using the icons and images prominent in its experiences. Millennials are also known as the Echo Boomers, these consumers have been “wired” almost from birth— playing computer games, navigating the Web, downloading music, connecting with friends via instant messaging and mobile phones. They have a sense of entitlement and abundance from growing up during the economic boom and being pampered by their boomer parents. Yet they are highly socially conscious and concerned about environmental issues. They are selective, confident, and impatient. Gen Xers feel self-sufficiency and the ability to handle any circumstance are key. Technology is an enabler for them, not a barrier. Unlike the more optimistic, team oriented Gen Yers, Gen Xers are more pragmatic and individualistic. With many baby boomers moving into their 60s and even the last and youngest wave bearing down on 50, demand has exploded for products to turn back the hands of time. According to one survey, nearly one in five boomers was actively resisting the aging process, driven by the mantra, “Fifty is the new thirty.”
  • #14 Multicultural marketing is an approach recognizing that different ethnic and cultural segments have sufficiently different needs and wants to require targeted marketing activities, and that a mass market approach is not refined enough for the diversity of the marketplace. The Hispanic American, African American, and Asian American markets are all growing at two to three times the rate of nonmulticultural populations, with numerous submarkets, and their buying power is expanding. Multicultural markets also vary in whether they are first and second (or more) generation, and whether they are immigrants or born and raised in the United States. The norms, language nuances, buying habits, and business practices of multicultural markets need to be factored into the initial formulation of a marketing strategy, rather than added as an afterthought. State Farm decided to make its Hispanic American marketing a priority in 2008. The firm sponsored local Latino community events, soccer matches, the Latin Music Awards, and Univision’s highly rated Saturday night variety show, Sabádo Gigante. Perhaps State Farm’s most original marketing activity, however, was the support and sponsorship of a new band. Los Felinos de la Noche (The Felines of the Night), as the six men (primarily Hispanic immigrants) are called, play the percussion heavy pop-rock sound of Norteño or Northern Mexico regional music. With State Farm’s support, the band recorded singles, shot music videos, and played live concerts to make a name for themselves.
  • #16 Psychographics is the science of using psychology and demographics to better understand consumers. In psychographic segmentation, buyers are divided into different groups on the basis of psychological/personality traits, lifestyle, or values. People within the same demographic group can exhibit very different psychographic profiles. One of the most popular commercially available classification systems based on psychographic measurements is Strategic Business Insight’s (SBI) VALS™ framework. VALS, signifying values and lifestyles, classifies U.S. adults into eight primary groups 1. Innovators—Successful, sophisticated, active, “take-charge” people with high self-esteem. 2. Thinkers—Mature, satisfied, and reflective people motivated by ideals and who value order, knowledge, and responsibility. They seek durability, functionality, and value in products. 3. Achievers—Successful, goal-oriented people who focus on career and family. They favor premium products that demonstrate success to their peers. 4. Experiencers—Young, enthusiastic, impulsive people who seek variety and excitement. They spend a comparatively high proportion of income on fashion, entertainment, and socializing. 5. Believers—Conservative, conventional, and traditional people with concrete beliefs. They prefer familiar, U.S.-made products and are loyal to established brands. 6. Strivers—Trendy and fun-loving people who are resource-constrained. They favor stylish products that emulate the purchases of those with greater material wealth. 7. Makers—Practical, down-to-earth, self-sufficient people who like to work with their hands. They seek U.S.-made products with a practical or functional purpose. 8. Survivors—Elderly, passive people concerned about change and loyal to their favorite brands
  • #20 Needs-based or benefit-based segmentation is a widely used approach because it identifies distinct market segments with clear marketing implications. Constellation Wines identified six different benefit segments in the U.S. premium wine market ($5.50 a bottle and up). • Enthusiast (12 percent of the market). Skewing female, their average income is about $76,000 a year. About 3 percent are “luxury enthusiasts” who skew more male with a higher income. • Image Seekers (20 percent). The only segment that skews male, with an average age of 35. They use wine basically as a badge to say who they are, and they’re willing to pay more to make sure they’re getting the right bottle. • Savvy Shoppers (15 percent). They love to shop and believe they don’t have to spend a lot to get a good bottle of wine. Happy to use the bargain bin. • Traditionalist (16 percent). With very traditional values, they like to buy brands they’ve heard of and from wineries that have been around a long time. Their average age is 50 and they are 68 percent female. • Satisfied Sippers (14 percent). Not knowing much about wine, they tend to buy the same brands. About half of what they drink is white zinfandel. • Overwhelmed (23 percent). A potentially attractive target market, they find purchasing wine confusing.
  • #21 People play five roles in a buying decision: Initiator, Influencer, Decider, Buyer, and User. For example, assume a wife initiates a purchase by requesting a new treadmill for her birthday. The husband may then seek information from many sources, including his best friend who has a treadmill and is a key influencer in what models to consider. After presenting the alternative choices to his wife, he purchases her preferred model, which ends up being used by the entire family.
  • #22 Many marketers believe variables related to various aspects of users or their are good starting points for constructing market segments. Occasions mark a time of day, week, month, year, or other well-defined temporal aspects of a consumer’s life. We can distinguish buyers according to the occasions when they develop a need, purchase a product, or use a product. Every product has its nonusers, ex-users, potential users, first-time users, and regular users. We can segment markets into light, medium, and heavy product users. Heavy users are often a small slice but account for a high percentage of total consumption. Some people are unaware of the product, some are aware, some are informed, some are interested, some desire the product, and some intend to buy. Marketers usually envision four groups based on brand loyalty status. Five consumer attitudes about products are: enthusiastic, positive, indifferent, negative, and hostile.
  • #23 To help characterize how many people are at different stages and how well they have converted people from one stage to another, marketers can employ a marketing funnel to break down the market into different buyer-readiness stages. The proportions of consumers at different stages make a big difference in designing the marketing program.
  • #24 Loyalty Status Marketers usually envision four groups based on brand loyalty status: 1. Hard-core loyals—Consumers who buy only one brand all the time 2. Split loyals—Consumers who are loyal to two or three brands 3. Shifting loyals—Consumers who shift loyalty from one brand to another 4. Switchers—Consumers who show no loyalty to any brand A company can learn a great deal by analyzing degrees of brand loyalty: Hard-core loyals can help identify the products’ strengths; split loyals can show the firm which brands are most competitive with its own; and by looking at customers dropping its brand, the company can learn about its marketing weaknesses and attempt to correct them. One caution: What appear to be brand-loyal purchase patterns may reflect habit, indifference, a low price, a high switching cost, or the unavailability of other brands. People tend to be loyal to their favorite soda brand but less so to airline brands.
  • #25 Combining different behavioral bases can provide a more comprehensive and cohesive view of a market and its segments. Figure 8.3 depicts one possible way to break down a target market by various behavioral segmentation bases.
  • #26 We can segment business markets with some of the same variables we use in consumer markets, such as geography, benefits sought, and usage rate, but business marketers also use other variables. Table 8.5 shows one set of these. The demographic variables are the most important, followed by the operating variables—down to the personal characteristics of the buyer. The table lists major questions that business marketers should ask in determining which segments and customers to serve.
  • #27 To be useful, market segments must rate favorably on five key criteria: The size, purchasing power, and characteristics of the segments can be measured. The segments are large and profitable enough to serve. A segment should be the largest possible homogeneous group worth going after with a tailored marketing program. The segments can be effectively reached and served. The segments are conceptually distinguishable and respond differently to different marketing-mix elements and programs. If married and unmarried women respond similarly to a sale on perfume, they do not constitute separate segments. Effective programs can be formulated for attracting and serving the segments.
  • #28 There are many statistical techniques for developing market segments.53 Once the firm has identified its market-segment opportunities, it must decide how many and which ones to target. Marketers are increasingly combining several variables in an effort to identify smaller, better-defined target groups. Thus, a bank may not only identify a group of wealthy retired adults but within that group distinguish several segments depending on current income, assets, savings, and risk preferences. This has led some market researchers to advocate a needs-based market segmentation approach, as introduced previously. Roger Best proposed the seven-step approach shown in Table 8.6.
  • #29 Five forces determine the intrinsic long-run attractiveness of a market or market segment: industry competitors, potential entrants, substitutes, buyers, and suppliers. The threats these forces pose are as follows: 1. Threat of intense segment rivalry—A segment is unattractive if it already contains numerous, strong, or aggressive competitors. 2. Threat of new entrants—The most attractive segment is one in which entry barriers are high and exit barriers are low. 3. Threat of substitute products—A segment is unattractive when there are actual or potential substitutes for the product. 4. Threat of buyers’ growing bargaining power—A segment is unattractive if buyers possess strong or growing bargaining power. 5. Threat of suppliers’ growing bargaining power—A segment is unattractive if the company’s suppliers are able to raise prices or reduce quantity supplied.
  • #30 Marketers have a range or continuum of possible levels of segmentation that can guide their target market decisions. As Figure 8.4 shows, at one end is a mass market of essentially one segment; at the other are individuals or segments of one person. Between lie multiple segments and single segments. We describe each of the four approaches next. With full market coverage, a firm attempts to serve all customer groups with all the products they might need. With selective specialization, a firm selects a subset of all the possible segments, each objectively attractive and appropriate. With single-segment concentration, the firm markets to only one particular segment. The ultimate level of segmentation leads to “segments of one,” “customized marketing,” or “one-to-one marketing.
  • #31 In this chapter we have reviewed answers to these questions.