Recommended
PPT
Identifying market segments & targets
PPT
PPTX
Marketing Fundamentals Part 2 Target Market & Segmentation
PDF
ch 08 market segmentation.pdf business related
PPT
PPTX
PDF
Neha Kumari Jatav BBA 2nd Year
PDF
Ch 08 identifying market segments and targets
PDF
PPT
PPT
BBCT1013Marketing Chapter 6-Segmentation, Targeting and Positioning.ppt
PPT
PPT
Marketing management Chapter 3: Market segmentation, targeting, Positioning
PPT
PPT
PPTX
Chapter 5 Marketing Management
PPTX
Kotler framework 5e_07_sppt
PPTX
Marketing management 5.pptx
PPT
MF Strategic Marketing Market segmentation, target market and positioning
PPT
PPTX
PPT
Market Segmentation in Consumer Behavior
PPTX
Marketing segment, target
PDF
Unit 2 Market Segmentation, Targeting, Differentiation & Positioning.pdf
PPT
Marketing Managment Kotler mm14 ch07_dppt
PDF
PPTX
PDF
Vaibhav Khurana BBA-1st Year
PPTX
Keynote: The Modern CMO: Architect of Growth. Guardian of Credibility.
PDF
How To Buy Verified Cash App Accounts - Secure Your Transactions.pdf
More Related Content
PPT
Identifying market segments & targets
PPT
PPTX
Marketing Fundamentals Part 2 Target Market & Segmentation
PDF
ch 08 market segmentation.pdf business related
PPT
PPTX
PDF
Neha Kumari Jatav BBA 2nd Year
PDF
Ch 08 identifying market segments and targets
Similar to Chapter- Five (Identifying Market Segments)
PDF
PPT
PPT
BBCT1013Marketing Chapter 6-Segmentation, Targeting and Positioning.ppt
PPT
PPT
Marketing management Chapter 3: Market segmentation, targeting, Positioning
PPT
PPT
PPTX
Chapter 5 Marketing Management
PPTX
Kotler framework 5e_07_sppt
PPTX
Marketing management 5.pptx
PPT
MF Strategic Marketing Market segmentation, target market and positioning
PPT
PPTX
PPT
Market Segmentation in Consumer Behavior
PPTX
Marketing segment, target
PDF
Unit 2 Market Segmentation, Targeting, Differentiation & Positioning.pdf
PPT
Marketing Managment Kotler mm14 ch07_dppt
PDF
PPTX
PDF
Vaibhav Khurana BBA-1st Year
Recently uploaded
PPTX
Keynote: The Modern CMO: Architect of Growth. Guardian of Credibility.
PDF
How To Buy Verified Cash App Accounts - Secure Your Transactions.pdf
PDF
_Top 7 Mistakes to Avoid When Buying Google Ads Accounts.pdf
PDF
_Top 7 Tips for Buying Verified PayPal Accounts.pdf
PDF
_5 Trusted Strategies to Buy Verified Wise Accounts Safely & Legally.pdf
PPTX
Explore Hubspot’s Customer Agent for B2B
DOCX
_18 Buying USA LinkedIn Accounts Can Boost Your Social.docx
PDF
How to Buy Twitter Accounts_ A Step-by-Step Guide (2).pdf
DOCX
How to Buy Verified OnlyFans Accounts Work in 2026.docx
DOCX
Buy Verified PayPal Accounts for Secure Online Use docx
PDF
Top 5 Trusted Websites to Buy Verified PayPal Accounts Safely in 2026
PDF
17 Guide to Buying Verified Binance Accounts in the US.pdf
DOCX
Buy Verified PayPal Account Online_ A Comprehensive ....docx
PDF
A Comprehensive Guide to Buy Verified PayPal Accounts in the US.pdf
PDF
Best 9 Sites to Buy Hotmail Accounts (Aged & PVA).pdf
PDF
Equinox Gold - January Investor Presentation.pdf
PDF
Equinox Gold - Corporate Presentation - Jan 2026
PDF
OIL CHECK 500 Portable - Air Quality Monitoring System
PDF
Kirill Klip GEM Royalty TNR Gold Lithium Presentation
PPTX
Exterior Front Entry Door Design Trends, 2025–2026
Chapter- Five (Identifying Market Segments) 1. Copyright © 2003 Prentice-Hall, Inc.
3-1
Chapter 5
Identifying Market Segments and
Targets
2. Copyright © 2003 Prentice-Hall, Inc.
10-2
Chapter Objectives
The following topics will be covered in this chapter:
Bases for Segmenting Consumer Markets
- Geographic Segmentation
- Demographic Segmentation
- Psychographic Segmentation
- Behavioral Segmentation
Bases for Segmenting Business Markets
Market Targeting
3. Copyright © 2003 Prentice-Hall, Inc.
10-3
Market Segmentation
Target marketing requires marketers to take three
major steps:
Identify and profile distinct groups of buyers who differ
in their needs and preferences (market segmentation).
Select one or more market segments to enter (market
targeting).
For each target segment, establish and communicate the
key distinctive benefit(s) of the company’s market
offering (market positioning).
4. Copyright © 2003 Prentice-Hall, Inc.
10-4
Bases for Segmenting Consumer
Markets
Bases for Segmenting Consumer Markets
Geographic Segmentation
Demographic Segmentation
Psychographic Segmentation
Behavioral Segmentation
5. Copyright © 2003 Prentice-Hall, Inc.
10-5
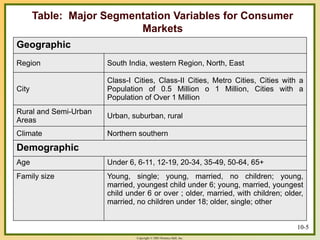
Table: Major Segmentation Variables for Consumer
Markets
Geographic
Region South India, western Region, North, East
City
Class-I Cities, Class-II Cities, Metro Cities, Cities with a
Population of 0.5 Million o 1 Million, Cities with a
Population of Over 1 Million
Rural and Semi-Urban
Areas
Urban, suburban, rural
Climate Northern southern
Demographic
Age Under 6, 6-11, 12-19, 20-34, 35-49, 50-64, 65+
Family size Young, single; young, married, no children; young,
married, youngest child under 6; young, married, youngest
child under 6 or over ; older, married, with children; older,
married, no children under 18; older, single; other
10-5
6. Copyright © 2003 Prentice-Hall, Inc.
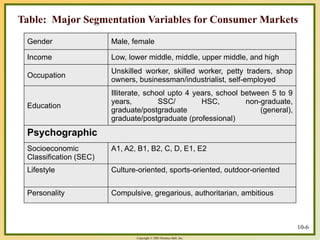
Table: Major Segmentation Variables for Consumer Markets
Gender Male, female
Income Low, lower middle, middle, upper middle, and high
Occupation
Unskilled worker, skilled worker, petty traders, shop
owners, businessman/industrialist, self-employed
Education
Illiterate, school upto 4 years, school between 5 to 9
years, SSC/ HSC, non-graduate,
graduate/postgraduate (general),
graduate/postgraduate (professional)
Psychographic
Socioeconomic
Classification (SEC)
A1, A2, B1, B2, C, D, E1, E2
Lifestyle Culture-oriented, sports-oriented, outdoor-oriented
Personality Compulsive, gregarious, authoritarian, ambitious
10-6
7. Copyright © 2003 Prentice-Hall, Inc.
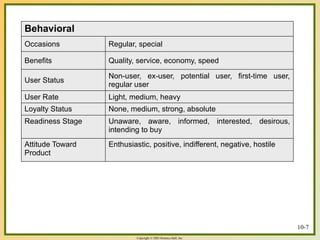
Behavioral
Occasions Regular, special
Benefits Quality, service, economy, speed
User Status
Non-user, ex-user, potential user, first-time user,
regular user
User Rate Light, medium, heavy
Loyalty Status None, medium, strong, absolute
Readiness Stage Unaware, aware, informed, interested, desirous,
intending to buy
Attitude Toward
Product
Enthusiastic, positive, indifferent, negative, hostile
10-7
8. Copyright © 2003 Prentice-Hall, Inc.
10-8
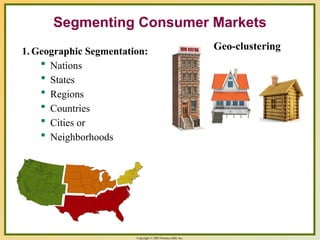
Segmenting Consumer Markets
1. Geographic Segmentation:
Nations
States
Regions
Countries
Cities or
Neighborhoods
Geo-clustering
9. Copyright © 2003 Prentice-Hall, Inc.
10-9
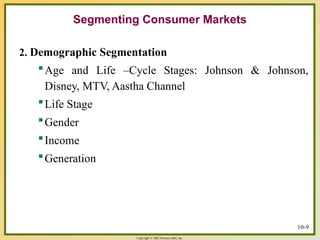
Segmenting Consumer Markets
2. Demographic Segmentation
Age and Life –Cycle Stages: Johnson & Johnson,
Disney, MTV, Aastha Channel
Life Stage
Gender
Income
Generation
10. 11. 12. Copyright © 2003 Prentice-Hall, Inc.
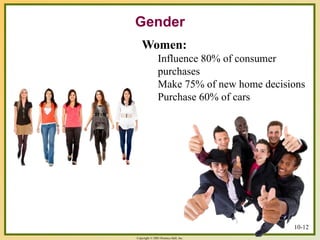
Gender
Women:
Influence 80% of consumer
purchases
Make 75% of new home decisions
Purchase 60% of cars
10-12
13. 14. Copyright © 2003 Prentice-Hall, Inc.
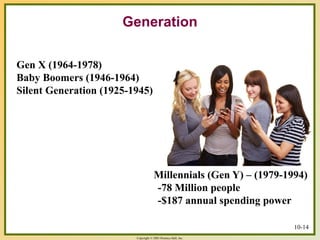
Generation
Gen X (1964-1978)
Baby Boomers (1946-1964)
Silent Generation (1925-1945)
Millennials (Gen Y) – (1979-1994)
-78 Million people
-$187 annual spending power
10-14
15. Copyright © 2003 Prentice-Hall, Inc.
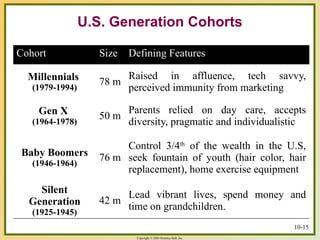
Cohort Size Defining Features
Millennials
(1979-1994)
78 m
Raised in affluence, tech savvy,
perceived immunity from marketing
Gen X
(1964-1978)
50 m
Parents relied on day care, accepts
diversity, pragmatic and individualistic
Baby Boomers
(1946-1964)
76 m
Control 3/4th
of the wealth in the U.S,
seek fountain of youth (hair color, hair
replacement), home exercise equipment
Silent
Generation
(1925-1945)
42 m
Lead vibrant lives, spend money and
time on grandchildren.
U.S. Generation Cohorts
10-15
16. 17. Copyright © 2003 Prentice-Hall, Inc.
10-17
Segmenting Consumer Markets
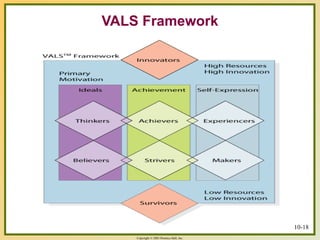
3. Psychographic Segmentation:
- Personality traits
- Lifestyle
- Values
- One of the most popular commercially available classification
systems based on psychographic measurements is-the SRI
Consulting Business Intelligence’s (SRIC-BI) VALS
Framework.
- The main dimensions are- Consumer Motivation (Horizontal
Dimension) and Consumer Resources (Vertical Dimension)
18. 19. Copyright © 2003 Prentice-Hall, Inc.
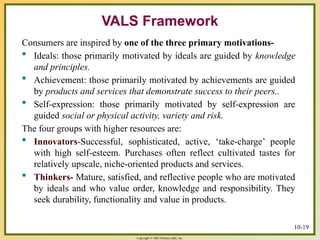
Consumers are inspired by one of the three primary motivations-
Ideals: those primarily motivated by ideals are guided by knowledge
and principles.
Achievement: those primarily motivated by achievements are guided
by products and services that demonstrate success to their peers..
Self-expression: those primarily motivated by self-expression are
guided social or physical activity, variety and risk.
The four groups with higher resources are:
Innovators-Successful, sophisticated, active, ‘take-charge’ people
with high self-esteem. Purchases often reflect cultivated tastes for
relatively upscale, niche-oriented products and services.
Thinkers- Mature, satisfied, and reflective people who are motivated
by ideals and who value order, knowledge and responsibility. They
seek durability, functionality and value in products.
VALS Framework
10-19
20. Copyright © 2003 Prentice-Hall, Inc.
10-20
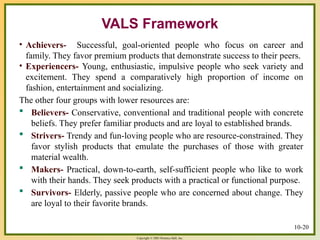
• Achievers- Successful, goal-oriented people who focus on career and
family. They favor premium products that demonstrate success to their peers.
• Experiencers- Young, enthusiastic, impulsive people who seek variety and
excitement. They spend a comparatively high proportion of income on
fashion, entertainment and socializing.
The other four groups with lower resources are:
Believers- Conservative, conventional and traditional people with concrete
beliefs. They prefer familiar products and are loyal to established brands.
Strivers- Trendy and fun-loving people who are resource-constrained. They
favor stylish products that emulate the purchases of those with greater
material wealth.
Makers- Practical, down-to-earth, self-sufficient people who like to work
with their hands. They seek products with a practical or functional purpose.
Survivors- Elderly, passive people who are concerned about change. They
are loyal to their favorite brands.
VALS Framework
21. Copyright © 2003 Prentice-Hall, Inc.
10-21
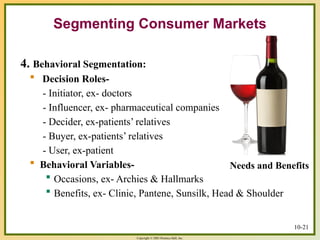
Segmenting Consumer Markets
4. Behavioral Segmentation:
Decision Roles-
- Initiator, ex- doctors
- Influencer, ex- pharmaceutical companies
- Decider, ex-patients’ relatives
- Buyer, ex-patients’ relatives
- User, ex-patient
Behavioral Variables-
Occasions, ex- Archies & Hallmarks
Benefits, ex- Clinic, Pantene, Sunsilk, Head & Shoulder
Needs and Benefits
22. Copyright © 2003 Prentice-Hall, Inc.
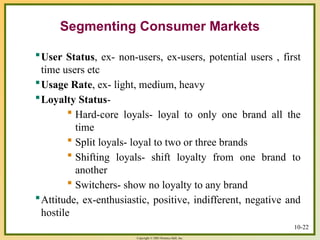
10-22
User Status, ex- non-users, ex-users, potential users , first
time users etc
Usage Rate, ex- light, medium, heavy
Loyalty Status-
Hard-core loyals- loyal to only one brand all the
time
Split loyals- loyal to two or three brands
Shifting loyals- shift loyalty from one brand to
another
Switchers- show no loyalty to any brand
Attitude, ex-enthusiastic, positive, indifferent, negative and
hostile
Segmenting Consumer Markets
23. 24. Copyright © 2003 Prentice-Hall, Inc.
10-24
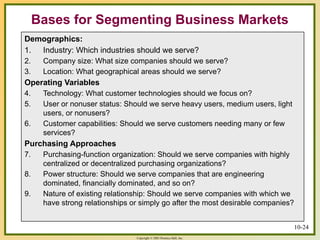
Bases for Segmenting Business Markets
Demographics:
1. Industry: Which industries should we serve?
2. Company size: What size companies should we serve?
3. Location: What geographical areas should we serve?
Operating Variables
4. Technology: What customer technologies should we focus on?
5. User or nonuser status: Should we serve heavy users, medium users, light
users, or nonusers?
6. Customer capabilities: Should we serve customers needing many or few
services?
Purchasing Approaches
7. Purchasing-function organization: Should we serve companies with highly
centralized or decentralized purchasing organizations?
8. Power structure: Should we serve companies that are engineering
dominated, financially dominated, and so on?
9. Nature of existing relationship: Should we serve companies with which we
have strong relationships or simply go after the most desirable companies?
25. Copyright © 2003 Prentice-Hall, Inc.
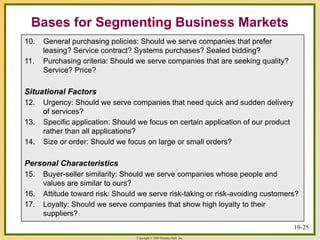
10-25
Bases for Segmenting Business Markets
10. General purchasing policies: Should we serve companies that prefer
leasing? Service contract? Systems purchases? Sealed bidding?
11. Purchasing criteria: Should we serve companies that are seeking quality?
Service? Price?
Situational Factors
12. Urgency: Should we serve companies that need quick and sudden delivery
of services?
13. Specific application: Should we focus on certain application of our product
rather than all applications?
14. Size or order: Should we focus on large or small orders?
Personal Characteristics
15. Buyer-seller similarity: Should we serve companies whose people and
values are similar to ours?
16. Attitude toward risk: Should we serve risk-taking or risk-avoiding customers?
17. Loyalty: Should we serve companies that show high loyalty to their
suppliers?
26. Copyright © 2003 Prentice-Hall, Inc.
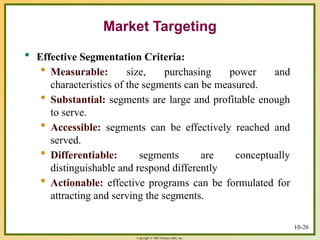
Market Targeting
Effective Segmentation Criteria:
Measurable: size, purchasing power and
characteristics of the segments can be measured.
Substantial: segments are large and profitable enough
to serve.
Accessible: segments can be effectively reached and
served.
Differentiable: segments are conceptually
distinguishable and respond differently
Actionable: effective programs can be formulated for
attracting and serving the segments.
10-26
27. Copyright © 2003 Prentice-Hall, Inc.
10-27
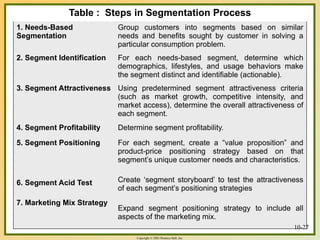
Table : Steps in Segmentation Process
1. Needs-Based
Segmentation
Group customers into segments based on similar
needs and benefits sought by customer in solving a
particular consumption problem.
2. Segment Identification For each needs-based segment, determine which
demographics, lifestyles, and usage behaviors make
the segment distinct and identifiable (actionable).
3. Segment Attractiveness Using predetermined segment attractiveness criteria
(such as market growth, competitive intensity, and
market access), determine the overall attractiveness of
each segment.
4. Segment Profitability Determine segment profitability.
5. Segment Positioning
6. Segment Acid Test
7. Marketing Mix Strategy
For each segment, create a “value proposition” and
product-price positioning strategy based on that
segment’s unique customer needs and characteristics.
Create ‘segment storyboard’ to test the attractiveness
of each segment’s positioning strategies
Expand segment positioning strategy to include all
aspects of the marketing mix.
10-27
28. Copyright © 2003 Prentice-Hall, Inc.
10-28
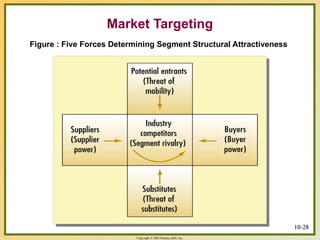
Market Targeting
Figure : Five Forces Determining Segment Structural Attractiveness
10-28
29. Copyright © 2003 Prentice-Hall, Inc.
10-29
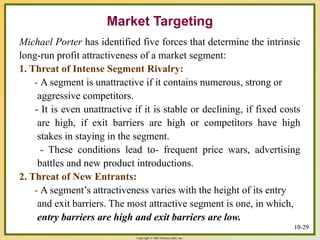
Market Targeting
Michael Porter has identified five forces that determine the intrinsic
long-run profit attractiveness of a market segment:
1. Threat of Intense Segment Rivalry:
- A segment is unattractive if it contains numerous, strong or
aggressive competitors.
- It is even unattractive if it is stable or declining, if fixed costs
are high, if exit barriers are high or competitors have high
stakes in staying in the segment.
- These conditions lead to- frequent price wars, advertising
battles and new product introductions.
2. Threat of New Entrants:
- A segment’s attractiveness varies with the height of its entry
and exit barriers. The most attractive segment is one, in which,
entry barriers are high and exit barriers are low.
10-29
30. Copyright © 2003 Prentice-Hall, Inc.
10-30
Market Targeting
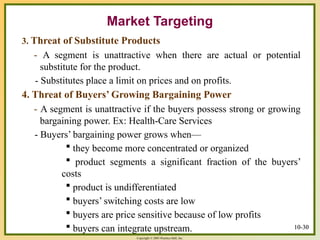
3. Threat of Substitute Products
- A segment is unattractive when there are actual or potential
substitute for the product.
- Substitutes place a limit on prices and on profits.
4. Threat of Buyers’ Growing Bargaining Power
- A segment is unattractive if the buyers possess strong or growing
bargaining power. Ex: Health-Care Services
- Buyers’ bargaining power grows when—
they become more concentrated or organized
product segments a significant fraction of the buyers’
costs
product is undifferentiated
buyers’ switching costs are low
buyers are price sensitive because of low profits
buyers can integrate upstream. 10-30
31. Copyright © 2003 Prentice-Hall, Inc.
10-31
Market Targeting
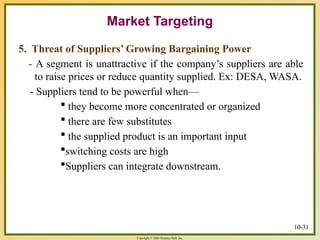
5. Threat of Suppliers’ Growing Bargaining Power
- A segment is unattractive if the company’s suppliers are able
to raise prices or reduce quantity supplied. Ex: DESA, WASA.
- Suppliers tend to be powerful when—
they become more concentrated or organized
there are few substitutes
the supplied product is an important input
switching costs are high
Suppliers can integrate downstream.
10-31
32. Copyright © 2003 Prentice-Hall, Inc.
10-32
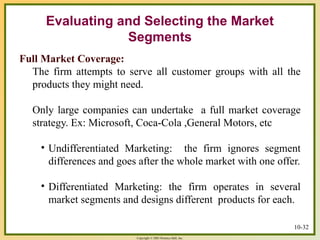
Full Market Coverage:
The firm attempts to serve all customer groups with all the
products they might need.
Only large companies can undertake a full market coverage
strategy. Ex: Microsoft, Coca-Cola ,General Motors, etc
• Undifferentiated Marketing: the firm ignores segment
differences and goes after the whole market with one offer.
• Differentiated Marketing: the firm operates in several
market segments and designs different products for each.
Evaluating and Selecting the Market
Segments
33. Copyright © 2003 Prentice-Hall, Inc.
Evaluating and Selecting the
Market Segments
34. Copyright © 2003 Prentice-Hall, Inc.
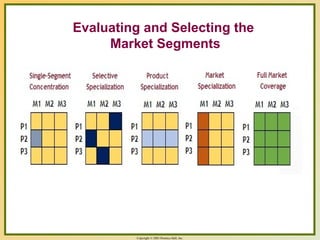
10-34
Single-Segment Concentration
A firm selects and serves only one segment. Ex- Maternity
Hospitals & Clinics
Selective Specialization/ Multiple Segment Specialization
A firm selects a number of segments, each objectively
attractive and appropriate. Ex- P&G’s Crest Toothpaste
Market Specialization
Here the company takes up a particular market segment for
supplying all relevant products to the target group. For
example, the company X can implement Market
Specialisation strategy by producing all sorts of home
appliances like TV, washing machine, refrigerator and micro
oven for middle class people.
Evaluating and Selecting the Market
Segments
35. Copyright © 2003 Prentice-Hall, Inc.
10-35
Product Specialization
When a company sells certain products to several different
types of potential customers. Ex- Microscope producers for
university, government and commercial laboratories.
Evaluating and Selecting the Market
Segments
36. Copyright © 2003 Prentice-Hall, Inc.
Ethical Choice of Market Targets
- Marketers must target segments carefully to avoid
consumer backlash
- Singles and elderly people may not want to be
identified as singles or olds.
10-36
Market Targeting
37. Editor's Notes #10 Wants and abilities change with age. Companies such as Crest and Colgate offer products that target kids, adults and older consumers. #11 Life stage defines a person’s major concern, such as going through a divorce, going into a second marriage, taking care of an older parent, deciding to cohabit with another person, deciding to buy a new home, and so on. These life stages present opportunities for marketers who can help people cope with their major concerns.. #12 Men and women have different attitudes and behaviors due in part to genetics and socialization. Women are more communal-minded, men more self-expressive and goal directed. A recent study found that men need to be invited to touch a product, whereas women are more likely to pick up without prompting. #13 Income segmentation is used in categories such as clothing, travel, financial services, and automobiles. Income does not always predict the best customers – blue collar workers were among the first adopters of color TVs as it offered entertainment at a lower cost than going to movies or restaurants.
Increasingly, companies are finding their markets are hourglass shaped as middle-market U.S. consumers migrate toward both discount and premium products. #14 Each generation or cohort is profoundly influenced by the times in which it grows up—the music, movies, politics, and defining events of that period. Members share the same major cultural, political, and economic experiences and have similar outlooks and values. Marketers often advertise to a cohort by using the icons and images prominent in its experiences. They also try to develop products and services that uniquely meet the particular interests or needs of a generational target. #16 Multicultural marketing is an approach recognizing that different ethnic and cultural segments have sufficiently different needs and wants to require targeted marketing activities, and that a mass market approach is not refined enough for the diversity of the marketplace. Multicultural marketing can result in different marketing messages, media, channels, and so on.
Hispanic Americans are the largest minority group in America and have an annual purchasing power estimated to exceed $1 trillion. By 2020, 17% of Americans are projected to be of Hispanic origin.
African Americans have had a significant economic, social, and cultural impact on the U.S. life. African Americans are the most fashion-conscious of all racial and ethnic groups, but strongly motivated by quality and selection. Children have a strong influence on product selection.
The Asian American market has been called the “invisible market” because, compared to Hispanic Americans and African Americans, it has traditionally received a relatively small portion of multicultural marketing dollars.
The next slide contains Table 8.4 that offers a profile of these three markets.