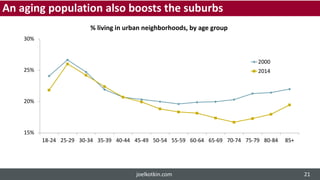
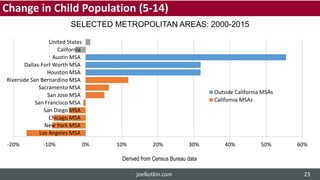
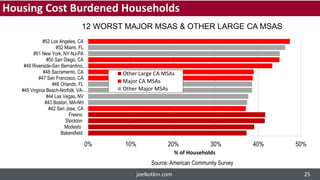
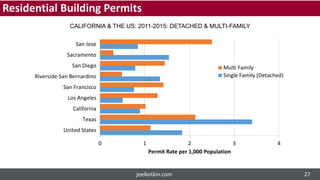
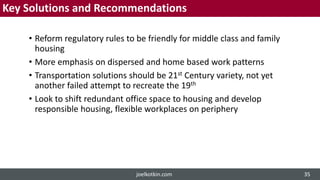
HOUSING THE FUTURE
June 15, 2017
Described by the New York Times as “America’s
uber-geographer,” Joel Kotkin is an internationally-
recognized authority on global, economic, political
and social trends. His newest book, The Human
City: Urbanism for the Rest of Us, was published by
Agate in April, 2016.
Mr. Kotkin is the Presidential Fellow in Urban
Futures at Chapman University in Orange,
California and Executive Director of the Houston-
based Center for Opportunity Urbanism
(opportunityurbanism.org).
He is Executive Editor of the widely read website
www.newgeography.com and writes the weekly
“New Geographer” column for Forbes.com. He
serves on the editorial board of the Orange County
Register and writes a weekly column for that paper,
and is a regular contributor to the Daily Beast and
Real Clear Politics.
SPONSORED BY
joelkotkin.com
In partnership with National Community Renaissance, the
Inland Valleys Association of Realtors® hosted a luncheon
with special guest speaker and author Joel Kotkin. This
invitation only, luncheon focused on critical housing
issues impacting California and the Inland Empire.
When: Thursday, June 15, 2017, 11:30am – 1:30pm
Where: The Mission Inn – Galleria Room, 3649 Mission
Inn Avenue, Riverside, CA 92501
FEATURING: JOEL KOTKIN
California’s Fading Dream: Losing Track of the Purpose of Cities
Presentation by Joel Kotkin, Presidential Fellow in Urban
Futures, Chapman University and Executive Director,
Center for Opportunity
IVAR & National CORE Event
June 15, 2017 -- Riverside, CA
joelkotkin.com 2
What is a City for?
“a city comes into being for the sake of life, but exists for
the sake of living well.” ---Aristotle
joelkotkin.com 3
0
20
40
60
80
100
120
Medieval Town Pre-Industrial - Early
19th Century
Industrial - Mid 19th
Century
Industrial cities boosted crowding dramatically
Urban Land Use 1400-1850 Square meters/Person
joelkotkin.com 4
The British Alternative:
“Town and country must be married and out of
this joyous union will spring a new hope, a
new life, a new civilization.”
Ebenezer Howard
The Garden City
joelkotkin.com 5
0
20,000
40,000
60,000
80,000
100,000
120,000
1800
1850
1900
1950
2000
2010
PopulationperSquareMile(Urban)
New York
Los Angeles
PARIS, LONDON, NEW YORK & LOS ANGELES
Estimated from statistical agency sources and historic maps.
Paris
London
Built-Up Urban Area Densities: 1800-2010
joelkotkin.com 6
The US Experience: More Dispersion, More Denial by Planners,
Pundits and some developers
“We’ve reached the limits of suburban
development .People are beginning to
vote with their feet and come back to
the central cities.”
HUD Secretary Shaun Donovan Feb
2011
joelkotkin.com 7
Urban Core:
CBD
0.8%
Urban Core:
Inner Ring…
Earlier Suburbs
29.5%
Later Suburbs
45.8%
Exurbs
14.5%
52 MAJOR METROPOLITAN AREAS (2010 to 2011-2015)
Growth Share by City Sector: Early 2010s
Derived from 2010 Census, American Community Survey 2011-2015 & City Sector Model
joelkotkin.com 8
Suburbs Dominate Job Growth
joelkotkin.com 9
PRESENT RESIDENCE AND PREFERRED IN 5 YEARS
Source: http://www.bain.com/Images/BAIN_REPORT_Spatial_economics.pdf
Living Preferences: Today and in 5 Years
joelkotkin.com 10
18,600
-64,600
-402,300
586,600
359,300
-600,000
-400,000
-200,000
0
200,000
400,000
600,000
800,000
Urban Core: CBD Urban Core: Inner
Ring
Earlier Suburb Later Suburb Exurb
EmploymentGrowth
Derived from County Business Patterns data & City Sector Model
6 MAJOR CALIFORNIA MSA’S
Database excludes most
government employment
Employment Growth by Sector: 2000-2014
joelkotkin.com 11
US Population by Age: 2013
joelkotkin.com 12
0%
10%
20%
30%
40%
50%
60%
Silent Generation Baby Boomer Generation Generation X Millenial Generation
SHARE OF NATIONAL HOUSEHOLD WEALTH
Derived from Deloitte Center for Financial Services
Wealth by Generation: 2015-2030
joelkotkin.com 13
1980 – 2014
Share of 18-34 Year Olds Living with Parents
joelkotkin.com 14
0
20,000
40,000
60,000
80,000
100,000
120,000
Los Angeles Orange Riverside San Bernardino Ventura
LA-RIVERSIDE CSA COUNTIES
US Census Bureau & 2010-2014 American Community Survey data
Change in 20-29 Population: 2000-2014
joelkotkin.com 15
1,100
7,800
87,800
15,200
26,100
0
10,000
20,000
30,000
40,000
50,000
60,000
70,000
80,000
90,000
100,000
Urban Core:
CBD
Urban Core:
Inner Ring
Earlier Suburb Later Suburb Exurb
PopulationGrowth
Derived from Census Bureau data & City Sector Model 2015 Revision
LOS ANGELES LONG BEACH CSA: 2010-2013
25-34 Growth by Sector
joelkotkin.com 16
0% 10% 20% 30% 40% 50%
Country
Small City
Suburb
Big City
Country
Small City
Suburb
Big City
Millenials
Older Generations
Source: Frank N. Magid Associates
COMPARED TO OLDER GENERATIONS
Current
Residence
IdealPlace
toLive
Millennial Life Style Choices
joelkotkin.com 17
84
81
80
86
89
74
76
78
80
82
84
86
88
90
Total population
Millennials
Gen X
Boomers
Silent Gen
Source: Merrill Lynch – Age Wave, 2014Base Age 21+
AGREEING THAT HOME OWNERSHIP AN IMPORTANT PART
Survey: American Dream
joelkotkin.com 18
BY GENERATION: 2011
Expecting to Marry & Have Kids
joelkotkin.com 19
Projected national number of 20-27 and 28-35 population cohorts, 2014 to 2060
34
35
36
37
38
39
40
41
42
2014
2016
2018
2020
2022
2024
2026
2028
2030
2032
2034
2036
2038
2040
2042
2044
2046
2048
2050
2052
2054
2056
2058
2060
20-27
28-35
Source: Business Insider/Andy Kiersz, data from US Census Bureau
joelkotkin.com 20
% living in urban neighborhoods, by age group
30%
25%
20%
15%
18-24 25-29 30-34 35-39 40-44 45-49 50-54 55-59 60-64 65-69 70-74 75-79 80-84 85+
2000
2014
An aging population also boosts the suburbs
joelkotkin.com 21
Detached
House
81%
Townhouse
8%
Multi-Unit
7%
Other
4%
2014-2015 NATIONAL ASSOCIATION OF REALTORS
From National Association of Realtors, 2015
House Purchases: Under Age 35
joelkotkin.com 22
-20% -10% 0% 10% 20% 30% 40% 50% 60%
Los Angeles MSA
New York MSA
Chicago MSA
San Diego MSA
San Francisco MSA
San Jose MSA
Sacramento MSA
Riverside San Bernardino MSA
Houston MSA
Dallas-Fort Worth MSA
Austin MSA
California
United States
Outside California MSAs
California MSAs
Derived from Census Bureau data
SELECTED METROPOLITAN AREAS: 2000-2015
Change in Child Population (5-14)
joelkotkin.com 23
0% 5% 10% 15% 20% 25%
Georgia
Hawaii
Mississippi
Nevada
New Mexico
Arizona
Louisiana
New York
Florida
California
UNITED STATES
Housing Cost Adjusted Poverty Rate
STATES: 2015
Census Bureau data
Highest Housing Adjusted Poverty Rates
joelkotkin.com 24
0% 10% 20% 30% 40% 50%
Bakersfield
Modesto
Stockton
Fresno
#42 San Jose, CA
#43 Boston, MA-NH
#44 Las Vegas, NV
#45 Virginia Beach-Norfolk, VA-…
#46 Orlando, FL
#47 San Francisco, CA
#48 Sacramento, CA
#49 Riverside-San Bernardino,…
#50 San Diego, CA
#51 New York, NY-NJ-PA
#52 Miami, FL
#53 Los Angeles, CA
% of Households
Other Large CA MSAs
Major CA MSAs
Other Major MSAs
Housing Cost Burdened Households
12 WORST MAJOR MSAS & OTHER LARGE CA MSAS
Source: American Community Survey
joelkotkin.com 25
Grand Delusions won’t restore Upward Mobility in California : We Need to
Change the Debate
California Policies
• Green Jobs and forced density
• High-Speed Rail and transit
• Social engineering away from families and
middle class housing and jobs
joelkotkin.com 26
0 1 2 3 4
United States
Texas
California
Los Angeles
San Francisco
Riverside-San Bernardino
San Diego
Sacramento
San Jose
Permit Rate per 1,000 Population
Multi Family
Single Family (Detached)
CALIFORNIA & THE US: 2011-2015: DETACHED & MULTI-FAMILY
Residential Building Permits
joelkotkin.com 27
0%
1%
2%
3%
4%
5%
6%
1980 1990 2000 2010 2014
MarketShare
Market Share for Indicated Years Only
Transit
Work at Home
TRANSIT & WORK AT HOME SHARE: 1980-2014
Derived Census Bureau data
Los Angeles CSA Commuting
joelkotkin.com 28
0
5
10
15
20
25
30
Core Inner Ring Second Ring Outer Ring
MetricTons
AUSTRALIA 5 LARGE CAPITAL URBAN AREAS
Housing Form in Australia and Its Impact on Greenhouse Gas Emissions
CO2 Emissions per Capita: By Sector
joelkotkin.com 29
EMISSION REDUCTION GOALS & OUT-MIGRANT INCREASE
California Air Resources Board and David Friedman
California Emissions: Comparisons
joelkotkin.com 30
0
1
2
3
4
5
6
7
8
ComparedtoDetached(5)
Construction Cost/Square Foot Compared to Detached (5 per Acre)
SAN FRANCISCO BAY AREA
Construction Cost by House Type
Derived from FBI Statistics: 2013, Major metropolitan areas (average).
joelkotkin.com 31
Future of Suburbia
• Suburbia about to gain as
minorities and millennials head
there
• Future suburbs will develop
more amenities and be more
self-sufficient
• The diverse, more interesting
suburbs are best positioned
joelkotkin.com 32
The Shift in retail will open new opportunities
joelkotkin.com 33
The Future of Retail
joelkotkin.com 34
Key Solutions and Recommendations
• Reform regulatory rules to be friendly for middle class and family
housing
• More emphasis on dispersed and home based work patterns
• Transportation solutions should be 21st Century variety, not yet
another failed attempt to recreate the 19th
• Look to shift redundant office space to housing and develop
responsible housing, flexible workplaces on periphery
joelkotkin.com 35
• After all is said and done, he --- the citizen --- is really
the city. The city is going wherever he goes. “
Frank Lloyd Wright, The Living City, (1958)
joelkotkin.com 36
Questions and Comments
joelkotkin.com 37

Kotkin - Housing the Future - 2017

  • 1.
    HOUSING THE FUTURE June15, 2017 Described by the New York Times as “America’s uber-geographer,” Joel Kotkin is an internationally- recognized authority on global, economic, political and social trends. His newest book, The Human City: Urbanism for the Rest of Us, was published by Agate in April, 2016. Mr. Kotkin is the Presidential Fellow in Urban Futures at Chapman University in Orange, California and Executive Director of the Houston- based Center for Opportunity Urbanism (opportunityurbanism.org). He is Executive Editor of the widely read website www.newgeography.com and writes the weekly “New Geographer” column for Forbes.com. He serves on the editorial board of the Orange County Register and writes a weekly column for that paper, and is a regular contributor to the Daily Beast and Real Clear Politics. SPONSORED BY joelkotkin.com In partnership with National Community Renaissance, the Inland Valleys Association of Realtors® hosted a luncheon with special guest speaker and author Joel Kotkin. This invitation only, luncheon focused on critical housing issues impacting California and the Inland Empire. When: Thursday, June 15, 2017, 11:30am – 1:30pm Where: The Mission Inn – Galleria Room, 3649 Mission Inn Avenue, Riverside, CA 92501 FEATURING: JOEL KOTKIN
  • 2.
    California’s Fading Dream:Losing Track of the Purpose of Cities Presentation by Joel Kotkin, Presidential Fellow in Urban Futures, Chapman University and Executive Director, Center for Opportunity IVAR & National CORE Event June 15, 2017 -- Riverside, CA joelkotkin.com 2
  • 3.
    What is aCity for? “a city comes into being for the sake of life, but exists for the sake of living well.” ---Aristotle joelkotkin.com 3
  • 4.
    0 20 40 60 80 100 120 Medieval Town Pre-Industrial- Early 19th Century Industrial - Mid 19th Century Industrial cities boosted crowding dramatically Urban Land Use 1400-1850 Square meters/Person joelkotkin.com 4
  • 5.
    The British Alternative: “Townand country must be married and out of this joyous union will spring a new hope, a new life, a new civilization.” Ebenezer Howard The Garden City joelkotkin.com 5
  • 6.
    0 20,000 40,000 60,000 80,000 100,000 120,000 1800 1850 1900 1950 2000 2010 PopulationperSquareMile(Urban) New York Los Angeles PARIS,LONDON, NEW YORK & LOS ANGELES Estimated from statistical agency sources and historic maps. Paris London Built-Up Urban Area Densities: 1800-2010 joelkotkin.com 6
  • 7.
    The US Experience:More Dispersion, More Denial by Planners, Pundits and some developers “We’ve reached the limits of suburban development .People are beginning to vote with their feet and come back to the central cities.” HUD Secretary Shaun Donovan Feb 2011 joelkotkin.com 7
  • 8.
    Urban Core: CBD 0.8% Urban Core: InnerRing… Earlier Suburbs 29.5% Later Suburbs 45.8% Exurbs 14.5% 52 MAJOR METROPOLITAN AREAS (2010 to 2011-2015) Growth Share by City Sector: Early 2010s Derived from 2010 Census, American Community Survey 2011-2015 & City Sector Model joelkotkin.com 8
  • 9.
    Suburbs Dominate JobGrowth joelkotkin.com 9
  • 10.
    PRESENT RESIDENCE ANDPREFERRED IN 5 YEARS Source: http://www.bain.com/Images/BAIN_REPORT_Spatial_economics.pdf Living Preferences: Today and in 5 Years joelkotkin.com 10
  • 11.
    18,600 -64,600 -402,300 586,600 359,300 -600,000 -400,000 -200,000 0 200,000 400,000 600,000 800,000 Urban Core: CBDUrban Core: Inner Ring Earlier Suburb Later Suburb Exurb EmploymentGrowth Derived from County Business Patterns data & City Sector Model 6 MAJOR CALIFORNIA MSA’S Database excludes most government employment Employment Growth by Sector: 2000-2014 joelkotkin.com 11
  • 12.
    US Population byAge: 2013 joelkotkin.com 12
  • 13.
    0% 10% 20% 30% 40% 50% 60% Silent Generation BabyBoomer Generation Generation X Millenial Generation SHARE OF NATIONAL HOUSEHOLD WEALTH Derived from Deloitte Center for Financial Services Wealth by Generation: 2015-2030 joelkotkin.com 13
  • 14.
    1980 – 2014 Shareof 18-34 Year Olds Living with Parents joelkotkin.com 14
  • 15.
    0 20,000 40,000 60,000 80,000 100,000 120,000 Los Angeles OrangeRiverside San Bernardino Ventura LA-RIVERSIDE CSA COUNTIES US Census Bureau & 2010-2014 American Community Survey data Change in 20-29 Population: 2000-2014 joelkotkin.com 15
  • 16.
    1,100 7,800 87,800 15,200 26,100 0 10,000 20,000 30,000 40,000 50,000 60,000 70,000 80,000 90,000 100,000 Urban Core: CBD Urban Core: InnerRing Earlier Suburb Later Suburb Exurb PopulationGrowth Derived from Census Bureau data & City Sector Model 2015 Revision LOS ANGELES LONG BEACH CSA: 2010-2013 25-34 Growth by Sector joelkotkin.com 16
  • 17.
    0% 10% 20%30% 40% 50% Country Small City Suburb Big City Country Small City Suburb Big City Millenials Older Generations Source: Frank N. Magid Associates COMPARED TO OLDER GENERATIONS Current Residence IdealPlace toLive Millennial Life Style Choices joelkotkin.com 17
  • 18.
    84 81 80 86 89 74 76 78 80 82 84 86 88 90 Total population Millennials Gen X Boomers SilentGen Source: Merrill Lynch – Age Wave, 2014Base Age 21+ AGREEING THAT HOME OWNERSHIP AN IMPORTANT PART Survey: American Dream joelkotkin.com 18
  • 19.
    BY GENERATION: 2011 Expectingto Marry & Have Kids joelkotkin.com 19
  • 20.
    Projected national numberof 20-27 and 28-35 population cohorts, 2014 to 2060 34 35 36 37 38 39 40 41 42 2014 2016 2018 2020 2022 2024 2026 2028 2030 2032 2034 2036 2038 2040 2042 2044 2046 2048 2050 2052 2054 2056 2058 2060 20-27 28-35 Source: Business Insider/Andy Kiersz, data from US Census Bureau joelkotkin.com 20
  • 21.
    % living inurban neighborhoods, by age group 30% 25% 20% 15% 18-24 25-29 30-34 35-39 40-44 45-49 50-54 55-59 60-64 65-69 70-74 75-79 80-84 85+ 2000 2014 An aging population also boosts the suburbs joelkotkin.com 21
  • 22.
    Detached House 81% Townhouse 8% Multi-Unit 7% Other 4% 2014-2015 NATIONAL ASSOCIATIONOF REALTORS From National Association of Realtors, 2015 House Purchases: Under Age 35 joelkotkin.com 22
  • 23.
    -20% -10% 0%10% 20% 30% 40% 50% 60% Los Angeles MSA New York MSA Chicago MSA San Diego MSA San Francisco MSA San Jose MSA Sacramento MSA Riverside San Bernardino MSA Houston MSA Dallas-Fort Worth MSA Austin MSA California United States Outside California MSAs California MSAs Derived from Census Bureau data SELECTED METROPOLITAN AREAS: 2000-2015 Change in Child Population (5-14) joelkotkin.com 23
  • 24.
    0% 5% 10%15% 20% 25% Georgia Hawaii Mississippi Nevada New Mexico Arizona Louisiana New York Florida California UNITED STATES Housing Cost Adjusted Poverty Rate STATES: 2015 Census Bureau data Highest Housing Adjusted Poverty Rates joelkotkin.com 24
  • 25.
    0% 10% 20%30% 40% 50% Bakersfield Modesto Stockton Fresno #42 San Jose, CA #43 Boston, MA-NH #44 Las Vegas, NV #45 Virginia Beach-Norfolk, VA-… #46 Orlando, FL #47 San Francisco, CA #48 Sacramento, CA #49 Riverside-San Bernardino,… #50 San Diego, CA #51 New York, NY-NJ-PA #52 Miami, FL #53 Los Angeles, CA % of Households Other Large CA MSAs Major CA MSAs Other Major MSAs Housing Cost Burdened Households 12 WORST MAJOR MSAS & OTHER LARGE CA MSAS Source: American Community Survey joelkotkin.com 25
  • 26.
    Grand Delusions won’trestore Upward Mobility in California : We Need to Change the Debate California Policies • Green Jobs and forced density • High-Speed Rail and transit • Social engineering away from families and middle class housing and jobs joelkotkin.com 26
  • 27.
    0 1 23 4 United States Texas California Los Angeles San Francisco Riverside-San Bernardino San Diego Sacramento San Jose Permit Rate per 1,000 Population Multi Family Single Family (Detached) CALIFORNIA & THE US: 2011-2015: DETACHED & MULTI-FAMILY Residential Building Permits joelkotkin.com 27
  • 28.
    0% 1% 2% 3% 4% 5% 6% 1980 1990 20002010 2014 MarketShare Market Share for Indicated Years Only Transit Work at Home TRANSIT & WORK AT HOME SHARE: 1980-2014 Derived Census Bureau data Los Angeles CSA Commuting joelkotkin.com 28
  • 29.
    0 5 10 15 20 25 30 Core Inner RingSecond Ring Outer Ring MetricTons AUSTRALIA 5 LARGE CAPITAL URBAN AREAS Housing Form in Australia and Its Impact on Greenhouse Gas Emissions CO2 Emissions per Capita: By Sector joelkotkin.com 29
  • 30.
    EMISSION REDUCTION GOALS& OUT-MIGRANT INCREASE California Air Resources Board and David Friedman California Emissions: Comparisons joelkotkin.com 30
  • 31.
    0 1 2 3 4 5 6 7 8 ComparedtoDetached(5) Construction Cost/Square FootCompared to Detached (5 per Acre) SAN FRANCISCO BAY AREA Construction Cost by House Type Derived from FBI Statistics: 2013, Major metropolitan areas (average). joelkotkin.com 31
  • 32.
    Future of Suburbia •Suburbia about to gain as minorities and millennials head there • Future suburbs will develop more amenities and be more self-sufficient • The diverse, more interesting suburbs are best positioned joelkotkin.com 32
  • 33.
    The Shift inretail will open new opportunities joelkotkin.com 33
  • 34.
    The Future ofRetail joelkotkin.com 34
  • 35.
    Key Solutions andRecommendations • Reform regulatory rules to be friendly for middle class and family housing • More emphasis on dispersed and home based work patterns • Transportation solutions should be 21st Century variety, not yet another failed attempt to recreate the 19th • Look to shift redundant office space to housing and develop responsible housing, flexible workplaces on periphery joelkotkin.com 35
  • 36.
    • After allis said and done, he --- the citizen --- is really the city. The city is going wherever he goes. “ Frank Lloyd Wright, The Living City, (1958) joelkotkin.com 36
  • 37.