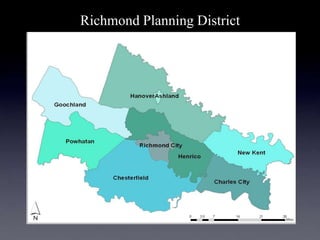
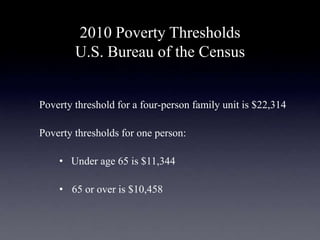
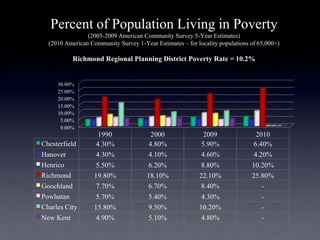
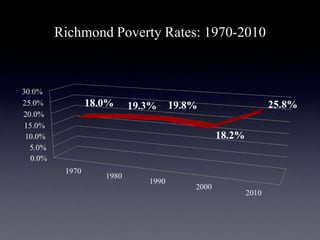
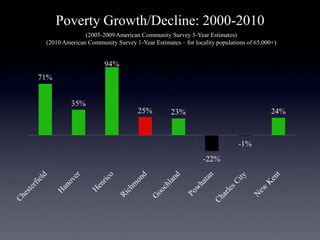
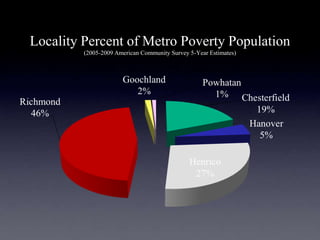
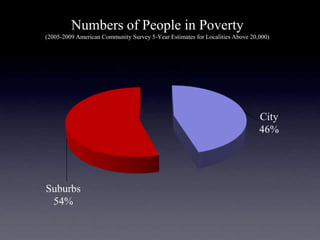
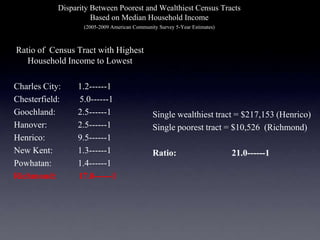
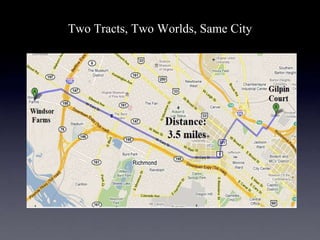
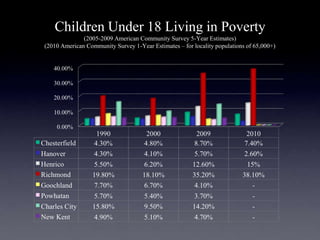
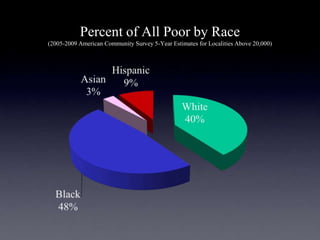
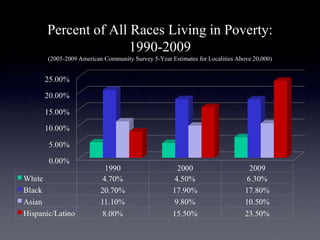
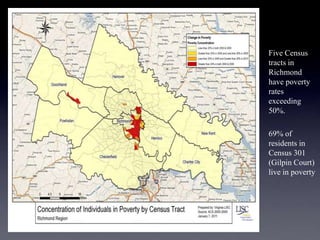
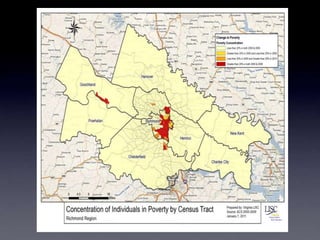
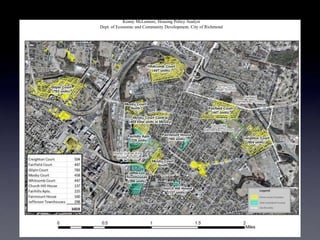
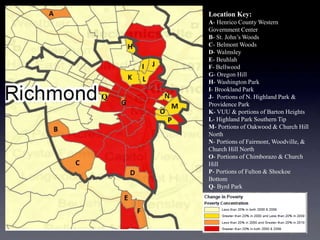
It is recommended that professionally facilitated
       dialogue accompany this presentation.

 Contact Hope in the Cities at 804-358-1764 or
the Virginia Center for Inclusive Communities
    at 804-515-7950 for facilitation support.
Richmond Planning District
2010 Poverty Thresholds
        U.S. Bureau of the Census


Poverty threshold for a four-person family unit is $22,314

Poverty thresholds for one person:

    • Under age 65 is $11,344

    • 65 or over is $10,458
Percent of Population Living in Poverty
              (2005-2009 American Community Survey 5-Year Estimates)
(2010 American Community Survey 1-Year Estimates – for locality populations of 65,000+)

         Richmond Regional Planning District Poverty Rate = 10.2%
Richmond Poverty Rates: 1970-2010
Poverty Growth/Decline: 2000-2010
              (2005-2009 American Community Survey 5-Year Estimates)
(2010 American Community Survey 1-Year Estimates – for locality populations of 65,000+)
Locality Percent of Metro Poverty Population
         (2005-2009 American Community Survey 5-Year Estimates)
Numbers of People in Poverty
(2005-2009 American Community Survey 5-Year Estimates for Localities Above 20,000)
Disparity Between Poorest and Wealthiest Census Tracts
                      Based on Median Household Income
                   (2005-2009 American Community Survey 5-Year Estimates)


Ratio of Census Tract with Highest
   Household Income to Lowest

Charles City:    1.2------1
Chesterfield:    5.0------1
Goochland:       2.5------1                    Single wealthiest tract = $217,153 (Henrico)
Hanover:         2.5------1                    Single poorest tract = $10,526 (Richmond)
Henrico:         9.5------1
New Kent:        1.3------1                    Ratio:                       21.0------1
Powhatan:        1.4------1
Richmond:        17.0------1
Two Tracts, Two Worlds, Same City
Children Under 18 Living in Poverty
              (2005-2009 American Community Survey 5-Year Estimates)
(2010 American Community Survey 1-Year Estimates – for locality populations of 65,000+)
Percent of All Poor by Race
(2005-2009 American Community Survey 5-Year Estimates for Localities Above 20,000)
Percent of All Races Living in Poverty:
               1990-2009
(2005-2009 American Community Survey 5-Year Estimates for Localities Above 20,000)
Percent of Poor by Race Living in City and Suburbs
   (2005-2009 American Community Survey 5-Year Estimates for Localities Above 20,000)
Latino Poverty


Jeff Davis Highway                    Jeff Davis Highway


   Midlothian                            Hull Street
•   Five Census
    tracts in
    Richmond
    have poverty
    rates
    exceeding
    50%.

•   69% of
    residents in
    Census 301
    (Gilpin Court)
    live in poverty
Subsidized Housing Concentration in Richmond
                        Kenny McLemore, Housing Policy Analyst
            Dept. of Economic and Community Development, City of Richmond
Location Key:
A- Henrico County Western
Government Center
B- St. John’s Woods
C- Belmont Woods
D- Walmsley
E- Beuhlah
F- Bellwood
G- Oregon Hill
H- Washington Park
I- Brookland Park
J- Portions of N. Highland Park &
Providence Park
K- VUU & portions of Barton Heights
L- Highland Park Southern Tip
M- Portions of Oakwood & Church Hill
North
N- Portions of Fairmont, Woodville, &
Church Hill North
O- Portions of Chimborazo & Church
Hill
P- Portions of Fulton & Shockoe
Bottom
Q- Byrd Park

Unpacking the 2010 Census - Part 1

  • 1.
    It is recommendedthat professionally facilitated dialogue accompany this presentation. Contact Hope in the Cities at 804-358-1764 or the Virginia Center for Inclusive Communities at 804-515-7950 for facilitation support.
  • 2.
  • 3.
    2010 Poverty Thresholds U.S. Bureau of the Census Poverty threshold for a four-person family unit is $22,314 Poverty thresholds for one person: • Under age 65 is $11,344 • 65 or over is $10,458
  • 4.
    Percent of PopulationLiving in Poverty (2005-2009 American Community Survey 5-Year Estimates) (2010 American Community Survey 1-Year Estimates – for locality populations of 65,000+) Richmond Regional Planning District Poverty Rate = 10.2%
  • 5.
  • 6.
    Poverty Growth/Decline: 2000-2010 (2005-2009 American Community Survey 5-Year Estimates) (2010 American Community Survey 1-Year Estimates – for locality populations of 65,000+)
  • 7.
    Locality Percent ofMetro Poverty Population (2005-2009 American Community Survey 5-Year Estimates)
  • 8.
    Numbers of Peoplein Poverty (2005-2009 American Community Survey 5-Year Estimates for Localities Above 20,000)
  • 9.
    Disparity Between Poorestand Wealthiest Census Tracts Based on Median Household Income (2005-2009 American Community Survey 5-Year Estimates) Ratio of Census Tract with Highest Household Income to Lowest Charles City: 1.2------1 Chesterfield: 5.0------1 Goochland: 2.5------1 Single wealthiest tract = $217,153 (Henrico) Hanover: 2.5------1 Single poorest tract = $10,526 (Richmond) Henrico: 9.5------1 New Kent: 1.3------1 Ratio: 21.0------1 Powhatan: 1.4------1 Richmond: 17.0------1
  • 10.
    Two Tracts, TwoWorlds, Same City
  • 11.
    Children Under 18Living in Poverty (2005-2009 American Community Survey 5-Year Estimates) (2010 American Community Survey 1-Year Estimates – for locality populations of 65,000+)
  • 12.
    Percent of AllPoor by Race (2005-2009 American Community Survey 5-Year Estimates for Localities Above 20,000)
  • 13.
    Percent of AllRaces Living in Poverty: 1990-2009 (2005-2009 American Community Survey 5-Year Estimates for Localities Above 20,000)
  • 14.
    Percent of Poorby Race Living in City and Suburbs (2005-2009 American Community Survey 5-Year Estimates for Localities Above 20,000)
  • 15.
    Latino Poverty Jeff DavisHighway Jeff Davis Highway Midlothian Hull Street
  • 17.
    Five Census tracts in Richmond have poverty rates exceeding 50%. • 69% of residents in Census 301 (Gilpin Court) live in poverty
  • 19.
    Subsidized Housing Concentrationin Richmond Kenny McLemore, Housing Policy Analyst Dept. of Economic and Community Development, City of Richmond
  • 20.
    Location Key: A- HenricoCounty Western Government Center B- St. John’s Woods C- Belmont Woods D- Walmsley E- Beuhlah F- Bellwood G- Oregon Hill H- Washington Park I- Brookland Park J- Portions of N. Highland Park & Providence Park K- VUU & portions of Barton Heights L- Highland Park Southern Tip M- Portions of Oakwood & Church Hill North N- Portions of Fairmont, Woodville, & Church Hill North O- Portions of Chimborazo & Church Hill P- Portions of Fulton & Shockoe Bottom Q- Byrd Park