
Downloaded 129 times
![388 TAM ET AL.
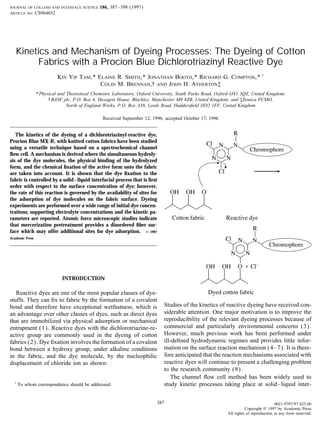
faces (9–11). In our previous preliminary studies (12, 13), Procion Blue MX-R (A) and knitted cotton fabrics are exam-
the method was applied to investigate the kinetics of reactive ined using the proposed spectrochemical method. It should
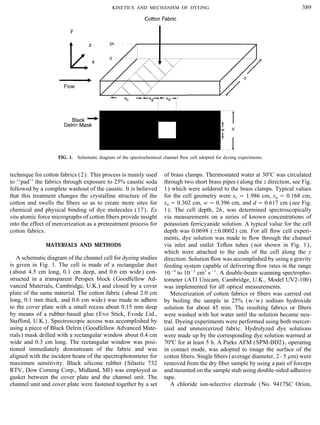
dyeing. The dye solution was made to flow, under laminar be emphasized that the dyeing process is complicated by a
conditions, over woven cotton fabric that was embedded in parallel hydrolysis reaction of the dye molecules and the
one wall of a rectangular channel. An electrochemical detec- uptake of hydrolyzed dye which are given, respectively, in
tor was mounted immediately downstream of the fabric to Eqs. [1] and [2]. In particular, we measure the homogeneous
sensitively monitor the consumption of dye or the release hydrolysis rate of the dye (Eq. [1]) and the uptake rate of
of product (such as Cl0
). Since the hydrodynamics are well the hydrolyzed dye (Eq. [2]) independently. In the consider-
defined, the convection–diffusion kinetic equations within ation of the reactive dyeing process, a reaction model based
the flow cell could be solved precisely to give a quantitative on Eqs. [1] – [3] is proposed to model the kinetic data ob-
assessment of the detector response as a function of solution tained over a wide range of initial dye concentrations and
flow rate. In this manner, the interfacial kinetics between supporting electrolyte concentrations. Dyeing and homoge-
dichlorotriazinyl-reactive dyes and cotton fabrics were found neous hydrolysis rate constants (kDCl , kDOH , and khyd ) are
to be controlled by a surface reaction which was first order reported.
with respect to the surface concentration of the dye and
controlled by a process at the interface or in the fiber pores.
Explicit information to separate out the adsorption–diffusion
reaction process is not, however, obtained. In a recent study
(14), the same technique was employed to scrutinize the
dyeing of nylon and woven cotton fabrics with nonreactive
azo dyes. Compared with the mechanism of reactive dyeing,
it was shown that the nonreactive absorption involved the
transport of dye molecules from bulk solution across a po-
rous surface layer within the fabric next to the solution, and
then into the bulk fabric; however, the dye uptake rate was
affected by the rate of mass transport and the availability of
adsorption sites within the surface layer.
In the real-world dyebath environment, the fixation of
reactive dye is usually carried out in a high-pH medium with
a substantial concentration of supporting electrolyte, e.g.,
sodium sulfate. Moreover, in many situations, the dye mole-
cule may not be electrochemically active or its detection
may become difficult within the dyebath matrix. All these
considerations limit the immediate application of the channel
flow cell method; however, we recently developed a spec-
troelectrochemical channel cell based on a channel electrode
to interrogate the dimerization kinetics of the methyl violo-
gen radical cation in water (15) and the diffusion properties
of the tris(4-bromophenyl)amine radical cation in acetoni-
trile (16). In this work this spectroelectrochemical channel
cell is extended to spectrochemically investigate the kinetics
of reactive dyeing on knitted cotton fabrics. Specifically, we
monitor the in situ consumption of dye by means of UV–
visible spectroscopy. In contrast to the previous work (12–
14) using electrochemical detection, it is envisaged that the
proposed method will be universal for the measurement of
dye uptake by fabric under realistic dyebath conditions since
DCl ϩ OHϪ
A B
B C
A
A
C
DOH ϩ CLϪ
[1]
khyd
DOH ϩ Cell–OϪ
[DOH … O–Cell]Ϫ
[2]
kDOH
DCl ϩ Cell–OϪ
O NH¤
SO‹H
NH©
DCI
©SO‹H
NH
Cl
Cl
O
[DCl … Cell–O]Ϫ
[3]
kDCl
N
N
N
B
C
O NH¤
SO‹H
NH©
DOH
Cotton fabric
OH OH OϪ
©SO‹H
NH
Cl
OH
O
N
N
N
all dyestuffs are necessarily spectroscopically active in the
Note that the dotted lines in Eqs. [2] and [3] representvisible region. Furthermore, comparison of the results ob-
the adsorption of the dye molecule to the fabric surface,tained with those derived from chloride detection should go
whereas the latter step involves subsequent chemical bondsome way to differentiating the chemical reaction and physi-
formation also.cal adsorption/diffusion processes.
In the present studies, the reactive dyeing kinetics between Mercerization is frequently invoked as a pretreatment
AID JCIS 4652 / 6g1c$$$$$3 01-09-97 03:04:13 coidas](https://image.slidesharecdn.com/kineticsdye-151002083015-lva1-app6891/85/Kinetics-dye-2-320.jpg)
![390 TAM ET AL.
Boston, MA) was applied to measure the homogeneous hy- and detector window regions into grids of K (x direction)
1 J (y direction) boxes via the standard backward implicitdrolysis kinetics of the dye. Potentiometric detections were
made with reference to a saturated calomel electrode and finite difference (BIFD) procedure as detailed elsewhere
(18). Assuming the initial dye concentration is D0 , the bulkwere accomplished using a Jenway 3030 pH meter. All ki-
netic measurements were performed at 30ЊC. Complemen- concentrations of A and B at particular time t are
tary flow cell dyeing experiments were followed using the
Orion ion-selective electrode. The chloride ion-selective [A]b Å D0exp(0khydt), [7]
electrode consists of a solid-state sensing element (0.799 cm
[B]b Å D0 0 [A]b . [8]
in diameter) in the form of a disk situated concentrically in
a plastic sheath (1.148 cm in diameter). The electrode was
At the fabric surface, the dye uptake kinetics can be formu-
inserted into the cover plate through a hole of the same size
lated as
drilled adjacent to the fabric. Sealing was accomplished by
using two O-rings mounted at both ends of the hole. A
channel cell width of 1.148 cm and depth of 0.093 cm were JA (mol cm02
s01
) Å DA
Ì[A]
Ìy
ͿyÅ0
Å kDCl[A]0 , [9]
employed. This permits the whole sensing element of the
electrode to be used for experimentation. Typical values of
xc and xg are 2.003 and 0.211 cm, respectively. JB (mol cm02
s01
) Å DB
Ì[B]
Ìy
ͿyÅ0
Å kDOH[B]0 , [10]
Cotton fabrics, fibers, and Procion Blue MX-R (CI Reac-
tive Blue 4, 80.7%) were kindly supplied by Zeneca Special-
ties (Manchester, U.K.). The cotton fabrics and fibers were
where [A]0 and [B]0 denote the surface concentrations ofmade of bleached unmercerized knitted Indian Cotton. So-
A and B, respectively. kDCl and kDOH are, respectively, thedium sulfate, sodium carbonate, sodium hydroxide, and po-
dyeing rate constants of A and B.tassium ferricyanide were of reagent grade from Aldrich.
At the far wall and the detector window,All solutions were made up using deionized water of resisti-
vity ú107
V-cm.
Ì[A]
Ìy
Å
Ì[B]
Ìy
Å 0. [11]
THEORETICAL BACKGROUND
Once the concentration profiles of DCl ([A]x,y,t ) and DOHAssuming that the rate of hydrolysis of A is slow com-
([B]x,y,t ) at a particular time (t) and solution flow rate (Vf )pared with the channel flow cell experimental time scale,
have been computed, the downstream absorbance at a partic-the convection–diffusion equations describing the transport
ular wavelength (l) can be evaluated by the equationof A and B within the channel cell can be written as
Ì[A]
Ìt
Å DA
Ì2
[A]
Ìy2
0 £x
Ì[A]
Ìx
Å 0 [4]
Absl (Vf , t) Å
el,A ͐
x2
x1
͐
2h
0
[A]x,y,t dydx
/ el,B ͐
x2
x1
͐
2h
0
[B]x,y,t dydx
x2 0 x1
. [12]
and
el,A and el,B represent, respectively, the extinction coeffi-
cients of A and B, and x1 and x2 indicate the x coordinatesÌ[B]
Ìt
Å DB
Ì2
[B]
Ìy2
0 £x
Ì[B]
Ìx
Å 0, [5]
at the beginning and end of the detector window. The integral
of Eq. [12] was evaluated by using a trapezoidal method
with (19). In all calculations, a grid size of 5000 1 3000 was
required for the absorbance profile to converge within 2%.
All supporting programs were coded in an UNIX C environ-
Vx Å
3Vf
4hd ͫ1 0
(h 0 y)2
h2 ͬ, [6] ment and executed on a SUN Sparc workstation.
It can be seen that the absorbance (Eq. [12]) is a function
of solution flow rate (Vf ), time (t), initial dye concentration
(D0 ), diffusion coefficients (DA , DB ), extinction coefficientswhere h, d, x, and y are defined in Fig. 1. £x is the solution
velocity axially through the channel and Vf denotes the solu- (el,A , el,B ), cell geometry, and, most importantly, the dyeing
heterogeneous rate constants kDCl and kDOH . For a given ex-tion flow rate in cm3
s01
. DA and DB are, respectively, the
diffusion coefficients of A and B. Solutions to Eqs. [4] and periment, Vf , t, D0 , DA , DB , el,A , el,B , and cell geometry are
easily determined. Here, the values of kDOH are first measured[5] are readily accomplished by dividing the fabric, gap,
AID JCIS 4652 / 6g1c$$$$$5 01-09-97 03:04:13 coidas](https://image.slidesharecdn.com/kineticsdye-151002083015-lva1-app6891/85/Kinetics-dye-4-320.jpg)
![391KINETICS AND MECHANISM OF DYEING
TABLE 1 coupled with Powell’s quadratic interpolation linear search
Homogeneous Hydrolysis Rate Constants (khyd) at 30ЊC technique (15, 20–22) was implemented to minimize the
Determined Using a Commercially Available Chloride Sensor RMSD value for the deduction of optimized dyeing rate
constants.
Na2 SO4 Na2 CO3 Khyd
a
(M) (M) (1005
s01
)
RESULTS AND DISCUSSION
0.35 0.10 9.1 { 0.7
0.00 0.10 8.3 { 0.8
The homogeneous hydrolysis kinetics at 30ЊC were inves-0.35 0.00 NAb
tigated by using a chloride ion-selective electrode (ISE).0.00 0.00 NA
The chloride concentration of the DCl solutions (see Table
a
Initial dye concentration was 1.0 mM. 1) as a function of time was monitored using the ISE. Theb
Not available.
DCl concentration was calculated (see Eq. [1]) by sub-
tracting this quantity from the initial dye concentration and
was in good agreement with first-order kinetics. Table 1precisely by using completely hydrolyzed dye solutions. kDCl
summarizes the first-order hydrolysis rate constants (khyd ).can therefore be derived unambiguously from the best fit
It can be seen that the rate constant is slightly larger in thebetween theoretical and experimental data. An error func-
presence of 0.35 M Na2SO4 ; however, the hydrolysis processtion, root-mean-square deviation (RMSD), is defined to in-
is too slow to be detectable in neutral solution.dicate the quality of the fit between theory and experiment,
Before turning to the dyeing kinetics experiments, we
examined the extinction coefficients and diffusion coeffi-
cients of DCl and DOH. Figure 2 gives the absorption spectraRMSD Å
͚N
iÅ1 [dA(i)theory
0 dA(i)expt
]2
N
, [13]
of DCl obtained from different dye concentrations in 0.10
M Na2CO3 and 0.35 M Na2SO4 solution. As shown in Fig.
3, the absorption maximum at 604 nm over a wide range ofwhere N is the number of data points. dA is the difference
between the absorbance measured through the detector win- DCl concentration agreed well with Beer’s law. Moreover,
no isosbestic point was observed in the absorption spectradow without and with the fabric, at the specified flow rate
and time. The former quantity can be determined by re- (see Fig. 2). These observations imply that any self-associa-
tion of the dye molecules is negligible or unchanging overversing the flow through the cell so that solution passes over
the detector window before it reaches the fabric. To this end, the concentration range. It was found that the spectral proper-
ties of DCl and DOH were essentially indistinguishable (seethe BFGS (Broyden–Fletcher–Goldfarb–Shanno) method
FIG. 2. Absorption spectra of DCl obtained from different dye concentrations in 0.10 M Na2CO3 and 0.35 M Na2SO4 solution. Cell depth is
0.117 cm.
AID JCIS 4652 / 6g1c$$$$$6 01-09-97 03:04:13 coidas](https://image.slidesharecdn.com/kineticsdye-151002083015-lva1-app6891/85/Kinetics-dye-5-320.jpg)


![394 TAM ET AL.
TABLE 3
Dyeing Rate Constants (kDCl , kDOH) Determined Using a Spectrochemical Channel Cell at 30ЊC
Na2 SO4 Na2 CO3 D0 kDCl
b
kDOH
b
(M) (M) (mM) Pretreatmenta
(1005
cm s01
) (1005
cm s01
)
0.35 0.10 1.0 Merc.c
5.1 { 0.4 1.5 { 0.1
0.35 0.00 1.0 Merc. 1.9 { 0.1 NAd
0.35 0.10 1.0 Not merc.e
4.7 { 0.4 0.9 { 0.1
0.35 0.00 1.0 Not merc. 0.9 { 0.1 NA
0.35 0.10 0.5 Not merc. 5.1 { 0.5 1.3 { 0.1
0.35 0.00 0.5 Not merc. 1.3 { 0.2 NA
0.35 0.10 3.0 Not merc. 3.1 { 0.2 0.5 { 0.1
0.35 0.00 3.0 Not merc. 0.6 { 0.1 NA
0.00 0.10 1.0 Not merc. 2.3 { 0.3 0.2 { 0.1
0.00 0.00 1.0 Not merc. NAf
NA
a
Original cotton fabric: knitted, bleached, unmercerized.
b
Rate constants are typically the means of four independent experiments.
c
Mercerized fabric.
d
Not available.
e
Fabric without mercerization.
f
Reaction was too slow to be detectable.
the rate of this reaction is controlled by the availability of
JA Å
Dfilm
d
([A]b 0 [A]0 ) Å kDCl[A]0 , [14]the adsorption sites for dye molecules on the fabric surface.
We next turn to this argument.
As shown in Table 3, the values of kDCl decrease as the where Dfilm denotes the diffusion coefficient through the sur-
initial dye concentrations increase. This can be rationalized face layer and d represents its thickness. We assume Dfilm is
by using a surface blocking model as derived in our previous directly proportional to the amount of ‘‘free’’ sites,
work (14, 24). A schematic diagram of this model is visual-
Dfilm Å Dfree (1 0 u), [15]ized in Fig. 6. Here, the transport of dye molecules from the
bulk solution to the fabric is considered to go through a
where Dfree designates the diffusion coefficient through theporous surface layer. The dye molecules are first adsorbed
surface layer, if no dye molecule is adsorbed, and u is theinto the surface layer. Further fixation occurs after dye mole-
fraction of filled sites. Let the adsorption of dye moleculecules penetrate to the surface of the bulk fabric. As the
proceed via monolayer adsorption as described by the Lang-concentration of dye increases, more dye molecules are ad-
muir isotherm (25),sorbed onto the surface layer and therefore the dye adsorp-
tion rate decreases. Under steady-state conditions, the flux
of DCl passing through the surface layer is equal to the u Å
K[A]b
1 / K[A]b
, [16]
uptake flux at the fabric boundary (14, 24), which was given
in Eq. [9]. This can be written as
where K is the constant for the adsorption/desorption pro-
cess:
1 0 u Å
1
1 / K[A]b
, put k Å
Dfree
d
[17]
І JA Å
k
1 / K[A]b
([A]b 0 [A]0 ) Å kDCl[A]0 . [18]
Rearranging,
1
kDCl
Å
1
k
[A]0
[A]b 0 [A]0
/
K
k
[A]b[A]0
[A]b 0 [A]0
. [19]
FIG. 6. Schematic diagram of surface blocking model describing the
transport of reactive dye to the fabric surface. Similarly, we can derive the following equation for DOH:
AID JCIS 4652 / 6g1c$$$$$6 01-09-97 03:04:13 coidas](https://image.slidesharecdn.com/kineticsdye-151002083015-lva1-app6891/85/Kinetics-dye-8-320.jpg)
![395KINETICS AND MECHANISM OF DYEING
FIG. 7. Variations of kDCl with [A]0 at pH 11 (᭺) and 7 (ᮀ) in 0.35 M Na2SO4 solution, with the solid lines representing the theoretical behavior
generated by using the surface blocking model and the optimized kinetic parameters as given in Table 4.
of the dye fixation with the fabric decreases as the dye con-1
kDOH
Å
1
k
[B]0
[B]b 0 [B]0
/
K
k
[B]b[B]0
[B]b 0 [B]0
. [20] centration increases which may be qualitatively explained
by the restricted migration of dye molecules due to the afore-
mentioned blocking effect or, alternatively, the fabric might
[A]0 and [B]0 , are evaluated by using the average concen- become locally dye-saturated during experiments.
trations across the fabric surface from the BIFD calculations. In the present study, we take into consideration the hydro-
The two kinetic parameters, K and k, in Eqs. [19] and lysis in bulk solution and determine, independently, the ki-
[20] can readily be optimized by using multiple variable netics of the uptake of hydrolyzed dye by the fabric. This
regression (26) or the BFGS method as mentioned before. permits us to measure precisely the rate of DCl uptake on
The results obtained from both techniques agree well. Figure the fabric surface. Recent work reported that the selectivity
7 gives the variation of kDCl with [A]0 at pH 11 (0.10 M for the competing alcoholysis and hydrolysis of reactive dye
Na2CO3 ) and 7 (0.00 M Na2CO3 ). Figure 8 depicts the varia- (Procion Orange MX-2R) is about 40 to 3000 (28). We
tion of kDOH with [B]0 at pH 11. The solid lines represent anticipate that as the dye molecule adsorbs onto cotton fab-
the theoretical behavior generated using Eq. [19] or [20] in ric, the dye itself may be partially protected from hydrolysis
conjunction with the optimized K and k as given in Table in terms of the steric hindrance offered by the fabric, because
4. It can be seen that k are quantitatively the same for DCl only part of the dye molecule will be exposed to solution.
and DOH. This indicates that the unreacted dye molecule Moreover, it is well established that the [Cell–O0
]/[OH0
]
and its hydrolyzed form have similar transport characteristics ratio at pH 11 is about 28 (1). Based on the above deduc-
across the porous surface layer. Note that the K value of tions, we believe the adsorbed dye molecule preferentially
DCl is about one order of magnitude greater than that of reacts with Cell–O0
by the formation of a covalent bond.
DOH, which suggests that the affinity for adsorption of the Complementary flow cell dyeing experiments were con-
unreacted dye molecule to the fabric surface is greater than ducted using the Orion ISE to see whether the above specula-
that of its hydrolyzed form. This may possibly be explained tion is justified. By monitoring the chloride release from the
by considering the pKa value of DOH, which is around 5 to fabric, the extent of chemical binding of dye molecules on
6 (27). Under the present dyeing environment (pH É 11), the fabric surface may be quantified. This can be elucidated
the hydrolyzed dye molecule exists virtually entirely in the by the equation
anionic form (DO0
). The electrostatic repulsion between
the fabric (Cell–O0
, see below) and DO0
may lead to the
DCl
A
/ Cell–O0
C
r
kDCl
Cell–O–D / Cl0
E
. [21]
lower value of K. It can be seen that at pH 11, the value of
kDCl decreases approximately linearly as the dye concentra-
tion increases (see Fig. 7). This implies that the efficiency Here, we assume DCl is hydrolyzed (Eq. [1]) in solution in
AID JCIS 4652 / 6g1c$$$$$6 01-09-97 03:04:13 coidas](https://image.slidesharecdn.com/kineticsdye-151002083015-lva1-app6891/85/Kinetics-dye-9-320.jpg)
![396 TAM ET AL.
FIG. 8. Variation of kDOH with [B]0 at pH 11 (᭺) in 0.35 M Na2SO4 solution, with the solid line representing the theoretical behavior generated by
using the surface blocking model and the optimized kinetic parameters given in Table 4.
parallel to Eq. [21] with the rate constant khyd given in Table a function of solution flow rate. The optimized dyeing rate
constant was found to be 6.1 ({3.3) 1 1005
cm s01
. Within1. In this treatment, the boundary conditions for DCl are the
same as before (Eqs. [9] and [10]). As for Cl0
, the follow- experimental uncertainties, this quantity is comparable to
the dyeing rate constant (kDCl ), 4.7 ({0.4) 1 1005
cm s01
,ing equation is adopted at the fabric surface:
measured using the proposed spectroscopic method (see Ta-
ble 3). This indicates that the dyeing rate constants (kDCl ),
DA
Ì[A]
Ìy
Å 0DE
Ì[E]
Ìy
. [22] as determined spectroscopically, may directly reflect the
fixation rate of the dye molecules onto the fabric.
We next consider the morphological change induced by
A diffusion coefficient of 2.4 1 1005
cm2
s01
for the chloride
mercerization. Cotton fibers before and after the merceriza-
ion in aqueous solution (29) was used for modeling pur-
tion process were imaged in air using an atomic force micro-
poses. The convection–diffusion equation for chloride ion
scope and are depicted, respectively, in Figs. 10 and 11. It
(E) is essentially the same form as that of DCl (see Eq. [4])
can be seen that the mercerized fibers show a more disor-
and can be solved as before to obtain the average chloride
dered surface in comparison with the unmercerized fibers.
concentrations above the detector electrode surface. Dyeing
This observation is in consistent with literature reports (2,
experiments were performed using an initial dye concentra-
17, 30). It is anticipated that the disorder of the mercerized
tion of 1.0 mM, sodium carbonate concentration of 0.1 M,
surface provides more accessible sites for dye fixation; this
and sodium sulfate concentration of 0.35 M. Figure 9 is a plot
is in qualitative agreement with the observed 10% increase
of the experimental and theoretical chloride concentration as
in kDCl (see Table 3).
CONCLUDING REMARKSTABLE 4
Optimized Kinetic Parametersa
(see Eqs. [19] and [20]) for the
A universal method based on a spectrochemical channelAdsorption of DCl and DOH on Unmercerized Fabric Based on
flow cell has been developed to study dyeing processes. Thea Surface Blocking Model
proposed method was exemplified by the reactive dyeing of
DCl DCl DOH Procion Blue MX-R on knitted cotton fabrics. The reactive
(pH 11) (pH 7) (pH 11) dyeing is complicated by the simultaneous hydrolysis of the
dye molecules and the physical binding of the hydrolyzed
K (mol01
cm3
) 2.4 1 104
1.2 1 104
1.9 1 103
form onto the fabric. All these processes were taken intok (cm s01
) 1.7 1 1004
1.6 1 1004
1.6 1 1004
account in the reaction model evolved. In particular, the
a
[Na2 SO4] Å 0.35 M. kinetic results indicate that the dye fixation to the fabric is
AID JCIS 4652 / 6g1c$$$$$7 01-09-97 03:04:13 coidas](https://image.slidesharecdn.com/kineticsdye-151002083015-lva1-app6891/85/Kinetics-dye-10-320.jpg)


This study examines the kinetics of dyeing cotton fabrics with a reactive dye called Procion Blue MX-R using a spectrochemical channel flow cell method. A reaction mechanism is proposed that accounts for the simultaneous hydrolysis of dye molecules, physical adsorption of the hydrolyzed form, and chemical fixation onto the fabric. The dye fixation is found to be a first-order solid-liquid interfacial reaction controlled by the availability of adsorption sites on the fabric surface. Dyeing experiments are performed over a range of dye concentrations and electrolyte concentrations to determine the kinetic parameters. Atomic force microscopy indicates that mercerized fabrics have a more disordered fiber surface providing additional dye adsorption sites.


