SlideShare a Scribd company logo
1 of 8
Download to read offline
1836 New J. Chem., 2012, 36, 1836–1843 This journal is c The Royal Society of Chemistry and the Centre National de la Recherche Scientifique 2012
Cite this: New J. Chem., 2012, 36, 1836–1843
Color prediction from first principle quantum chemistry computations: a
case of alizarin dissolved in methanolw
Piotr Cysewski,*ab
Tomasz Jelin´ ski,a
Maciej Przyby$eka
and Aleksander Shyichukb
Received (in Montpellier, France) 26th April 2012, Accepted 14th June 2012
DOI: 10.1039/c2nj40327g
The electronic spectrum of alizarin (AZ) in methanol solution was measured and used as
reference data for color prediction. The visible part of the spectrum was modelled by different
DFT functionals within the TD-DFT framework. The results of a broad range of functionals
applied for theoretical spectrum prediction were compared against experimental data by a direct
color comparison. The tristimulus model of color expressed in terms of CIE XYZ and CIE Lab
parameters was applied both to experimental and predicted spectra. It was found that the HSE03
method along with the 6-31G(d,p) basis set provides the most accurate color prediction, much
better than other commonly used functionals such as B3LYP, CAM-B3LYP or PBE0. Besides, the
influence of potential errors, introduced by theoretical predictions on color estimation, was
examined for different wavelengths. The obtained results showed that color prediction is
significantly dependent on the type of basis set and functional applied. The proposed methodology
provides a simple, straightforward and more reliable way of theoretical protocols validation than
just a comparison of experimental and estimated values of maximum absorbance wavelength.
Introduction
Color characteristic of many industrial and commercial products is
one of those crucially important parameters that require standardi-
zation as well as reproducibility. However, tint perception is a
complex human activity involving physical, physiological and
psychological counterparts.1
The theory of color perception sug-
gests that existing three channels, responding in an antagonist way,
are specialized for detection of color vision with non-uniform
sensitivity in short (420–440 nm), middle (530–540 nm) and long
(560–580 nm) wavelength ranges. The existence of such three
distinct cone cells stands for the principle that three parameters
are sufficient for quantification of human color sensation. This
forms the basis of so called tristimulus values and the defined
standard created by the International Commission on Illumination
(CIE) in 1931.2,3
A method for associating tristimulus values with
perceived color is termed as color space. Thus, the XYZ tristimulus
values represent the reflectance or transmittance spectrum weighted
by color-matching functions and integrated over the whole
spectrum. In Fig. 1 the filtering of the D65 illuminant by absor-
bance of alizarin solution is presented.
Using adequate definition one can infer the actual color
directly from the experimental or the theoretical spectrum of
the visible region. This was already addressed by Beck4
for
nine selected dyes. The proposed scheme is based on the
fitting by Gaussian-like bands of electronic excitation energies
estimated in the framework of time-dependent Density Functional
Theory (TDDFT). Although the resulting CIE1931 chromaticity
coordinates were quite far from physiologically perceived color by
a human observer it was an innovative and valuable line of
research. Although DFT is a theory of the ground stationary
state,5
excited states may be treated by the complementary
time dependent (TD-DFT) theory.6,7
The effectiveness of time-
dependent density functional theory is widely recognized in
description of electronic excitations, response properties, and
Fig. 1 The visual part of the UV-VIS absorption spectrum of the
standard D65 illuminant (6500 K) overlaid on three color matching
functions representing CIE 1931 21 Standard Observer. Additionally,
the transmittance of 0.33 mM alizarin in methanol solution is provided
as dotted line (AZ).
a
Department of Physical Chemistry, Collegium Medicum, Nicolaus
Copernicus University, Kurpin´skiego 5, 85-950 Bydgoszcz, Poland.
E-mail: chemfiz@cm.umk.pl; Tel: +48 052 585 36 14
b
Department of General Chemistry, University of Technology and
Life Sciences in Bydgoszcz, Seminaryjna 3, 85-326 Bydgoszcz,
Poland. E-mail: szyjczuk@utp.edu.pl; Tel: +48 052 374 90 78
w Electronic supplementary information (ESI) available. See DOI:
10.1039/c2nj40327g
NJC Dynamic Article Links
www.rsc.org/njc PAPER
This journal is c The Royal Society of Chemistry and the Centre National de la Recherche Scientifique 2012 New J. Chem., 2012, 36, 1836–1843 1837
transport in molecules and in bulk, because it is an effective
approach.8,9
This success is due to relatively modest computa-
tional cost of TD-DFT, since it scales the number of molecular
orbitals to the fourth power, calculates the frequency dependence
of a time-evolution of electric field, excitation energies as well
as transition probabilities of theirselves are obtained without
explicitly calculating the excited states.10
Although TD-DFT is
still too expensive for larger molecular or nano-scaled systems,
it is quite feasible for medium sized molecules possessing up to
100 atoms of second row elements, such as dyes.11,12
There is a
wide variety of density functionals developed by different
authors. Among them the most commonly used are Becke3–Lee–
Yang–Parr hybrid functional (B3LYP)13
and the parameter-free
Perdew–Burke–Enzerhof hybrid functional (abbreviated as
PBE0 or PBE1PBE).14
It is evident that the choice of the
exchange–correlation functional form is crucial for resulting
predictions. For example, it is known that the local density
approximation (LDA) has a tendency of underestimating the
values of excitation energies for the majority of organic mole-
cules. In contrast, the UV-VIS absorption spectra are typically
predicted with better accuracy with utilization of the generalized
gradient approximations (GGAs) or with meta-GGA approaches.
Explicit inclusion of a fraction of HF exchange provides the most
accurate model for spectra prediction. On the other hand, it is now
accepted that the vertical TD-DFT model providing structureless
bands becomes inadequate for multipeak bands with broad
vibronic contributions.15,16
For example,16
it was demonstrated
that the inclusion of vibronic contributions to theoretical spectra
of quinodic dyes can significantly improve the predicted color.
Also vibrationally resolved emission spectra were the source of
acceptable prediction of the emission color of some phospho-
rescent iridium(III) complexes for OLEDs.17
The spectacular
dependence of predicted color16
on protocol of computations
reminds that prediction of this particular feature of material is
still a significant challenge for theoreticians. Nevertheless, this
paper intends to further explore the correspondence between
the color perceived by the human eye and chemical structure.
Anthraquinones are a group of commonly known natural
compounds, the name of which comes from 9,10-anthra-
quinone, an organic compound with three fused aromatic rings
and two keto groups located on the central ring. This class of
compounds has wide applications not only as dyes,18
but also in
medicine as drugs19
and antineoplastic agents20
as well as analytical
reagents and indicators.21,22
Among different derivatives of anthra-
quinones, the dihydroxy derivatives are of particular interest as
coloring pigments,23
because of their antimicrobial, cytotoxic and
antiviral properties,24,25
as well as their usage as photosensitizers for
photo-dynamical anti-tumor therapy.26–28
Dihydroxy-anthraqui-
nones are also used as colorimetric indicators for metal ions29–31
and enzyme activity.32
One of the most popular and widely
used compounds of this group is alizarin (1,2-dihydroxy-9,10-
anthraquinone), which was historically extracted from madder
plant (Rubia tinctorum L.).33
Originally, it was adopted as a
natural pigment for coloring textile but since then many
new features of AZ have been discovered and the fields of
its application became much wider. Alizarin experiences an
antigenotoxic activity34
and is one of the components of an anti-
tumor drug, adriamycin.35,36
The coloring properties of alizarin are
still used not only in dye-related industry but also for artwork
restoring,37
as well as in metal detection38
and solar energy
transformation.39
The complexing ability of AZ is also of significant
importance and it is utilized in many analytical applications like
human blood serum analysis,40
determination of metal cations41
or
water hardness measurements.42
The importance of anthraquinones
as a general group of compounds and alizarin as their specific
representative, can be inferred from the large number of publica-
tions related to this topic and in the wide range of research that
have been conducted before and are being conducted nowadays. A
particularly interesting field of exploration is the determination of
absorption spectra of alizarin and its tautomeric forms under
different conditions. In particular, Ferreiro and Rodriguez-Otero43
studied the intramolecular proton transfer with the use of Hartree–
Fock ab initio methods and determined the possible tautomeric
forms of different dihydroxyanthraquinones. The later studies of
Das,25
Fain et al.44,45
as well as Duncan and Prezhdo46
were an
important step in the process of determination of the absorption
spectrum of alizarin in its neutral and anionic forms. The Time
Dependent Density Functional Theory (TD-DFT) was used in
order to predict the absorption spectra of dihydroxyanthraqui-
nones,47
and to evaluate the tautomeric effects on the absorption
spectra of neutral and anionic forms of dihydroxyanthraqui-
nones.48,49
The solvatochromic effect was also studied for alizarin
and other dihydroxyanthraquinones.50,51
It is now commonly
recognized that alizarin exists in three different forms, namely the
protonated form and two deprotonated forms corresponding to
the monoanion and the dianion.35,45,49
In acidic solutions alizarin
shows an absorption maximum of around 430 nm28,49,51,52
and
with pH increase the absorption band is shifted to higher wave-
lengths, which are characteristic of deprotonated forms.35,49
The
band with the maximum of around 550 nm corresponds to the
monoanionic form, while the dianionic form is represented by two
peaks in the range from 570 nm to 620 nm.31,48
The complexation
of different metal ions by alizarin was also broadly studied both
experimentally and by means of quantum chemistry calcula-
tions. A wide spectrum of metal ions was used in these studies,
including such important ones like Al(III),52
Mg(II), Cu(II),
Ca(II), Cu(II)53
, Fe(III)53
and rare-earth metal ions.54
Methods
Measurement of the alizarin spectrum
Methanol (analytical grade) from POCH (Poland) and alizarin
from Sigma-Aldrich (USA) were used without further purifi-
cation procedures. Electronic absorption spectra of alizarin
in methanolic solution were recorded using a single-beam
UV/VIS spectrophotometer (Merck, Spectroquant Pharo 300)
with a wavelength resolution of 1 nm. A solvent blank was
measured before each recorded spectrum. All measurements
were performed at ambient temperature in standard quartz
cuvettes of 1 cm optical path. The recorded spectra of six
methanol solutions of alizarin are presented in Fig. 2.
Deconvolution of the visible spectrum
The absorption profiles of the UV-VIS spectrum can be
decomposed based on a simple additive model of Gaussian-
like bands. The automatic fitting procedures have been already
tested for a broad range of dyes of industrial importance.55
1838 New J. Chem., 2012, 36, 1836–1843 This journal is c The Royal Society of Chemistry and the Centre National de la Recherche Scientifique 2012
Usually this shape is sufficiently accurate for spectroscopic
bands with inhomogeneous line broadening as they occur in
charge-transfer absorption of large polyatomic molecules in
solution. The deconvolution procedure was performed using
Origin 8.0 software,56
which can decompose the spectrum into
n-number of formal bands characterized by their position,
ei,max (excitation energy, obviously related to wavelength
li,max), the oscillator strength, fi, and half-bandwidths, si, of
the i-th transition.57
The absorption, as a function of excitation
energy, is then represented by the following formula:
AðeÞ ¼ AoðeÞ þ
Xn
i¼1
2
ffiffiffiffiffiffiffiffiffiffiffiffiffi
ln 2=p
p fi
si
exp
À4 ln 2ðei;max À eÞ2
s2
i
!
ð1Þ
where Ao(e) is just the baseline of the spectrum. In the simplest
case of single band approximation (SBA) n = 1 and only one
(dominant) excitation energy, emax, is to be considered. In fact,
this is valid for alizarin in methanol solution studied here,
since its optical activity is limited only to but one p - p*
excitation. The experimental spectrum is the source of impor-
tant parameters describing the band profile. First of all, the
integrated absorption coefficient (IAC) can be extracted.58
This
extinction coefficient is defined in terms of the optical density,
IAC =
R
e dn, where n denotes the wave number. The IAC
can be computed as the area under optical density (expressed
in terms of dm3
molÀ1
cmÀ1
) as a function of the wave
number.57,59
Obviously, due to well known relationships60
this
directly leads to the oscillator strength:
f = 4.31968 Â 10À9
R
e dn (2)
This dimensionless spectral quantity is one of the forms of
expression of the allowedness of a transition. In principle, it
denotes the number of electrons undergoing particular transi-
tion. Typically, its values lie between zero (non allowed
transitions) and one (highly intense transitions). Based on
the experimental spectrum of alizarin, the p - p* transition
found at 431.6 nm (mean of values provided in Fig. 2) is
mostly responsible for yellow color as shown in Fig. 2. For this
band, the experimental value of IAC was found to be equal to
2.47 Â 107
dm3
molÀ1
cmÀ1
and the corresponding oscillator
strength estimated for analysed series of alizarin concentra-
tions is also presented in Fig. 2. The mean value of the
oscillator strength is equal to 0.107, suggesting that alizarin
exhibits rather modest absorption in the visible part of the
spectrum. Although the Lambert–Beer law is obeyed for
analysed AZ solutions, a red-shift of about 10 nm associated
with the applied dilution is observed. Also, the broadening of
the peak is to be noticed as a consequence of an increase in
experimental values of half-bandwidth. These data result from
the deconvolution of the experimental spectra according to
eqn (1). On the other hand, contemporary quantum chemical
computations, especially relying on the TD-DFT approach,
allow for theoretical estimation of molecules readiness for
electron transition. It is well known that the transition moment
integral D =
R
CumC1 dt, between upper (Cu) and lower (Cl)
states, represented by corresponding wave functions, is related
to the intensity of the spectral peak. Here, m is the dipole
moment operator of the system. Assuming the definite spin
states and the Born–Oppenheimer approximation, the assess-
ment of the oscillator strength is quite straightforward. This
theoretical value, along with predicted energy of the electron
transition, can be directly compared to experimental data,
which can be used for quantitative verification of the quality
of theoretical predictions. However, instead of a direct comparison
of experimental and estimated values of oscillator strength or the
wavelength defining maximum peak position, as it is commonly
done in the literature,61,62
we adopted here a more straightforward
and intuitive way with direct practical implications. Namely, based
on different density functionals available in Gaussian0963
package
and different protocols of computations, the spectrum profiles
were generated and resulting color was estimated according to
CIE 1931 21 standard. The color difference with respect to
experimental one is computed based on an Euclidean distance
from points on the CIE Lab scale:
DE ¼
ffiffiffiffiffiffiffiffiffiffiffiffiffiffiffiffiffiffiffiffiffiffiffiffiffiffiffiffiffiffiffiffiffiffiffiffiffiffiffiffiffiffiffiffiffiffiffiffiffiffiffiffiffiffiffiffiffiffiffiffiffiffiffiffiffiffiffiffiffiffiffiffiffiffiffiffiffiffiffiffiffiffiffiffiffiffiffiffiffiffiffiffiffiffiffiffiffiffiffi
ðLexp À LSBAÞ2
þ ðaexp À aSBAÞ2
þ ðbexp À bSBAÞ2
q
ð3Þ
This formula can relate objective color change to subjective
perception. It is assumed that the standard observer can see
the color difference if DE 4 5.64
Thus, the values of electron
transition energies and oscillator strengths taken from TD
DFT computations were used for convolution of the theoretical
spectrum (eqn (1)). Then, they were fitted to experimental data
corresponding to six different AZ concentrations in methanol
simply by a scaling factor. The fitted spectra were then compared
to experimental one based on eqn (3) and the mean value was used
for quantitative assessment of the given theoretical protocol.
TD-DFT first principle computations
In this study a broad range of functionals was used in the aim
of finding the most suitable one with respect to color prediction.
Since accuracy of both maximum absorption wavelength and
oscillator strength affects the shape of the spectrum band only
one parameter, DE, estimated based on eqn (3) can be used for
this purpose. The list of applied density functionals is provided
in in Table S1 (ESIw).
Fig. 2 Measured spectra of alizarin (AZ) in methanol for six different
dilutions provided in the legend as negative logarithms of concentration
(pCAZ = ÀlogCAZ). The CIE diagram represents color changes
imposed by successive dilution along with the corresponding values of
oscillator strength, lmax, and half-bandwidth, o.
This journal is c The Royal Society of Chemistry and the Centre National de la Recherche Scientifique 2012 New J. Chem., 2012, 36, 1836–1843 1839
Solvation model
It is well known that electronic spectra depend strongly on the
solvent used. Alizarin exhibits significant solvatochromic effects
in the presence of different binary and neat solvents.65
There are
many solvation models and probably the most popular one is
the self-consistent reaction field (SCRF) with the polarised
continuum model (PCM) of solvation.66,67
In this paper PCM
with Bondi-type atomic radii parameterization was applied to
both geometry optimization and TD-DFT calculation steps.
Results and discussion
Before the actual prediction of alizarin color some comments
are provided on the accuracy of single band approximation
(SBA). It is interesting to know, how sensitive is the color
prediction on the variation of parameters defining single
Gaussian-like band in the visible region of the light spectrum.
Then results of color computation for alizarin in methanol are
presented and discussed.
SBA model parameter analysis
The aim of this section is to explore which parameters of the
SBA model are crucial for color prediction and stand for the
main source of changes of color parameters. For this purpose
an absorption spectrum was mimicked by the normalised
Gaussian-like band with varying parameters. Theoretical
prediction of the electronic spectrum via quantum chemistry
computations encounters two types of errors, namely the
discrepancy (Dl) between predicted and computed lmax values
and oscillator strength (f). The third parameter used in eqn (1),
s half bandwidth, is available only after full vibronic spectra
estimation using the Franck–Condon principle.68,69
This is
however extremely time consuming and accuracy is still quite
unsatisfactory.15
Hence, s is typically taken directly from
experimental data as an empirical parameter. It is worth
mentioning that different bands can be characterised by
different s values, which are also prone to changes due to
dilution of analysed solutions. It is then also interesting to
know how a misfortunate selection of this value can affect
predicted color. In the following analysis the oscillator
strength is not taken into account due to normalisation of
model spectra and consequently fixing it to s2
ffiffiffiffiffiffiffiffiffiffiffiffiffi
ln 2=p
p
value.
The influence of the modelled errors of lmax and s on CIE Lab
values is presented in Fig. 3 and additionally, in more detail, in
ESIw (see Fig. S1). Due to intrinsic features of color-matching
functions different regions of the optical spectrum are differ-
ently affected by analysed alterations of lmax and s values.
When considering the lmax at 430 nm (corresponding to a
yellow dye) it is clear that the shifting of band localization does
not introduce dramatic change in the color. Although there is
a quite substantial change in DE values, they are associated
mainly to alteration of brightness rather than shifting along
red–green or yellow–blue axes. Although s-dependent color
change is observed, only tint is to be affected without substantial
color modification. The higher the s values are, the more
significant the color change is to be expected. Interestingly, there
is an unsymmetrical influence of Dl on DE values and over-
estimation of lmax leads to higher color change. The increase in
Dl error causes the shifting along the red–green axis changing
the predicted color slightly to reddish. This behavior occurs
independently of the sign of the Dl error. The b parameter
behaves in a similar way, and in this case the increase in the Dl
error causes a shift from ‘‘blue’’ values to more ‘‘yellow’’ ones.
Again, it is not important if the error value is negative or
positive. The half bandwidth also influences the a and b CIE
Lab values, i.e. the increase in its value induces a shift of the a
parameter towards the green color and the b parameter
towards the yellow color. These are important observations,
enabling a more efficient selection of computational protocol
for theoretical prediction of optical spectra. For a precise
prediction of the color that does not affect the impression of
tint perception (DE o 5.0), a high accuracy of Dl is expected
(about Æ5 nm). This accuracy is achievable by contemporary
TD-DFT methodology. In the case of lmax equal to 550 nm
(corresponding to a red dye) the influence of the parameter changes
on resulting color has analogical nature as described above, but
change of sign in both a and b parameters can lead to more
pronounced color change. The increase in Dl values results in an
increase in a parameter values and decrease in b parameter values.
Fig. 3 The color dependence on the two parameters of the SBA model, namely Dl = error in lmax = 430 nm and s half-bandwidth expressed as
variations in CIEa and CIEb parameters as well as associated color change DE. The normalization condition fixes the values of the oscillator
strength to f ¼ s2
ffiffiffiffiffiffiffiffiffiffiffiffiffi
ln 2=p
p
.
1840 New J. Chem., 2012, 36, 1836–1843 This journal is c The Royal Society of Chemistry and the Centre National de la Recherche Scientifique 2012
Thus, one can anticipate that proper prediction of color from
first principle simulations will be much more difficult for red
dyes than that for yellow ones. Turning attention to blue dyes,
one can consider two wavelengths lmax equal to 600 nm and
650 nm. The a parameter values shift towards those corres-
ponding to a more greener color on the green–red axis when
Dl increases. A shift towards yellow color is observed for the b
parameter values while passing from negative to positive Dl
error values. Increase in half bandwidth results in the decrease
in all the CIELab index values: a (shift towards green) and b
(shift towards blue). It is then expected that prediction from
first principle of color of blue dyes will require a similar
accuracy as yellow ones. Bearing in mind the above analysis,
one can conclude that the most sensitive to model band
parameters are supposed to be those dyes whose absorption
band is located in the middle VIS wavelength range (red dyes).
The prediction of extreme colors, either yellow or blue, is
supposed to be less sensitive to computational inaccuracies.
The main contribution to color change as a result of inadequate
prediction of lmax comes from differences of parameter a, since
shifting along the red–green axis is generally much more prone
to alteration of band parameters. Shifting along the yellow–blue
axis occurs with lesser extent since parameter b is much less
sensitive to band parameters
Prediction of color of alizarin by means of first principle
quantum chemistry computations
Alizarin can potentially exist in several tautomeric and rotameric
isomers. Unfortunately, the solubility of alizarin in water is very
low. This fact makes tautomeric equilibrium of alizarin in
aqueous solution difficult to measure by means of electronic
spectroscopy. Nevertheless, there are theoretical studies which
show that, according to Boltzmann distribution in neutral and
monoanionic alizarin populations, tautomeric forms with proton
attached to the carbonyl group do not exist in water solution.70
Although due to the inductive effect of methyl group, methanol
has greater proton affinity than water,71,72
theoretical and experi-
mental pKa values show that substituted phenols are less acidic in
methanol solutions than in aqueous ones.73
This suggests that
OH bond dissociation in the phenolic moiety of alizarin is even
less favourable in methanol than in water solution. Hence,
both O9 and O10 centres are much less acidic when compared
to O1 and O2 ones and proton migration toward quinone
oxygen atoms is extremely unlikely. These intuitions are
also confirmed by quantum chemistry computations and all
possible tautomeric structures of AZ are presented in ESIw (see
Table S2). All tautomers protonated at O9 or O10 centres are
about several kcal molÀ1
less stable than the most abundant
form (I) shown in Fig. 4. Among the rest of the interesting
isomers only three seem to be of potential contribution to
ground state optical properties of alizarin solutions. There
were suggestions by Le Person et al.74
that both 9,10-keto- and
1,10-keto-forms can exist in methanol solution. Although the
former isomer (I) predominates the concentration of latter
(III) is also measurable and observed by these authors.75
The
band around 550 nm is interpreted in terms of electronic
properties of tautomer (III). However, a closer insight into
tautomeric equilibrium suggests that there is only one form of
AZ in the methanol solution defining the ground state. In
Fig. 4 plots of estimated relative stabilities of the two most
stable forms of AZ as a function of basis set expansion used
for geometry optimization and Gibbs free energy computations
are presented. Data presented in Fig. 4 clearly suggest that
among two rotamers of 1,2-dihydroxy form, the isomer stabilized
by two intramolecular hydrogen bonds (I) is energetically more
favourable than the one with only single hydrogen bond inter-
action (II). Interestingly, the presence of population of (II)
reaching about 14% in the ground state and 18% in the excited
state does not affect the optical properties of alizarin since these
two rotamers have almost identical electronic properties. This is
simply related to the fact that rotation of hydroxyl group bound
to C2 centre does not affect the distribution of HOMO density.
Thus, only one rotamer is sufficient for color description of AZ.
Although intramolecular proton transfer from O2 to O9 centres
can potentially alter HOMO distribution and consequently the
optical spectrum, it seems to be rather improbable in the ground
state. As it was well documented in the literature,75,76
this is the
source of observed differences of absorption and emission spectra
and can be attributed to the existence of different isomers in the
excited states than in the ground one. However, taking into
account data provided in Fig. 4, intramolecular proton transfer is
Fig. 4 The relative values of the Gibbs free energy of two alizarin isomers with respect to the most abundant tautomer (I) expressed as a function
of basis set expansion. Along with B3LYP or B97D functionals the following basis sets were used: cc-pvDZ (292), 6-31G(d,p) (310), 6-31++G(d,p)
(444), 6-311++G(2d,2p) (566), 6-311++G(3df,2p) (782), where the number of basis functions constituting the given basis set is provided in the
parenthesis. The percentages on the right panel correspond to tautomers population in the ground state and in the excited state (in parenthesis).
This journal is c The Royal Society of Chemistry and the Centre National de la Recherche Scientifique 2012 New J. Chem., 2012, 36, 1836–1843 1841
rather unlike in methanol solution and the percentage of
tautomer (III) in the whole population does not exceed
0.01% at room temperature for the ground state, while in
the excited state the population is still very small, namely
about 0.3%. This destabilization effect of intramolecular
proton transfer in the ground state is even more pronounced
for richer basis sets and should not be addressed solely to
computational protocol. In our opinion, the interpretation of
the band near 550 nm, which can be seen in methanol solutions
(with very small intensity), should be addressed to the role of
traces of water. Since alizarin can easily dissociate even under
modestly acidic conditions (pH 4 5), the presence of water
molecules can promote dissociation. There is a coincidental
overlapping of excitation energies of the anionic form and
tautomer (III) that might lead to misinterpretation74
of this
band. Thus, for the further analysis only the 1,2-dihydroxy-
9,10-anthraquinone tautomer is taken into account, which is
stabilized by two intramolecular hydrogen bonds. The series of
theoretical predictions of the alizarin visible light spectrum in
methanol solution was performed based on a variety of density
functionals (see Table S1, ESIw). The problem of electronic
spectrum prediction of anthraquinones was addressed exten-
sively in the past mostly by estimation of p - p* transition
energy.47–49,61,62
Here, however, instead of the comparison of
experimental and estimated values of lmax, the color was
expressed in terms of CIELab parameters and was compared
to experimental values. Results of applied different computa-
tional protocols are provided in Fig. 5, where mean DE values
were estimated according to eqn (3). Letters denote the six
computational protocols differing in the level of geometry
optimizations and spectrum prediction within the TD-DFT
approach. Interesting observations can be made based on the
presented data. First of all, the prediction of alizarin color
based on the first principle approach is quite satisfactory and
the most accurate results are obtained with the aid of
HSE2PBE using the 6-31G(d,p) basis set for both optimisation
and spectrum prediction. This Heyd–Scuseria–Ernzerhof hybrid
functional is rarely used for electronic spectra computations.
As it is presented in Fig. 5 this method works significantly
better than B3LYP or PBE0, the two most often used for the
computations in question. The actual correlation between
experimental and theoretical spectra for this particular method
of computations is provided in Fig. 6. There is almost perfect
matching between predicted and measured plots. Consequently,
the color difference between experimental and theoretical CIE
Lab values is as small as 2.5 nm. One can conclude that
application of the TD-DFT method can lead to a very precise
prediction of such a macroscopic parameter as color for dyes
with simple vibronic structure. There are three major factors
leading to such high accuracy. First of all, very high accuracy of
lmax prediction by the HSE03 method was obtained with
precision better than 1 nm. Secondly, the yellow color of AZ
dye and, as it was discussed above, relatively small sensitivity of
the dye to inaccuracies. Finally, simple vibronic structure of the
AZ spectrum for which application of the SBA model is
possible. This is not the case for all yellow dyes. For example
1,4-dihydroxyanthraquinone has quite broad vibronic charac-
teristics disenabling the representation of the spectrum just by
one Gaussian-like function. However, the extension of the
proposed model seems to be possible and will be further
investigated. Alizarin color can also be described by other
functionals, as for example HSE06 and B972, offering quite
promising alternatives. Also, the accuracy of lmax predicted by
the very popular PBE0 method underestimates it only by 7 nm.
This is quite acceptable since DE = 3.5. Many more functionals
directly available in the G09 package were probed and the
obtained results are provided in ESIw (see Table S1). The values
presented in Fig. 5 and Fig. 7 suggest that both lmax and
oscillator strengths are sensitive to functionals used for geometry
optimization and spectrum estimation. In Fig. 5 one can find an
interesting clue for selection of computational protocol. There
are clearly visible two classes of methods resulting in the increase
or decrease in accuracy of color prediction if more extended basis
sets are taken into account. Since the inclusion of polarisation
and/or diffusion functions is usually associated with red-shift of
predicted lmax values, those functionals which underestimate the
Fig. 5 The accuracy of color prediction of alizarin in methanol solution by means of a variety of electron density functionals and computational
procedures. The following notation of the basis functions used for spectrum estimation precedes the basis set used for geometry optimization: A =
6-31G(d,p)//6-31G(d,p), B = 6-31++G(d,p)//6-31G(d,p), C = 6-311+G(d,p)//6-31G(d,p), D = 6-31++G(d,p)//6-31++G(d,p), E =
6-311+G(d,p)//6-311+G(d,p), F = 6-311++G(2d,2p)//6-311++G(2d,2p), G = 6-311++G(3df,2p)//6-311++G(3df,2p). The sequence in the legend
corresponds to increasing values of color change.
1842 New J. Chem., 2012, 36, 1836–1843 This journal is c The Royal Society of Chemistry and the Centre National de la Recherche Scientifique 2012
excitation energy usually perform better for smaller basis sets.
Thus, it makes sense to extend the basis sets only for such
functionals, which underestimate lmax values for there is a
chance that the resulting red-shift reduces the Dlmax error.
This conclusion is quite consistent for all studied functionals.
The acceptable geometries and electronic properties obtained
based on quite poor basis sets such as 6-31G(d,p) was noticed
by other authors11,15,47,61
and addressed as typical for anthra-
quinones. Extension of the basis set can lead to gaining
accuracy only for extremely large expansions. However, the
obtained improvement is not worth of concurrent costs of
computations. It is also worth noting that a misfortunate
selection of the basis set can lead to a quite poor colordescription,
as it is demonstrated by procedures B–E. Thus, the modest level
of computations, if used with proper functional, both for
geometry optimization and TD-DFT spectrum prediction seems
to be the best solution.
Conclusions
Deconvolution of the whole visible spectrum of a dye just by
single Gaussian-like band can be sufficient for adequate color
prediction in the CIEXYZ or CIELab frameworks. The
accuracy of color prediction based on such single band
approximation has been found to be strongly dependent on
the absorption maximum wavelength and half-bandwidth.
Both yellow and blue dyes can be modelled quite accurately,
whereas red ones seem to be more sensitive to any variation of
the spectrum shape. The applied simple model relying on the
convolution of the spectrum, assuming Gaussian-like shapes
of the band, seems to be quite successful in color prediction
from first principle quantum chemistry computations. However,
accuracy strongly depends on the method used, both for geometry
optimization and spectrum computation. As an example, alizarin
was chosen and its color measured in methanol solution was
predicted by a variety of DFT functionals. Presented results
suggest that in the case of AZ the most accurate color prediction
can be obtained by means of the HSE03 method. Also, other
functionals can lead to a precise color estimation within the
required threshold of DE = 5.0.
It is worth mentioning that much more popular functional,
such as PBE0, B3LYP or CAM-B3LYP, used for TDDFT
calculations of dyes, usually perform much better than an
inverted range-separated hybrid functional such as HSE. This
observation is based on comparison of experimental and
theoretical wavelength of maximum absorption. Especially
effective, in the sense of agreement between theory and experi-
ment, was found to be the combination of two functionals, PB0
along with B3LYP.77,78
Our results are in line with these
observations since these two functionals belong to the class of
11 DFT methods giving DE values very close to the color
differentiation limiting value for a standard observer. This
suggests that such commonly used functionals may be
adequate for color prediction. The basis set expansion is also
important for both optimization and spectrum estimation via
the TD-DFT framework. Interestingly, modest basis set proved
to be sufficiently accurate at least for alizarin and the extension
of the basis set is not recommended. The presented results can
be readily applied both for color prediction of new substances
as well as for verification of computational protocols best suited
for particular groups of compounds. Besides, the provided
analysis enhances the intuition of required accuracy for prediction
of lmax values relating it quantitatively to color measures.
Notes and references
1 C. H. Graham, Vision and visual perception, Wiley, New York, 1965.
2 CIE. Commission Internationale de l’Eclairage Proceedings,1931,
Cambridge University Press, Cambridge, UK, 1932.
3 T. Smith and J. Guild, Trans. Opt. Soc., London, 1931, 33, 73.
4 M. E. Beck, Int. J. Quantum Chem., 2005, 101, 683.
5 W. Kohn and L. J. Sham, Phys. Rev. A: At., Mol., Opt. Phys.,
1965, 140, 1133.
6 R. G. Parr and W. Yang, Density-Functional Theory of Atoms and
Molecules, Oxford University Press, New York, 1989.
7 W. Koch and M. C. Holthausen, A chemist’s guide to density
functional theory, Wiley-VCH, Weinheim, 2000.
8 M. E. Casida, Recent advances in density functional methods, World
Scientific, Singapore, 1995.
9 C. A. Marques, M. A. L. Ullrich, F. Nogueira, A. Rubio, K. Burke
and E. K. U. Gross, Time-dependent density functional theory,
Springer, 2006.
10 S. J. A. Van Gisbergen, C. F. Guerra and E. J. Baerends,
J. Comput. Chem., 2000, 21, 1511.
11 D. Jacquemin, E. A. Perpe` te, I. Ciofini and C. Adamo, Acc. Chem.
Res., 2009, 42, 326.
12 J. Fabian, Dyes Pigm., 2010, 84, 36.
13 A. D. Becke, J. Chem. Phys., 1993, 98, 5648.
14 C. Adamo and V. Barone, J. Chem. Phys., 1999, 110, 6158.
Fig. 6 The comparison of experimental (solid lines with black circles)
and theoretical (dotted lines) spectra convoluted based on eqn (1)
using values lmax and oscillator strength predicted by HSE2PBE
functional at the 6-31G(d,p)//6-31G(d,p) level.
Fig. 7 Interpretation of the visible region of the AZ electronic spectrum
predicted by different DFT methods at the 6-31G(d,p)//6-31G(d,p) level.
HOMO and LUMO densities are estimated based on HSE2PBE
functional.
This journal is c The Royal Society of Chemistry and the Centre National de la Recherche Scientifique 2012 New J. Chem., 2012, 36, 1836–1843 1843
15 D. Jacquemin, E. Bre´ mond, A. Planchat, I. Ciofini and C. Adamo,
J. Chem. Theory Comput., 2011, 7, 1882.
16 D. Jacquemin, E. Bre´ mond, I. Ciofini and C. Adamo, J. Phys.
Chem. Lett., 2012, 3, 468.
17 F. De Angelis, F. Sanoto, M. K. Nazeruddon and V. Barone,
J. Phys. Chem. B, 2008, 112, 13181.
18 L. G. Angelini, L. Pistelli, P. Belloni, A. Bertoli and S. Panconesi,
Ind. Crops Prod., 1997, 6, 303.
19 P. Ba´ nyai, N. Kuzovkina, L. Kursinszki and E´ . Szo¨ ke, Chromato-
graphia, 2006, 63, 111.
20 Q. Huang, G. Lu, H.-M. Shen, M. C. M. Chung and C. N. Ong,
Interscience, 2006, 609.
21 M. V. Canamares, J. V. G. Ramos, C. Domingo and S. S. Cortes,
J. Raman Spectrosc., 2006, 35, 921.
22 S. M. Mascaros, C. Domingo, S. S. Cortes, M. V. Canamares and
J. V. G. Ramos, J. Raman Spectrosc., 2005, 36, 420.
23 R. H. Thomson, Naturally Occurring Quinones III. Recent Advances,
Chapman and Hall, London, 1986.
24 W. A. Remers, The Chemistry of Antitumour Antibiotics, Wiley,
New York, 1981.
25 R. H. Thomson, Naturally Occuring Quinones, Chapman and Hall,
London, 3rd edn, 1981.
26 J. R. Choi, S. C. Jeoung and D. W. Cho, Chem. Phys. Lett., 2004,
385, 384.
27 T. D. Giacco, L. Latterini and F. Elisei, Photochem. Photobiol. Sci.,
2003, 2, 681.
28 C. Milliani, A. Romani and G. Favaro, J. Phys. Org. Chem., 2000,
13, 141.
29 S. Das, A. Saha and P. C. Mandal, Talanta, 1996, 43, 95.
30 L. Quinti, N. Allen, M. Edge, B. Murphy and A. Perotti,
J. Photochem. Photobiol., A, 2003, 155, 79.
31 L. Quinti, N. Allen, M. Edge, B. Murphy and A. Perotti,
J. Photochem. Photobiol., A, 2003, 155, 93.
32 Y.-G. Son, Ch.-H. Lee, J.-S. Seo, B.-J. Park and J.-M. Kim, Bull.
Korean Chem. Soc., 2005, 26, 1560.
33 C. Ahn and S. K. Obendorf, Text. Res. J., 2004, 74, 949.
34 M. V. Canamares, J. V. G. Ramos, C. Domingo and S. S. Cortes,
J. Raman Spectrosc., 2006, 35, 921.
35 S. Das, A. Bhattacharya, P. C. Mandal, M. C. Rath and
T. Mukherjee, Radiat. Phys. Chem., 2002, 65, 93.
36 H. M. Berman and P. R. Young, Annu. Rev. Biophys. Bioeng.,
1981, 10, 87.
37 S. Murcia-Mascaro´ s, C. Domingo, S. Sanchez-Cortes, M. V.
Can˜ amares and J. V. Garcia-Ramos, J. Raman Spectrosc., 2005, 36, 420.
38 V. Y. Fain, B. E. Zaitsev and M. A. Ryabov, Russ. J. Coord.
Chem., 2004, 30, 365.
39 R. Sa´ nchez-de-Armas, J. Oviedo Lo´ pez, M. A. San-Miguel,
J. F. Sanz, P. Ordejo´ n and M. Pruneda, J. Chem. Theory Comput.,
2010, 6, 2856.
40 F. Ge, L. Jiang, D. Liu and C.h. Chen, Anal. Sci., 2011, 27, 79.
41 A. Downard, H. Powell, J. Kipton and S. Xu, Anal. Chim. Acta,
1991, 251, 157.
42 M. E. Khalifa, Chem. Anal. (Warsaw), 1996, 41, 357.
43 M. Ferreiro and J. Rodriguez-Otero, J. Mol. Struct. (Theochem),
2001, 542, 63.
44 V. Fain, B. Zaitsev and M. Ryabov, Russ. J. Coord. Chem., 2004,
30, 365.
45 V. Fain, B. Zaitsev and M. Ryabov, Russ. J. Gen. Chem., 2004, 74, 1558.
46 W. Duncan and V. Prezhdo, J. Phys. Chem. B, 2005, 109, 365.
47 D. Jacquemin, V. Wathelet, J. Pre´ at and E. Perpe` te, Spectrochim.
Acta, Part A, 2007, 67, 334.
48 M. Savko, S. Kasackova, P. Gbur, P. Miskovsky and J. Ulicny,
J. Mol. Struct. (Theochem), 2007, 823, 78.
49 J. Pre´ at, A. Laurent, C. Michaux, E. Perpe` te and D. Jacquemin,
J. Mol. Struct. (Theochem), 2009, 901, 24.
50 M. Reta, J. Anunziata, R. Cattana and J. Silber, Anal. Chim. Acta,
1995, 306, 81.
51 V. Sasirekha, M. Umadevi and V. Ramakrishnan, Spectrochim.
Acta, Part A, 2008, 69, 148.
52 S. Say-Liang-Fat and J. P. Cornard, Polyhedron, 2011, 30, 2326.
53 M. Doskocz, K. Kubas, A. Fra˛ckowiak and R. Gancarz, Polyhedron,
2009, 28, 2201.
54 N. Komiha, O. K. Kabbaj and M. Charibi, J. Mol. Chem., 2002,
594, 135.
55 E. Bremond, J. Kieffer and C. Adamo, J. Mol. Struct. (Theochem),
2010, 954, 52.
56 Origin ver. 8.0, OriginLab, Northampton, MA.
57 J. M. Hollas, High resolution spectroscopy, Butternorth, 1982.
58 J. E. Sturm, J. Chem. Educ., 1990, 67, 32.
59 J. E. Sturm, J. Chem. Educ., 1992, 69, 686.
60 G. M. Barrow, Introduction to molecular spectroscopy, McGraw Hill,
1962.
61 D. Jacquemin, X. Assfeld, J. Pre´ at and E. A. Perpe` te, Mol. Phys.,
2007, 105, 325.
62 G. Fayet, D. Jacquemin, V. Wathelet, E. A. Perpe` te, P. Rotureau
and C. Adamo, J. Mol. Graphics Modell., 2010, 28, 465.
63 M. J. Frisch, G. W. Trucks, H. B. Schlegel, G. E. Scuseria,
M. A. Robb, J. R. Cheeseman, G. Scalmani, V. Barone,
B. Mennucci, G. A. Petersson, H. Nakatsuji, M. Caricato, X. Li,
H. P. Hratchian, A. F. Izmaylov, J. Bloino, G. Zheng,
J. L. Sonnenberg, M. Hada, M. Ehara, K. Toyota, R. Fukuda,
J. Hasegawa, M. Ishida, T. Nakajima, Y. Honda, O. Kitao,
H. Nakai, T. Vreven, J. A. Montgomery, Jr., J. E. Peralta,
F. Ogliaro, M. Bearpark, J. J. Heyd, E. Brothers, K. N. Kudin,
V. N. Staroverov, R. Kobayashi, J. Normand, K. Raghavachari,
A. Rendell, J. C. Burant, S. S. Iyengar, J. Tomasi, M. Cossi,
N. Rega, J. M. Millam, M. Klene, J. E. Knox, J. B. Cross,
V. Bakken, C. Adamo, J. Jaramillo, R. Gomperts,
R. E. Stratmann, O. Yazyev, A. J. Austin, R. Cammi,
C. Pomelli, J. W. Ochterski, R. L. Martin, K. Morokuma,
V. G. Zakrzewski, G. A. Voth, P. Salvador, J. J. Dannenberg,
S. Dapprich, A. D. Daniels, O. Farkas, J. B. Foresman, J. V. Ortiz,
J. Cioslowski and D. J. Fox, Gaussian 09, Revision A.01, Gaussian,
Inc., Wallingford, CT, 2009.
64 A. K. Jain, Fundamentals of Digital Image Processing, Prentice Hall,
New Jersey, 1989.
65 V. Sasirekha, M. Umadevi and V. Ramakrishnan, Spectrochim.
Acta, Part A, 2008, 69, 148.
66 S. Miertusˇ , E. Scrocco and J. Tomasi, Chem. Phys., 1981, 55, 117.
67 S. Miertusˇ and J. Tomasi, Chem. Phys., 1982, 65, 239.
68 J. Franck, Trans. Faraday Soc., 1926, 21, 536.
69 E. Condon, Phys. Rev., 1928, 32, 858.
70 J. Pre´ at, A. D. Laurent, C. Michaux, E. A. Perpe` te and
D. Jacquemin, J. Mol. Struct. (Theochem), 2009, 901, 24.
71 K. Suhara, A. Fujii, K. Mizuse, N. Mikami and J.-L. Kuo,
J. Chem. Phys., 2007, 126, 194306.
72 P. Kebarle, R. M. Haynes and J. G. Collins, J. Am. Chem. Soc.,
1967, 89, 5753.
73 K. Roy and P. L. A. Popelier, J. Phys. Org. Chem., 2009, 22, 186.
74 A. Le Person, J.-P. Cornard and S. Say-Liang-Fat, Chem. Phys.
Lett., 2011, 517, 41.
75 P. Purkayastha and N. Chattopadhyay, Phys. Chem. Chem. Phys.,
2000, 2, 203.
76 T. K. DabsuTautomersim and Spectral Properties of Alizarin
(1,2-Dihydroxyanthracene-9, 10-Dione), Thesis, Addis Ababa
University, 2007.
77 D. Jacquemin, J. Pre´ at, V. Wathelet, J. M. Andre` and
E. A. Perpe` te, Chem. Phys. Lett., 2005, 405, 429.
78 E. A. Perpe` te, V. Wathelet, J. Pre´ at, C. Lamber and D. Jacquemin,
J. Chem. Theory Comput., 2006, 2, 434.

More Related Content

What's hot

Exploiting tertiary structure through local folds for crystallographic phasing
Exploiting tertiary structure through local folds for crystallographic phasingExploiting tertiary structure through local folds for crystallographic phasing
Exploiting tertiary structure through local folds for crystallographic phasingxrbiotech
 
Application of UV-Visible spectroscopy
Application of UV-Visible spectroscopyApplication of UV-Visible spectroscopy
Application of UV-Visible spectroscopyROHIT
 
LCGC0615-wyatt-ebook-advancing-biopharma-analysis-with-light-scattering
LCGC0615-wyatt-ebook-advancing-biopharma-analysis-with-light-scatteringLCGC0615-wyatt-ebook-advancing-biopharma-analysis-with-light-scattering
LCGC0615-wyatt-ebook-advancing-biopharma-analysis-with-light-scatteringChristian Denisse
 
Oxidative Coupling: A Tranquil Approach for Determination of Selexipag by Vis...
Oxidative Coupling: A Tranquil Approach for Determination of Selexipag by Vis...Oxidative Coupling: A Tranquil Approach for Determination of Selexipag by Vis...
Oxidative Coupling: A Tranquil Approach for Determination of Selexipag by Vis...Ratnakaram Venkata Nadh
 

What's hot (6)

273a318
273a318273a318
273a318
 
Exploiting tertiary structure through local folds for crystallographic phasing
Exploiting tertiary structure through local folds for crystallographic phasingExploiting tertiary structure through local folds for crystallographic phasing
Exploiting tertiary structure through local folds for crystallographic phasing
 
G0444246
G0444246G0444246
G0444246
 
Application of UV-Visible spectroscopy
Application of UV-Visible spectroscopyApplication of UV-Visible spectroscopy
Application of UV-Visible spectroscopy
 
LCGC0615-wyatt-ebook-advancing-biopharma-analysis-with-light-scattering
LCGC0615-wyatt-ebook-advancing-biopharma-analysis-with-light-scatteringLCGC0615-wyatt-ebook-advancing-biopharma-analysis-with-light-scattering
LCGC0615-wyatt-ebook-advancing-biopharma-analysis-with-light-scattering
 
Oxidative Coupling: A Tranquil Approach for Determination of Selexipag by Vis...
Oxidative Coupling: A Tranquil Approach for Determination of Selexipag by Vis...Oxidative Coupling: A Tranquil Approach for Determination of Selexipag by Vis...
Oxidative Coupling: A Tranquil Approach for Determination of Selexipag by Vis...
 

Similar to Color prediction from first principle quantum chemistry computations: a case of alizarin dissolved in methanol

Analysis Of Steroids
Analysis Of SteroidsAnalysis Of Steroids
Analysis Of SteroidsJackie Taylor
 
Dye Sensitized Solar Cells- PhD Stage 3 Seminar
Dye Sensitized Solar Cells- PhD Stage 3 SeminarDye Sensitized Solar Cells- PhD Stage 3 Seminar
Dye Sensitized Solar Cells- PhD Stage 3 SeminarNarges Mohamadi
 
Radiolytic Modification of Basic Amino Acid Residues in Peptides : Probes for...
Radiolytic Modification of Basic Amino Acid Residues in Peptides : Probes for...Radiolytic Modification of Basic Amino Acid Residues in Peptides : Probes for...
Radiolytic Modification of Basic Amino Acid Residues in Peptides : Probes for...Keiji Takamoto
 
Laser Ablation Molecular Isotopic Spectrometry for rare isotopes of the light...
Laser Ablation Molecular Isotopic Spectrometry for rare isotopes of the light...Laser Ablation Molecular Isotopic Spectrometry for rare isotopes of the light...
Laser Ablation Molecular Isotopic Spectrometry for rare isotopes of the light...Alexander Bolshakov
 
An Assignment Walk Through 3D NMR Spectrum
An Assignment Walk Through 3D NMR SpectrumAn Assignment Walk Through 3D NMR Spectrum
An Assignment Walk Through 3D NMR SpectrumNicole Heredia
 
BODA-2015-BT1A.6
BODA-2015-BT1A.6BODA-2015-BT1A.6
BODA-2015-BT1A.6Gen Vigil
 
Applications of mass spectrometry.seminar.pptx
Applications of mass spectrometry.seminar.pptxApplications of mass spectrometry.seminar.pptx
Applications of mass spectrometry.seminar.pptxAsif Shaikh
 
Mass Spectrometry Applications and spectral interpretation: Basics
Mass Spectrometry Applications and spectral interpretation: BasicsMass Spectrometry Applications and spectral interpretation: Basics
Mass Spectrometry Applications and spectral interpretation: BasicsShreekant Deshpande
 
Analical chemistry ok1294986152
Analical chemistry  ok1294986152Analical chemistry  ok1294986152
Analical chemistry ok1294986152Navin Joshi
 
Structural characterization of chloride salt of conducting pani by xrd, saxd,...
Structural characterization of chloride salt of conducting pani by xrd, saxd,...Structural characterization of chloride salt of conducting pani by xrd, saxd,...
Structural characterization of chloride salt of conducting pani by xrd, saxd,...Grupo de Pesquisa em Nanoneurobiofisica
 
On The Detection of Ctni - A Comparison of Surface-Plasmon Optical - Electroc...
On The Detection of Ctni - A Comparison of Surface-Plasmon Optical - Electroc...On The Detection of Ctni - A Comparison of Surface-Plasmon Optical - Electroc...
On The Detection of Ctni - A Comparison of Surface-Plasmon Optical - Electroc...komalicarol
 
High-Resolution Infrared and Electron-Diffraction Studies of Trimethylenecycl...
High-Resolution Infrared and Electron-Diffraction Studies of Trimethylenecycl...High-Resolution Infrared and Electron-Diffraction Studies of Trimethylenecycl...
High-Resolution Infrared and Electron-Diffraction Studies of Trimethylenecycl...Corey Wright
 
Biomolecular interaction analysis (BIA) techniques
Biomolecular interaction analysis (BIA) techniquesBiomolecular interaction analysis (BIA) techniques
Biomolecular interaction analysis (BIA) techniquesN Poorin
 

Similar to Color prediction from first principle quantum chemistry computations: a case of alizarin dissolved in methanol (20)

research paper II
research paper IIresearch paper II
research paper II
 
Analysis Of Steroids
Analysis Of SteroidsAnalysis Of Steroids
Analysis Of Steroids
 
Dye Sensitized Solar Cells- PhD Stage 3 Seminar
Dye Sensitized Solar Cells- PhD Stage 3 SeminarDye Sensitized Solar Cells- PhD Stage 3 Seminar
Dye Sensitized Solar Cells- PhD Stage 3 Seminar
 
Poster
Poster Poster
Poster
 
Kinetics dye
Kinetics dyeKinetics dye
Kinetics dye
 
C5OB00465A (1)
C5OB00465A (1)C5OB00465A (1)
C5OB00465A (1)
 
Radiolytic Modification of Basic Amino Acid Residues in Peptides : Probes for...
Radiolytic Modification of Basic Amino Acid Residues in Peptides : Probes for...Radiolytic Modification of Basic Amino Acid Residues in Peptides : Probes for...
Radiolytic Modification of Basic Amino Acid Residues in Peptides : Probes for...
 
Laser Ablation Molecular Isotopic Spectrometry for rare isotopes of the light...
Laser Ablation Molecular Isotopic Spectrometry for rare isotopes of the light...Laser Ablation Molecular Isotopic Spectrometry for rare isotopes of the light...
Laser Ablation Molecular Isotopic Spectrometry for rare isotopes of the light...
 
An Assignment Walk Through 3D NMR Spectrum
An Assignment Walk Through 3D NMR SpectrumAn Assignment Walk Through 3D NMR Spectrum
An Assignment Walk Through 3D NMR Spectrum
 
BODA-2015-BT1A.6
BODA-2015-BT1A.6BODA-2015-BT1A.6
BODA-2015-BT1A.6
 
Applications of mass spectrometry.seminar.pptx
Applications of mass spectrometry.seminar.pptxApplications of mass spectrometry.seminar.pptx
Applications of mass spectrometry.seminar.pptx
 
Mass Spectrometry Applications and spectral interpretation: Basics
Mass Spectrometry Applications and spectral interpretation: BasicsMass Spectrometry Applications and spectral interpretation: Basics
Mass Spectrometry Applications and spectral interpretation: Basics
 
Analical chemistry ok1294986152
Analical chemistry  ok1294986152Analical chemistry  ok1294986152
Analical chemistry ok1294986152
 
1-s2.0-S1386142514011962-main
1-s2.0-S1386142514011962-main1-s2.0-S1386142514011962-main
1-s2.0-S1386142514011962-main
 
Structural characterization of chloride salt of conducting pani by xrd, saxd,...
Structural characterization of chloride salt of conducting pani by xrd, saxd,...Structural characterization of chloride salt of conducting pani by xrd, saxd,...
Structural characterization of chloride salt of conducting pani by xrd, saxd,...
 
paper 2
paper 2paper 2
paper 2
 
Rosu2014_Article_PhotochemicalStabilityOfCellul.pdf
Rosu2014_Article_PhotochemicalStabilityOfCellul.pdfRosu2014_Article_PhotochemicalStabilityOfCellul.pdf
Rosu2014_Article_PhotochemicalStabilityOfCellul.pdf
 
On The Detection of Ctni - A Comparison of Surface-Plasmon Optical - Electroc...
On The Detection of Ctni - A Comparison of Surface-Plasmon Optical - Electroc...On The Detection of Ctni - A Comparison of Surface-Plasmon Optical - Electroc...
On The Detection of Ctni - A Comparison of Surface-Plasmon Optical - Electroc...
 
High-Resolution Infrared and Electron-Diffraction Studies of Trimethylenecycl...
High-Resolution Infrared and Electron-Diffraction Studies of Trimethylenecycl...High-Resolution Infrared and Electron-Diffraction Studies of Trimethylenecycl...
High-Resolution Infrared and Electron-Diffraction Studies of Trimethylenecycl...
 
Biomolecular interaction analysis (BIA) techniques
Biomolecular interaction analysis (BIA) techniquesBiomolecular interaction analysis (BIA) techniques
Biomolecular interaction analysis (BIA) techniques
 

More from Maciej Przybyłek

Experimental and Theoretical Insights into the Intermolecular Interactions in...
Experimental and Theoretical Insights into the Intermolecular Interactions in...Experimental and Theoretical Insights into the Intermolecular Interactions in...
Experimental and Theoretical Insights into the Intermolecular Interactions in...Maciej Przybyłek
 
Deep Eutectic Solvents as Agents for Improving the Solubility of Edaravone: E...
Deep Eutectic Solvents as Agents for Improving the Solubility of Edaravone: E...Deep Eutectic Solvents as Agents for Improving the Solubility of Edaravone: E...
Deep Eutectic Solvents as Agents for Improving the Solubility of Edaravone: E...Maciej Przybyłek
 
Predicting sulfanilamide solubility in the binary mixtures using a reference ...
Predicting sulfanilamide solubility in the binary mixtures using a reference ...Predicting sulfanilamide solubility in the binary mixtures using a reference ...
Predicting sulfanilamide solubility in the binary mixtures using a reference ...Maciej Przybyłek
 
Molecular dynamics simulations of the affinity of chitin and chitosan for col...
Molecular dynamics simulations of the affinity of chitin and chitosan for col...Molecular dynamics simulations of the affinity of chitin and chitosan for col...
Molecular dynamics simulations of the affinity of chitin and chitosan for col...Maciej Przybyłek
 
Intermolecular Interactions as a Measure of Dapsone Solubility in Neat Solven...
Intermolecular Interactions as a Measure of Dapsone Solubility in Neat Solven...Intermolecular Interactions as a Measure of Dapsone Solubility in Neat Solven...
Intermolecular Interactions as a Measure of Dapsone Solubility in Neat Solven...Maciej Przybyłek
 
Finding the Right Solvent: A Novel Screening Protocol for Identifying Environ...
Finding the Right Solvent: A Novel Screening Protocol for Identifying Environ...Finding the Right Solvent: A Novel Screening Protocol for Identifying Environ...
Finding the Right Solvent: A Novel Screening Protocol for Identifying Environ...Maciej Przybyłek
 
Intermolecular Interactions of Edaravone in Aqueous Solutions of Ethaline and...
Intermolecular Interactions of Edaravone in Aqueous Solutions of Ethaline and...Intermolecular Interactions of Edaravone in Aqueous Solutions of Ethaline and...
Intermolecular Interactions of Edaravone in Aqueous Solutions of Ethaline and...Maciej Przybyłek
 
Collagen Type II—Chitosan Interactions as Dependent on Hydroxylation and Acet...
Collagen Type II—Chitosan Interactions as Dependent on Hydroxylation and Acet...Collagen Type II—Chitosan Interactions as Dependent on Hydroxylation and Acet...
Collagen Type II—Chitosan Interactions as Dependent on Hydroxylation and Acet...Maciej Przybyłek
 
Solubility Characteristics of Acetaminophen and Phenacetin in Binary Mixtures...
Solubility Characteristics of Acetaminophen and Phenacetin in Binary Mixtures...Solubility Characteristics of Acetaminophen and Phenacetin in Binary Mixtures...
Solubility Characteristics of Acetaminophen and Phenacetin in Binary Mixtures...Maciej Przybyłek
 
Application of COSMO-RS-DARE as a Tool for Testing Consistency of Solubility ...
Application of COSMO-RS-DARE as a Tool for Testing Consistency of Solubility ...Application of COSMO-RS-DARE as a Tool for Testing Consistency of Solubility ...
Application of COSMO-RS-DARE as a Tool for Testing Consistency of Solubility ...Maciej Przybyłek
 
Albumin–Hyaluronan Interactions: Influence of Ionic Composition Probed by Mol...
Albumin–Hyaluronan Interactions: Influence of Ionic Composition Probed by Mol...Albumin–Hyaluronan Interactions: Influence of Ionic Composition Probed by Mol...
Albumin–Hyaluronan Interactions: Influence of Ionic Composition Probed by Mol...Maciej Przybyłek
 
Effect of Chitosan Deacetylation on Its Affinity to Type III Collagen: A Mole...
Effect of Chitosan Deacetylation on Its Affinity to Type III Collagen: A Mole...Effect of Chitosan Deacetylation on Its Affinity to Type III Collagen: A Mole...
Effect of Chitosan Deacetylation on Its Affinity to Type III Collagen: A Mole...Maciej Przybyłek
 
New Screening Protocol for Effective Green Solvents Selection of Benzamide, S...
New Screening Protocol for Effective Green Solvents Selection of Benzamide, S...New Screening Protocol for Effective Green Solvents Selection of Benzamide, S...
New Screening Protocol for Effective Green Solvents Selection of Benzamide, S...Maciej Przybyłek
 
Experimental and theoretical solubility advantage screening of bi-component s...
Experimental and theoretical solubility advantage screening of bi-component s...Experimental and theoretical solubility advantage screening of bi-component s...
Experimental and theoretical solubility advantage screening of bi-component s...Maciej Przybyłek
 
Predicting Value of Binding Constants of Organic Ligands to Beta-Cyclodextrin...
Predicting Value of Binding Constants of Organic Ligands to Beta-Cyclodextrin...Predicting Value of Binding Constants of Organic Ligands to Beta-Cyclodextrin...
Predicting Value of Binding Constants of Organic Ligands to Beta-Cyclodextrin...Maciej Przybyłek
 
Natural Deep Eutectic Solvents as Agents for Improving Solubility, Stability ...
Natural Deep Eutectic Solvents as Agents for Improving Solubility, Stability ...Natural Deep Eutectic Solvents as Agents for Improving Solubility, Stability ...
Natural Deep Eutectic Solvents as Agents for Improving Solubility, Stability ...Maciej Przybyłek
 
Application of Multivariate Adaptive Regression Splines (MARSplines) for Pred...
Application of Multivariate Adaptive Regression Splines (MARSplines) for Pred...Application of Multivariate Adaptive Regression Splines (MARSplines) for Pred...
Application of Multivariate Adaptive Regression Splines (MARSplines) for Pred...Maciej Przybyłek
 
Utilization of oriented crystal growth for screening of aromatic carboxylic a...
Utilization of oriented crystal growth for screening of aromatic carboxylic a...Utilization of oriented crystal growth for screening of aromatic carboxylic a...
Utilization of oriented crystal growth for screening of aromatic carboxylic a...Maciej Przybyłek
 
Studies on the formation of formaldehyde during 2-ethylhexyl 4-(dimethylamino...
Studies on the formation of formaldehyde during 2-ethylhexyl 4-(dimethylamino...Studies on the formation of formaldehyde during 2-ethylhexyl 4-(dimethylamino...
Studies on the formation of formaldehyde during 2-ethylhexyl 4-(dimethylamino...Maciej Przybyłek
 
Reaction of aniline with ammonium persulphate and concentrated hydrochloric a...
Reaction of aniline with ammonium persulphate and concentrated hydrochloric a...Reaction of aniline with ammonium persulphate and concentrated hydrochloric a...
Reaction of aniline with ammonium persulphate and concentrated hydrochloric a...Maciej Przybyłek
 

More from Maciej Przybyłek (20)

Experimental and Theoretical Insights into the Intermolecular Interactions in...
Experimental and Theoretical Insights into the Intermolecular Interactions in...Experimental and Theoretical Insights into the Intermolecular Interactions in...
Experimental and Theoretical Insights into the Intermolecular Interactions in...
 
Deep Eutectic Solvents as Agents for Improving the Solubility of Edaravone: E...
Deep Eutectic Solvents as Agents for Improving the Solubility of Edaravone: E...Deep Eutectic Solvents as Agents for Improving the Solubility of Edaravone: E...
Deep Eutectic Solvents as Agents for Improving the Solubility of Edaravone: E...
 
Predicting sulfanilamide solubility in the binary mixtures using a reference ...
Predicting sulfanilamide solubility in the binary mixtures using a reference ...Predicting sulfanilamide solubility in the binary mixtures using a reference ...
Predicting sulfanilamide solubility in the binary mixtures using a reference ...
 
Molecular dynamics simulations of the affinity of chitin and chitosan for col...
Molecular dynamics simulations of the affinity of chitin and chitosan for col...Molecular dynamics simulations of the affinity of chitin and chitosan for col...
Molecular dynamics simulations of the affinity of chitin and chitosan for col...
 
Intermolecular Interactions as a Measure of Dapsone Solubility in Neat Solven...
Intermolecular Interactions as a Measure of Dapsone Solubility in Neat Solven...Intermolecular Interactions as a Measure of Dapsone Solubility in Neat Solven...
Intermolecular Interactions as a Measure of Dapsone Solubility in Neat Solven...
 
Finding the Right Solvent: A Novel Screening Protocol for Identifying Environ...
Finding the Right Solvent: A Novel Screening Protocol for Identifying Environ...Finding the Right Solvent: A Novel Screening Protocol for Identifying Environ...
Finding the Right Solvent: A Novel Screening Protocol for Identifying Environ...
 
Intermolecular Interactions of Edaravone in Aqueous Solutions of Ethaline and...
Intermolecular Interactions of Edaravone in Aqueous Solutions of Ethaline and...Intermolecular Interactions of Edaravone in Aqueous Solutions of Ethaline and...
Intermolecular Interactions of Edaravone in Aqueous Solutions of Ethaline and...
 
Collagen Type II—Chitosan Interactions as Dependent on Hydroxylation and Acet...
Collagen Type II—Chitosan Interactions as Dependent on Hydroxylation and Acet...Collagen Type II—Chitosan Interactions as Dependent on Hydroxylation and Acet...
Collagen Type II—Chitosan Interactions as Dependent on Hydroxylation and Acet...
 
Solubility Characteristics of Acetaminophen and Phenacetin in Binary Mixtures...
Solubility Characteristics of Acetaminophen and Phenacetin in Binary Mixtures...Solubility Characteristics of Acetaminophen and Phenacetin in Binary Mixtures...
Solubility Characteristics of Acetaminophen and Phenacetin in Binary Mixtures...
 
Application of COSMO-RS-DARE as a Tool for Testing Consistency of Solubility ...
Application of COSMO-RS-DARE as a Tool for Testing Consistency of Solubility ...Application of COSMO-RS-DARE as a Tool for Testing Consistency of Solubility ...
Application of COSMO-RS-DARE as a Tool for Testing Consistency of Solubility ...
 
Albumin–Hyaluronan Interactions: Influence of Ionic Composition Probed by Mol...
Albumin–Hyaluronan Interactions: Influence of Ionic Composition Probed by Mol...Albumin–Hyaluronan Interactions: Influence of Ionic Composition Probed by Mol...
Albumin–Hyaluronan Interactions: Influence of Ionic Composition Probed by Mol...
 
Effect of Chitosan Deacetylation on Its Affinity to Type III Collagen: A Mole...
Effect of Chitosan Deacetylation on Its Affinity to Type III Collagen: A Mole...Effect of Chitosan Deacetylation on Its Affinity to Type III Collagen: A Mole...
Effect of Chitosan Deacetylation on Its Affinity to Type III Collagen: A Mole...
 
New Screening Protocol for Effective Green Solvents Selection of Benzamide, S...
New Screening Protocol for Effective Green Solvents Selection of Benzamide, S...New Screening Protocol for Effective Green Solvents Selection of Benzamide, S...
New Screening Protocol for Effective Green Solvents Selection of Benzamide, S...
 
Experimental and theoretical solubility advantage screening of bi-component s...
Experimental and theoretical solubility advantage screening of bi-component s...Experimental and theoretical solubility advantage screening of bi-component s...
Experimental and theoretical solubility advantage screening of bi-component s...
 
Predicting Value of Binding Constants of Organic Ligands to Beta-Cyclodextrin...
Predicting Value of Binding Constants of Organic Ligands to Beta-Cyclodextrin...Predicting Value of Binding Constants of Organic Ligands to Beta-Cyclodextrin...
Predicting Value of Binding Constants of Organic Ligands to Beta-Cyclodextrin...
 
Natural Deep Eutectic Solvents as Agents for Improving Solubility, Stability ...
Natural Deep Eutectic Solvents as Agents for Improving Solubility, Stability ...Natural Deep Eutectic Solvents as Agents for Improving Solubility, Stability ...
Natural Deep Eutectic Solvents as Agents for Improving Solubility, Stability ...
 
Application of Multivariate Adaptive Regression Splines (MARSplines) for Pred...
Application of Multivariate Adaptive Regression Splines (MARSplines) for Pred...Application of Multivariate Adaptive Regression Splines (MARSplines) for Pred...
Application of Multivariate Adaptive Regression Splines (MARSplines) for Pred...
 
Utilization of oriented crystal growth for screening of aromatic carboxylic a...
Utilization of oriented crystal growth for screening of aromatic carboxylic a...Utilization of oriented crystal growth for screening of aromatic carboxylic a...
Utilization of oriented crystal growth for screening of aromatic carboxylic a...
 
Studies on the formation of formaldehyde during 2-ethylhexyl 4-(dimethylamino...
Studies on the formation of formaldehyde during 2-ethylhexyl 4-(dimethylamino...Studies on the formation of formaldehyde during 2-ethylhexyl 4-(dimethylamino...
Studies on the formation of formaldehyde during 2-ethylhexyl 4-(dimethylamino...
 
Reaction of aniline with ammonium persulphate and concentrated hydrochloric a...
Reaction of aniline with ammonium persulphate and concentrated hydrochloric a...Reaction of aniline with ammonium persulphate and concentrated hydrochloric a...
Reaction of aniline with ammonium persulphate and concentrated hydrochloric a...
 

Recently uploaded

Hubble Asteroid Hunter III. Physical properties of newly found asteroids
Hubble Asteroid Hunter III. Physical properties of newly found asteroidsHubble Asteroid Hunter III. Physical properties of newly found asteroids
Hubble Asteroid Hunter III. Physical properties of newly found asteroidsSérgio Sacani
 
Natural Polymer Based Nanomaterials
Natural Polymer Based NanomaterialsNatural Polymer Based Nanomaterials
Natural Polymer Based NanomaterialsAArockiyaNisha
 
Analytical Profile of Coleus Forskohlii | Forskolin .pdf
Analytical Profile of Coleus Forskohlii | Forskolin .pdfAnalytical Profile of Coleus Forskohlii | Forskolin .pdf
Analytical Profile of Coleus Forskohlii | Forskolin .pdfSwapnil Therkar
 
Boyles law module in the grade 10 science
Boyles law module in the grade 10 scienceBoyles law module in the grade 10 science
Boyles law module in the grade 10 sciencefloriejanemacaya1
 
Work, Energy and Power for class 10 ICSE Physics
Work, Energy and Power for class 10 ICSE PhysicsWork, Energy and Power for class 10 ICSE Physics
Work, Energy and Power for class 10 ICSE Physicsvishikhakeshava1
 
Scheme-of-Work-Science-Stage-4 cambridge science.docx
Scheme-of-Work-Science-Stage-4 cambridge science.docxScheme-of-Work-Science-Stage-4 cambridge science.docx
Scheme-of-Work-Science-Stage-4 cambridge science.docxyaramohamed343013
 
A relative description on Sonoporation.pdf
A relative description on Sonoporation.pdfA relative description on Sonoporation.pdf
A relative description on Sonoporation.pdfnehabiju2046
 
SOLUBLE PATTERN RECOGNITION RECEPTORS.pptx
SOLUBLE PATTERN RECOGNITION RECEPTORS.pptxSOLUBLE PATTERN RECOGNITION RECEPTORS.pptx
SOLUBLE PATTERN RECOGNITION RECEPTORS.pptxkessiyaTpeter
 
Unlocking the Potential: Deep dive into ocean of Ceramic Magnets.pptx
Unlocking  the Potential: Deep dive into ocean of Ceramic Magnets.pptxUnlocking  the Potential: Deep dive into ocean of Ceramic Magnets.pptx
Unlocking the Potential: Deep dive into ocean of Ceramic Magnets.pptxanandsmhk
 
zoogeography of pakistan.pptx fauna of Pakistan
zoogeography of pakistan.pptx fauna of Pakistanzoogeography of pakistan.pptx fauna of Pakistan
zoogeography of pakistan.pptx fauna of Pakistanzohaibmir069
 
VIRUSES structure and classification ppt by Dr.Prince C P
VIRUSES structure and classification ppt by Dr.Prince C PVIRUSES structure and classification ppt by Dr.Prince C P
VIRUSES structure and classification ppt by Dr.Prince C PPRINCE C P
 
Isotopic evidence of long-lived volcanism on Io
Isotopic evidence of long-lived volcanism on IoIsotopic evidence of long-lived volcanism on Io
Isotopic evidence of long-lived volcanism on IoSérgio Sacani
 
Orientation, design and principles of polyhouse
Orientation, design and principles of polyhouseOrientation, design and principles of polyhouse
Orientation, design and principles of polyhousejana861314
 
Animal Communication- Auditory and Visual.pptx
Animal Communication- Auditory and Visual.pptxAnimal Communication- Auditory and Visual.pptx
Animal Communication- Auditory and Visual.pptxUmerFayaz5
 
Cultivation of KODO MILLET . made by Ghanshyam pptx
Cultivation of KODO MILLET . made by Ghanshyam pptxCultivation of KODO MILLET . made by Ghanshyam pptx
Cultivation of KODO MILLET . made by Ghanshyam pptxpradhanghanshyam7136
 
Biopesticide (2).pptx .This slides helps to know the different types of biop...
Biopesticide (2).pptx  .This slides helps to know the different types of biop...Biopesticide (2).pptx  .This slides helps to know the different types of biop...
Biopesticide (2).pptx .This slides helps to know the different types of biop...RohitNehra6
 
Call Girls in Munirka Delhi 💯Call Us 🔝8264348440🔝
Call Girls in Munirka Delhi 💯Call Us 🔝8264348440🔝Call Girls in Munirka Delhi 💯Call Us 🔝8264348440🔝
Call Girls in Munirka Delhi 💯Call Us 🔝8264348440🔝soniya singh
 
Luciferase in rDNA technology (biotechnology).pptx
Luciferase in rDNA technology (biotechnology).pptxLuciferase in rDNA technology (biotechnology).pptx
Luciferase in rDNA technology (biotechnology).pptxAleenaTreesaSaji
 
Grafana in space: Monitoring Japan's SLIM moon lander in real time
Grafana in space: Monitoring Japan's SLIM moon lander  in real timeGrafana in space: Monitoring Japan's SLIM moon lander  in real time
Grafana in space: Monitoring Japan's SLIM moon lander in real timeSatoshi NAKAHIRA
 

Recently uploaded (20)

Hubble Asteroid Hunter III. Physical properties of newly found asteroids
Hubble Asteroid Hunter III. Physical properties of newly found asteroidsHubble Asteroid Hunter III. Physical properties of newly found asteroids
Hubble Asteroid Hunter III. Physical properties of newly found asteroids
 
Natural Polymer Based Nanomaterials
Natural Polymer Based NanomaterialsNatural Polymer Based Nanomaterials
Natural Polymer Based Nanomaterials
 
Analytical Profile of Coleus Forskohlii | Forskolin .pdf
Analytical Profile of Coleus Forskohlii | Forskolin .pdfAnalytical Profile of Coleus Forskohlii | Forskolin .pdf
Analytical Profile of Coleus Forskohlii | Forskolin .pdf
 
Boyles law module in the grade 10 science
Boyles law module in the grade 10 scienceBoyles law module in the grade 10 science
Boyles law module in the grade 10 science
 
Work, Energy and Power for class 10 ICSE Physics
Work, Energy and Power for class 10 ICSE PhysicsWork, Energy and Power for class 10 ICSE Physics
Work, Energy and Power for class 10 ICSE Physics
 
Scheme-of-Work-Science-Stage-4 cambridge science.docx
Scheme-of-Work-Science-Stage-4 cambridge science.docxScheme-of-Work-Science-Stage-4 cambridge science.docx
Scheme-of-Work-Science-Stage-4 cambridge science.docx
 
A relative description on Sonoporation.pdf
A relative description on Sonoporation.pdfA relative description on Sonoporation.pdf
A relative description on Sonoporation.pdf
 
SOLUBLE PATTERN RECOGNITION RECEPTORS.pptx
SOLUBLE PATTERN RECOGNITION RECEPTORS.pptxSOLUBLE PATTERN RECOGNITION RECEPTORS.pptx
SOLUBLE PATTERN RECOGNITION RECEPTORS.pptx
 
Unlocking the Potential: Deep dive into ocean of Ceramic Magnets.pptx
Unlocking  the Potential: Deep dive into ocean of Ceramic Magnets.pptxUnlocking  the Potential: Deep dive into ocean of Ceramic Magnets.pptx
Unlocking the Potential: Deep dive into ocean of Ceramic Magnets.pptx
 
zoogeography of pakistan.pptx fauna of Pakistan
zoogeography of pakistan.pptx fauna of Pakistanzoogeography of pakistan.pptx fauna of Pakistan
zoogeography of pakistan.pptx fauna of Pakistan
 
VIRUSES structure and classification ppt by Dr.Prince C P
VIRUSES structure and classification ppt by Dr.Prince C PVIRUSES structure and classification ppt by Dr.Prince C P
VIRUSES structure and classification ppt by Dr.Prince C P
 
Isotopic evidence of long-lived volcanism on Io
Isotopic evidence of long-lived volcanism on IoIsotopic evidence of long-lived volcanism on Io
Isotopic evidence of long-lived volcanism on Io
 
Orientation, design and principles of polyhouse
Orientation, design and principles of polyhouseOrientation, design and principles of polyhouse
Orientation, design and principles of polyhouse
 
Engler and Prantl system of classification in plant taxonomy
Engler and Prantl system of classification in plant taxonomyEngler and Prantl system of classification in plant taxonomy
Engler and Prantl system of classification in plant taxonomy
 
Animal Communication- Auditory and Visual.pptx
Animal Communication- Auditory and Visual.pptxAnimal Communication- Auditory and Visual.pptx
Animal Communication- Auditory and Visual.pptx
 
Cultivation of KODO MILLET . made by Ghanshyam pptx
Cultivation of KODO MILLET . made by Ghanshyam pptxCultivation of KODO MILLET . made by Ghanshyam pptx
Cultivation of KODO MILLET . made by Ghanshyam pptx
 
Biopesticide (2).pptx .This slides helps to know the different types of biop...
Biopesticide (2).pptx  .This slides helps to know the different types of biop...Biopesticide (2).pptx  .This slides helps to know the different types of biop...
Biopesticide (2).pptx .This slides helps to know the different types of biop...
 
Call Girls in Munirka Delhi 💯Call Us 🔝8264348440🔝
Call Girls in Munirka Delhi 💯Call Us 🔝8264348440🔝Call Girls in Munirka Delhi 💯Call Us 🔝8264348440🔝
Call Girls in Munirka Delhi 💯Call Us 🔝8264348440🔝
 
Luciferase in rDNA technology (biotechnology).pptx
Luciferase in rDNA technology (biotechnology).pptxLuciferase in rDNA technology (biotechnology).pptx
Luciferase in rDNA technology (biotechnology).pptx
 
Grafana in space: Monitoring Japan's SLIM moon lander in real time
Grafana in space: Monitoring Japan's SLIM moon lander  in real timeGrafana in space: Monitoring Japan's SLIM moon lander  in real time
Grafana in space: Monitoring Japan's SLIM moon lander in real time
 

Color prediction from first principle quantum chemistry computations: a case of alizarin dissolved in methanol

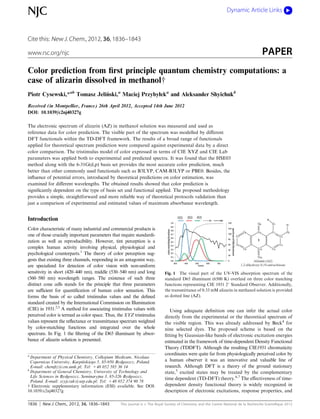
  • 1. 1836 New J. Chem., 2012, 36, 1836–1843 This journal is c The Royal Society of Chemistry and the Centre National de la Recherche Scientifique 2012 Cite this: New J. Chem., 2012, 36, 1836–1843 Color prediction from first principle quantum chemistry computations: a case of alizarin dissolved in methanolw Piotr Cysewski,*ab Tomasz Jelin´ ski,a Maciej Przyby$eka and Aleksander Shyichukb Received (in Montpellier, France) 26th April 2012, Accepted 14th June 2012 DOI: 10.1039/c2nj40327g The electronic spectrum of alizarin (AZ) in methanol solution was measured and used as reference data for color prediction. The visible part of the spectrum was modelled by different DFT functionals within the TD-DFT framework. The results of a broad range of functionals applied for theoretical spectrum prediction were compared against experimental data by a direct color comparison. The tristimulus model of color expressed in terms of CIE XYZ and CIE Lab parameters was applied both to experimental and predicted spectra. It was found that the HSE03 method along with the 6-31G(d,p) basis set provides the most accurate color prediction, much better than other commonly used functionals such as B3LYP, CAM-B3LYP or PBE0. Besides, the influence of potential errors, introduced by theoretical predictions on color estimation, was examined for different wavelengths. The obtained results showed that color prediction is significantly dependent on the type of basis set and functional applied. The proposed methodology provides a simple, straightforward and more reliable way of theoretical protocols validation than just a comparison of experimental and estimated values of maximum absorbance wavelength. Introduction Color characteristic of many industrial and commercial products is one of those crucially important parameters that require standardi- zation as well as reproducibility. However, tint perception is a complex human activity involving physical, physiological and psychological counterparts.1 The theory of color perception sug- gests that existing three channels, responding in an antagonist way, are specialized for detection of color vision with non-uniform sensitivity in short (420–440 nm), middle (530–540 nm) and long (560–580 nm) wavelength ranges. The existence of such three distinct cone cells stands for the principle that three parameters are sufficient for quantification of human color sensation. This forms the basis of so called tristimulus values and the defined standard created by the International Commission on Illumination (CIE) in 1931.2,3 A method for associating tristimulus values with perceived color is termed as color space. Thus, the XYZ tristimulus values represent the reflectance or transmittance spectrum weighted by color-matching functions and integrated over the whole spectrum. In Fig. 1 the filtering of the D65 illuminant by absor- bance of alizarin solution is presented. Using adequate definition one can infer the actual color directly from the experimental or the theoretical spectrum of the visible region. This was already addressed by Beck4 for nine selected dyes. The proposed scheme is based on the fitting by Gaussian-like bands of electronic excitation energies estimated in the framework of time-dependent Density Functional Theory (TDDFT). Although the resulting CIE1931 chromaticity coordinates were quite far from physiologically perceived color by a human observer it was an innovative and valuable line of research. Although DFT is a theory of the ground stationary state,5 excited states may be treated by the complementary time dependent (TD-DFT) theory.6,7 The effectiveness of time- dependent density functional theory is widely recognized in description of electronic excitations, response properties, and Fig. 1 The visual part of the UV-VIS absorption spectrum of the standard D65 illuminant (6500 K) overlaid on three color matching functions representing CIE 1931 21 Standard Observer. Additionally, the transmittance of 0.33 mM alizarin in methanol solution is provided as dotted line (AZ). a Department of Physical Chemistry, Collegium Medicum, Nicolaus Copernicus University, Kurpin´skiego 5, 85-950 Bydgoszcz, Poland. E-mail: chemfiz@cm.umk.pl; Tel: +48 052 585 36 14 b Department of General Chemistry, University of Technology and Life Sciences in Bydgoszcz, Seminaryjna 3, 85-326 Bydgoszcz, Poland. E-mail: szyjczuk@utp.edu.pl; Tel: +48 052 374 90 78 w Electronic supplementary information (ESI) available. See DOI: 10.1039/c2nj40327g NJC Dynamic Article Links www.rsc.org/njc PAPER
  • 2. This journal is c The Royal Society of Chemistry and the Centre National de la Recherche Scientifique 2012 New J. Chem., 2012, 36, 1836–1843 1837 transport in molecules and in bulk, because it is an effective approach.8,9 This success is due to relatively modest computa- tional cost of TD-DFT, since it scales the number of molecular orbitals to the fourth power, calculates the frequency dependence of a time-evolution of electric field, excitation energies as well as transition probabilities of theirselves are obtained without explicitly calculating the excited states.10 Although TD-DFT is still too expensive for larger molecular or nano-scaled systems, it is quite feasible for medium sized molecules possessing up to 100 atoms of second row elements, such as dyes.11,12 There is a wide variety of density functionals developed by different authors. Among them the most commonly used are Becke3–Lee– Yang–Parr hybrid functional (B3LYP)13 and the parameter-free Perdew–Burke–Enzerhof hybrid functional (abbreviated as PBE0 or PBE1PBE).14 It is evident that the choice of the exchange–correlation functional form is crucial for resulting predictions. For example, it is known that the local density approximation (LDA) has a tendency of underestimating the values of excitation energies for the majority of organic mole- cules. In contrast, the UV-VIS absorption spectra are typically predicted with better accuracy with utilization of the generalized gradient approximations (GGAs) or with meta-GGA approaches. Explicit inclusion of a fraction of HF exchange provides the most accurate model for spectra prediction. On the other hand, it is now accepted that the vertical TD-DFT model providing structureless bands becomes inadequate for multipeak bands with broad vibronic contributions.15,16 For example,16 it was demonstrated that the inclusion of vibronic contributions to theoretical spectra of quinodic dyes can significantly improve the predicted color. Also vibrationally resolved emission spectra were the source of acceptable prediction of the emission color of some phospho- rescent iridium(III) complexes for OLEDs.17 The spectacular dependence of predicted color16 on protocol of computations reminds that prediction of this particular feature of material is still a significant challenge for theoreticians. Nevertheless, this paper intends to further explore the correspondence between the color perceived by the human eye and chemical structure. Anthraquinones are a group of commonly known natural compounds, the name of which comes from 9,10-anthra- quinone, an organic compound with three fused aromatic rings and two keto groups located on the central ring. This class of compounds has wide applications not only as dyes,18 but also in medicine as drugs19 and antineoplastic agents20 as well as analytical reagents and indicators.21,22 Among different derivatives of anthra- quinones, the dihydroxy derivatives are of particular interest as coloring pigments,23 because of their antimicrobial, cytotoxic and antiviral properties,24,25 as well as their usage as photosensitizers for photo-dynamical anti-tumor therapy.26–28 Dihydroxy-anthraqui- nones are also used as colorimetric indicators for metal ions29–31 and enzyme activity.32 One of the most popular and widely used compounds of this group is alizarin (1,2-dihydroxy-9,10- anthraquinone), which was historically extracted from madder plant (Rubia tinctorum L.).33 Originally, it was adopted as a natural pigment for coloring textile but since then many new features of AZ have been discovered and the fields of its application became much wider. Alizarin experiences an antigenotoxic activity34 and is one of the components of an anti- tumor drug, adriamycin.35,36 The coloring properties of alizarin are still used not only in dye-related industry but also for artwork restoring,37 as well as in metal detection38 and solar energy transformation.39 The complexing ability of AZ is also of significant importance and it is utilized in many analytical applications like human blood serum analysis,40 determination of metal cations41 or water hardness measurements.42 The importance of anthraquinones as a general group of compounds and alizarin as their specific representative, can be inferred from the large number of publica- tions related to this topic and in the wide range of research that have been conducted before and are being conducted nowadays. A particularly interesting field of exploration is the determination of absorption spectra of alizarin and its tautomeric forms under different conditions. In particular, Ferreiro and Rodriguez-Otero43 studied the intramolecular proton transfer with the use of Hartree– Fock ab initio methods and determined the possible tautomeric forms of different dihydroxyanthraquinones. The later studies of Das,25 Fain et al.44,45 as well as Duncan and Prezhdo46 were an important step in the process of determination of the absorption spectrum of alizarin in its neutral and anionic forms. The Time Dependent Density Functional Theory (TD-DFT) was used in order to predict the absorption spectra of dihydroxyanthraqui- nones,47 and to evaluate the tautomeric effects on the absorption spectra of neutral and anionic forms of dihydroxyanthraqui- nones.48,49 The solvatochromic effect was also studied for alizarin and other dihydroxyanthraquinones.50,51 It is now commonly recognized that alizarin exists in three different forms, namely the protonated form and two deprotonated forms corresponding to the monoanion and the dianion.35,45,49 In acidic solutions alizarin shows an absorption maximum of around 430 nm28,49,51,52 and with pH increase the absorption band is shifted to higher wave- lengths, which are characteristic of deprotonated forms.35,49 The band with the maximum of around 550 nm corresponds to the monoanionic form, while the dianionic form is represented by two peaks in the range from 570 nm to 620 nm.31,48 The complexation of different metal ions by alizarin was also broadly studied both experimentally and by means of quantum chemistry calcula- tions. A wide spectrum of metal ions was used in these studies, including such important ones like Al(III),52 Mg(II), Cu(II), Ca(II), Cu(II)53 , Fe(III)53 and rare-earth metal ions.54 Methods Measurement of the alizarin spectrum Methanol (analytical grade) from POCH (Poland) and alizarin from Sigma-Aldrich (USA) were used without further purifi- cation procedures. Electronic absorption spectra of alizarin in methanolic solution were recorded using a single-beam UV/VIS spectrophotometer (Merck, Spectroquant Pharo 300) with a wavelength resolution of 1 nm. A solvent blank was measured before each recorded spectrum. All measurements were performed at ambient temperature in standard quartz cuvettes of 1 cm optical path. The recorded spectra of six methanol solutions of alizarin are presented in Fig. 2. Deconvolution of the visible spectrum The absorption profiles of the UV-VIS spectrum can be decomposed based on a simple additive model of Gaussian- like bands. The automatic fitting procedures have been already tested for a broad range of dyes of industrial importance.55
  • 3. 1838 New J. Chem., 2012, 36, 1836–1843 This journal is c The Royal Society of Chemistry and the Centre National de la Recherche Scientifique 2012 Usually this shape is sufficiently accurate for spectroscopic bands with inhomogeneous line broadening as they occur in charge-transfer absorption of large polyatomic molecules in solution. The deconvolution procedure was performed using Origin 8.0 software,56 which can decompose the spectrum into n-number of formal bands characterized by their position, ei,max (excitation energy, obviously related to wavelength li,max), the oscillator strength, fi, and half-bandwidths, si, of the i-th transition.57 The absorption, as a function of excitation energy, is then represented by the following formula: AðeÞ ¼ AoðeÞ þ Xn i¼1 2 ffiffiffiffiffiffiffiffiffiffiffiffiffi ln 2=p p fi si exp À4 ln 2ðei;max À eÞ2 s2 i ! ð1Þ where Ao(e) is just the baseline of the spectrum. In the simplest case of single band approximation (SBA) n = 1 and only one (dominant) excitation energy, emax, is to be considered. In fact, this is valid for alizarin in methanol solution studied here, since its optical activity is limited only to but one p - p* excitation. The experimental spectrum is the source of impor- tant parameters describing the band profile. First of all, the integrated absorption coefficient (IAC) can be extracted.58 This extinction coefficient is defined in terms of the optical density, IAC = R e dn, where n denotes the wave number. The IAC can be computed as the area under optical density (expressed in terms of dm3 molÀ1 cmÀ1 ) as a function of the wave number.57,59 Obviously, due to well known relationships60 this directly leads to the oscillator strength: f = 4.31968 Â 10À9 R e dn (2) This dimensionless spectral quantity is one of the forms of expression of the allowedness of a transition. In principle, it denotes the number of electrons undergoing particular transi- tion. Typically, its values lie between zero (non allowed transitions) and one (highly intense transitions). Based on the experimental spectrum of alizarin, the p - p* transition found at 431.6 nm (mean of values provided in Fig. 2) is mostly responsible for yellow color as shown in Fig. 2. For this band, the experimental value of IAC was found to be equal to 2.47 Â 107 dm3 molÀ1 cmÀ1 and the corresponding oscillator strength estimated for analysed series of alizarin concentra- tions is also presented in Fig. 2. The mean value of the oscillator strength is equal to 0.107, suggesting that alizarin exhibits rather modest absorption in the visible part of the spectrum. Although the Lambert–Beer law is obeyed for analysed AZ solutions, a red-shift of about 10 nm associated with the applied dilution is observed. Also, the broadening of the peak is to be noticed as a consequence of an increase in experimental values of half-bandwidth. These data result from the deconvolution of the experimental spectra according to eqn (1). On the other hand, contemporary quantum chemical computations, especially relying on the TD-DFT approach, allow for theoretical estimation of molecules readiness for electron transition. It is well known that the transition moment integral D = R CumC1 dt, between upper (Cu) and lower (Cl) states, represented by corresponding wave functions, is related to the intensity of the spectral peak. Here, m is the dipole moment operator of the system. Assuming the definite spin states and the Born–Oppenheimer approximation, the assess- ment of the oscillator strength is quite straightforward. This theoretical value, along with predicted energy of the electron transition, can be directly compared to experimental data, which can be used for quantitative verification of the quality of theoretical predictions. However, instead of a direct comparison of experimental and estimated values of oscillator strength or the wavelength defining maximum peak position, as it is commonly done in the literature,61,62 we adopted here a more straightforward and intuitive way with direct practical implications. Namely, based on different density functionals available in Gaussian0963 package and different protocols of computations, the spectrum profiles were generated and resulting color was estimated according to CIE 1931 21 standard. The color difference with respect to experimental one is computed based on an Euclidean distance from points on the CIE Lab scale: DE ¼ ffiffiffiffiffiffiffiffiffiffiffiffiffiffiffiffiffiffiffiffiffiffiffiffiffiffiffiffiffiffiffiffiffiffiffiffiffiffiffiffiffiffiffiffiffiffiffiffiffiffiffiffiffiffiffiffiffiffiffiffiffiffiffiffiffiffiffiffiffiffiffiffiffiffiffiffiffiffiffiffiffiffiffiffiffiffiffiffiffiffiffiffiffiffiffiffiffiffiffi ðLexp À LSBAÞ2 þ ðaexp À aSBAÞ2 þ ðbexp À bSBAÞ2 q ð3Þ This formula can relate objective color change to subjective perception. It is assumed that the standard observer can see the color difference if DE 4 5.64 Thus, the values of electron transition energies and oscillator strengths taken from TD DFT computations were used for convolution of the theoretical spectrum (eqn (1)). Then, they were fitted to experimental data corresponding to six different AZ concentrations in methanol simply by a scaling factor. The fitted spectra were then compared to experimental one based on eqn (3) and the mean value was used for quantitative assessment of the given theoretical protocol. TD-DFT first principle computations In this study a broad range of functionals was used in the aim of finding the most suitable one with respect to color prediction. Since accuracy of both maximum absorption wavelength and oscillator strength affects the shape of the spectrum band only one parameter, DE, estimated based on eqn (3) can be used for this purpose. The list of applied density functionals is provided in in Table S1 (ESIw). Fig. 2 Measured spectra of alizarin (AZ) in methanol for six different dilutions provided in the legend as negative logarithms of concentration (pCAZ = ÀlogCAZ). The CIE diagram represents color changes imposed by successive dilution along with the corresponding values of oscillator strength, lmax, and half-bandwidth, o.
  • 4. This journal is c The Royal Society of Chemistry and the Centre National de la Recherche Scientifique 2012 New J. Chem., 2012, 36, 1836–1843 1839 Solvation model It is well known that electronic spectra depend strongly on the solvent used. Alizarin exhibits significant solvatochromic effects in the presence of different binary and neat solvents.65 There are many solvation models and probably the most popular one is the self-consistent reaction field (SCRF) with the polarised continuum model (PCM) of solvation.66,67 In this paper PCM with Bondi-type atomic radii parameterization was applied to both geometry optimization and TD-DFT calculation steps. Results and discussion Before the actual prediction of alizarin color some comments are provided on the accuracy of single band approximation (SBA). It is interesting to know, how sensitive is the color prediction on the variation of parameters defining single Gaussian-like band in the visible region of the light spectrum. Then results of color computation for alizarin in methanol are presented and discussed. SBA model parameter analysis The aim of this section is to explore which parameters of the SBA model are crucial for color prediction and stand for the main source of changes of color parameters. For this purpose an absorption spectrum was mimicked by the normalised Gaussian-like band with varying parameters. Theoretical prediction of the electronic spectrum via quantum chemistry computations encounters two types of errors, namely the discrepancy (Dl) between predicted and computed lmax values and oscillator strength (f). The third parameter used in eqn (1), s half bandwidth, is available only after full vibronic spectra estimation using the Franck–Condon principle.68,69 This is however extremely time consuming and accuracy is still quite unsatisfactory.15 Hence, s is typically taken directly from experimental data as an empirical parameter. It is worth mentioning that different bands can be characterised by different s values, which are also prone to changes due to dilution of analysed solutions. It is then also interesting to know how a misfortunate selection of this value can affect predicted color. In the following analysis the oscillator strength is not taken into account due to normalisation of model spectra and consequently fixing it to s2 ffiffiffiffiffiffiffiffiffiffiffiffiffi ln 2=p p value. The influence of the modelled errors of lmax and s on CIE Lab values is presented in Fig. 3 and additionally, in more detail, in ESIw (see Fig. S1). Due to intrinsic features of color-matching functions different regions of the optical spectrum are differ- ently affected by analysed alterations of lmax and s values. When considering the lmax at 430 nm (corresponding to a yellow dye) it is clear that the shifting of band localization does not introduce dramatic change in the color. Although there is a quite substantial change in DE values, they are associated mainly to alteration of brightness rather than shifting along red–green or yellow–blue axes. Although s-dependent color change is observed, only tint is to be affected without substantial color modification. The higher the s values are, the more significant the color change is to be expected. Interestingly, there is an unsymmetrical influence of Dl on DE values and over- estimation of lmax leads to higher color change. The increase in Dl error causes the shifting along the red–green axis changing the predicted color slightly to reddish. This behavior occurs independently of the sign of the Dl error. The b parameter behaves in a similar way, and in this case the increase in the Dl error causes a shift from ‘‘blue’’ values to more ‘‘yellow’’ ones. Again, it is not important if the error value is negative or positive. The half bandwidth also influences the a and b CIE Lab values, i.e. the increase in its value induces a shift of the a parameter towards the green color and the b parameter towards the yellow color. These are important observations, enabling a more efficient selection of computational protocol for theoretical prediction of optical spectra. For a precise prediction of the color that does not affect the impression of tint perception (DE o 5.0), a high accuracy of Dl is expected (about Æ5 nm). This accuracy is achievable by contemporary TD-DFT methodology. In the case of lmax equal to 550 nm (corresponding to a red dye) the influence of the parameter changes on resulting color has analogical nature as described above, but change of sign in both a and b parameters can lead to more pronounced color change. The increase in Dl values results in an increase in a parameter values and decrease in b parameter values. Fig. 3 The color dependence on the two parameters of the SBA model, namely Dl = error in lmax = 430 nm and s half-bandwidth expressed as variations in CIEa and CIEb parameters as well as associated color change DE. The normalization condition fixes the values of the oscillator strength to f ¼ s2 ffiffiffiffiffiffiffiffiffiffiffiffiffi ln 2=p p .
  • 5. 1840 New J. Chem., 2012, 36, 1836–1843 This journal is c The Royal Society of Chemistry and the Centre National de la Recherche Scientifique 2012 Thus, one can anticipate that proper prediction of color from first principle simulations will be much more difficult for red dyes than that for yellow ones. Turning attention to blue dyes, one can consider two wavelengths lmax equal to 600 nm and 650 nm. The a parameter values shift towards those corres- ponding to a more greener color on the green–red axis when Dl increases. A shift towards yellow color is observed for the b parameter values while passing from negative to positive Dl error values. Increase in half bandwidth results in the decrease in all the CIELab index values: a (shift towards green) and b (shift towards blue). It is then expected that prediction from first principle of color of blue dyes will require a similar accuracy as yellow ones. Bearing in mind the above analysis, one can conclude that the most sensitive to model band parameters are supposed to be those dyes whose absorption band is located in the middle VIS wavelength range (red dyes). The prediction of extreme colors, either yellow or blue, is supposed to be less sensitive to computational inaccuracies. The main contribution to color change as a result of inadequate prediction of lmax comes from differences of parameter a, since shifting along the red–green axis is generally much more prone to alteration of band parameters. Shifting along the yellow–blue axis occurs with lesser extent since parameter b is much less sensitive to band parameters Prediction of color of alizarin by means of first principle quantum chemistry computations Alizarin can potentially exist in several tautomeric and rotameric isomers. Unfortunately, the solubility of alizarin in water is very low. This fact makes tautomeric equilibrium of alizarin in aqueous solution difficult to measure by means of electronic spectroscopy. Nevertheless, there are theoretical studies which show that, according to Boltzmann distribution in neutral and monoanionic alizarin populations, tautomeric forms with proton attached to the carbonyl group do not exist in water solution.70 Although due to the inductive effect of methyl group, methanol has greater proton affinity than water,71,72 theoretical and experi- mental pKa values show that substituted phenols are less acidic in methanol solutions than in aqueous ones.73 This suggests that OH bond dissociation in the phenolic moiety of alizarin is even less favourable in methanol than in water solution. Hence, both O9 and O10 centres are much less acidic when compared to O1 and O2 ones and proton migration toward quinone oxygen atoms is extremely unlikely. These intuitions are also confirmed by quantum chemistry computations and all possible tautomeric structures of AZ are presented in ESIw (see Table S2). All tautomers protonated at O9 or O10 centres are about several kcal molÀ1 less stable than the most abundant form (I) shown in Fig. 4. Among the rest of the interesting isomers only three seem to be of potential contribution to ground state optical properties of alizarin solutions. There were suggestions by Le Person et al.74 that both 9,10-keto- and 1,10-keto-forms can exist in methanol solution. Although the former isomer (I) predominates the concentration of latter (III) is also measurable and observed by these authors.75 The band around 550 nm is interpreted in terms of electronic properties of tautomer (III). However, a closer insight into tautomeric equilibrium suggests that there is only one form of AZ in the methanol solution defining the ground state. In Fig. 4 plots of estimated relative stabilities of the two most stable forms of AZ as a function of basis set expansion used for geometry optimization and Gibbs free energy computations are presented. Data presented in Fig. 4 clearly suggest that among two rotamers of 1,2-dihydroxy form, the isomer stabilized by two intramolecular hydrogen bonds (I) is energetically more favourable than the one with only single hydrogen bond inter- action (II). Interestingly, the presence of population of (II) reaching about 14% in the ground state and 18% in the excited state does not affect the optical properties of alizarin since these two rotamers have almost identical electronic properties. This is simply related to the fact that rotation of hydroxyl group bound to C2 centre does not affect the distribution of HOMO density. Thus, only one rotamer is sufficient for color description of AZ. Although intramolecular proton transfer from O2 to O9 centres can potentially alter HOMO distribution and consequently the optical spectrum, it seems to be rather improbable in the ground state. As it was well documented in the literature,75,76 this is the source of observed differences of absorption and emission spectra and can be attributed to the existence of different isomers in the excited states than in the ground one. However, taking into account data provided in Fig. 4, intramolecular proton transfer is Fig. 4 The relative values of the Gibbs free energy of two alizarin isomers with respect to the most abundant tautomer (I) expressed as a function of basis set expansion. Along with B3LYP or B97D functionals the following basis sets were used: cc-pvDZ (292), 6-31G(d,p) (310), 6-31++G(d,p) (444), 6-311++G(2d,2p) (566), 6-311++G(3df,2p) (782), where the number of basis functions constituting the given basis set is provided in the parenthesis. The percentages on the right panel correspond to tautomers population in the ground state and in the excited state (in parenthesis).
  • 6. This journal is c The Royal Society of Chemistry and the Centre National de la Recherche Scientifique 2012 New J. Chem., 2012, 36, 1836–1843 1841 rather unlike in methanol solution and the percentage of tautomer (III) in the whole population does not exceed 0.01% at room temperature for the ground state, while in the excited state the population is still very small, namely about 0.3%. This destabilization effect of intramolecular proton transfer in the ground state is even more pronounced for richer basis sets and should not be addressed solely to computational protocol. In our opinion, the interpretation of the band near 550 nm, which can be seen in methanol solutions (with very small intensity), should be addressed to the role of traces of water. Since alizarin can easily dissociate even under modestly acidic conditions (pH 4 5), the presence of water molecules can promote dissociation. There is a coincidental overlapping of excitation energies of the anionic form and tautomer (III) that might lead to misinterpretation74 of this band. Thus, for the further analysis only the 1,2-dihydroxy- 9,10-anthraquinone tautomer is taken into account, which is stabilized by two intramolecular hydrogen bonds. The series of theoretical predictions of the alizarin visible light spectrum in methanol solution was performed based on a variety of density functionals (see Table S1, ESIw). The problem of electronic spectrum prediction of anthraquinones was addressed exten- sively in the past mostly by estimation of p - p* transition energy.47–49,61,62 Here, however, instead of the comparison of experimental and estimated values of lmax, the color was expressed in terms of CIELab parameters and was compared to experimental values. Results of applied different computa- tional protocols are provided in Fig. 5, where mean DE values were estimated according to eqn (3). Letters denote the six computational protocols differing in the level of geometry optimizations and spectrum prediction within the TD-DFT approach. Interesting observations can be made based on the presented data. First of all, the prediction of alizarin color based on the first principle approach is quite satisfactory and the most accurate results are obtained with the aid of HSE2PBE using the 6-31G(d,p) basis set for both optimisation and spectrum prediction. This Heyd–Scuseria–Ernzerhof hybrid functional is rarely used for electronic spectra computations. As it is presented in Fig. 5 this method works significantly better than B3LYP or PBE0, the two most often used for the computations in question. The actual correlation between experimental and theoretical spectra for this particular method of computations is provided in Fig. 6. There is almost perfect matching between predicted and measured plots. Consequently, the color difference between experimental and theoretical CIE Lab values is as small as 2.5 nm. One can conclude that application of the TD-DFT method can lead to a very precise prediction of such a macroscopic parameter as color for dyes with simple vibronic structure. There are three major factors leading to such high accuracy. First of all, very high accuracy of lmax prediction by the HSE03 method was obtained with precision better than 1 nm. Secondly, the yellow color of AZ dye and, as it was discussed above, relatively small sensitivity of the dye to inaccuracies. Finally, simple vibronic structure of the AZ spectrum for which application of the SBA model is possible. This is not the case for all yellow dyes. For example 1,4-dihydroxyanthraquinone has quite broad vibronic charac- teristics disenabling the representation of the spectrum just by one Gaussian-like function. However, the extension of the proposed model seems to be possible and will be further investigated. Alizarin color can also be described by other functionals, as for example HSE06 and B972, offering quite promising alternatives. Also, the accuracy of lmax predicted by the very popular PBE0 method underestimates it only by 7 nm. This is quite acceptable since DE = 3.5. Many more functionals directly available in the G09 package were probed and the obtained results are provided in ESIw (see Table S1). The values presented in Fig. 5 and Fig. 7 suggest that both lmax and oscillator strengths are sensitive to functionals used for geometry optimization and spectrum estimation. In Fig. 5 one can find an interesting clue for selection of computational protocol. There are clearly visible two classes of methods resulting in the increase or decrease in accuracy of color prediction if more extended basis sets are taken into account. Since the inclusion of polarisation and/or diffusion functions is usually associated with red-shift of predicted lmax values, those functionals which underestimate the Fig. 5 The accuracy of color prediction of alizarin in methanol solution by means of a variety of electron density functionals and computational procedures. The following notation of the basis functions used for spectrum estimation precedes the basis set used for geometry optimization: A = 6-31G(d,p)//6-31G(d,p), B = 6-31++G(d,p)//6-31G(d,p), C = 6-311+G(d,p)//6-31G(d,p), D = 6-31++G(d,p)//6-31++G(d,p), E = 6-311+G(d,p)//6-311+G(d,p), F = 6-311++G(2d,2p)//6-311++G(2d,2p), G = 6-311++G(3df,2p)//6-311++G(3df,2p). The sequence in the legend corresponds to increasing values of color change.
  • 7. 1842 New J. Chem., 2012, 36, 1836–1843 This journal is c The Royal Society of Chemistry and the Centre National de la Recherche Scientifique 2012 excitation energy usually perform better for smaller basis sets. Thus, it makes sense to extend the basis sets only for such functionals, which underestimate lmax values for there is a chance that the resulting red-shift reduces the Dlmax error. This conclusion is quite consistent for all studied functionals. The acceptable geometries and electronic properties obtained based on quite poor basis sets such as 6-31G(d,p) was noticed by other authors11,15,47,61 and addressed as typical for anthra- quinones. Extension of the basis set can lead to gaining accuracy only for extremely large expansions. However, the obtained improvement is not worth of concurrent costs of computations. It is also worth noting that a misfortunate selection of the basis set can lead to a quite poor colordescription, as it is demonstrated by procedures B–E. Thus, the modest level of computations, if used with proper functional, both for geometry optimization and TD-DFT spectrum prediction seems to be the best solution. Conclusions Deconvolution of the whole visible spectrum of a dye just by single Gaussian-like band can be sufficient for adequate color prediction in the CIEXYZ or CIELab frameworks. The accuracy of color prediction based on such single band approximation has been found to be strongly dependent on the absorption maximum wavelength and half-bandwidth. Both yellow and blue dyes can be modelled quite accurately, whereas red ones seem to be more sensitive to any variation of the spectrum shape. The applied simple model relying on the convolution of the spectrum, assuming Gaussian-like shapes of the band, seems to be quite successful in color prediction from first principle quantum chemistry computations. However, accuracy strongly depends on the method used, both for geometry optimization and spectrum computation. As an example, alizarin was chosen and its color measured in methanol solution was predicted by a variety of DFT functionals. Presented results suggest that in the case of AZ the most accurate color prediction can be obtained by means of the HSE03 method. Also, other functionals can lead to a precise color estimation within the required threshold of DE = 5.0. It is worth mentioning that much more popular functional, such as PBE0, B3LYP or CAM-B3LYP, used for TDDFT calculations of dyes, usually perform much better than an inverted range-separated hybrid functional such as HSE. This observation is based on comparison of experimental and theoretical wavelength of maximum absorption. Especially effective, in the sense of agreement between theory and experi- ment, was found to be the combination of two functionals, PB0 along with B3LYP.77,78 Our results are in line with these observations since these two functionals belong to the class of 11 DFT methods giving DE values very close to the color differentiation limiting value for a standard observer. This suggests that such commonly used functionals may be adequate for color prediction. The basis set expansion is also important for both optimization and spectrum estimation via the TD-DFT framework. Interestingly, modest basis set proved to be sufficiently accurate at least for alizarin and the extension of the basis set is not recommended. The presented results can be readily applied both for color prediction of new substances as well as for verification of computational protocols best suited for particular groups of compounds. Besides, the provided analysis enhances the intuition of required accuracy for prediction of lmax values relating it quantitatively to color measures. Notes and references 1 C. H. Graham, Vision and visual perception, Wiley, New York, 1965. 2 CIE. Commission Internationale de l’Eclairage Proceedings,1931, Cambridge University Press, Cambridge, UK, 1932. 3 T. Smith and J. Guild, Trans. Opt. Soc., London, 1931, 33, 73. 4 M. E. Beck, Int. J. Quantum Chem., 2005, 101, 683. 5 W. Kohn and L. J. Sham, Phys. Rev. A: At., Mol., Opt. Phys., 1965, 140, 1133. 6 R. G. Parr and W. Yang, Density-Functional Theory of Atoms and Molecules, Oxford University Press, New York, 1989. 7 W. Koch and M. C. Holthausen, A chemist’s guide to density functional theory, Wiley-VCH, Weinheim, 2000. 8 M. E. Casida, Recent advances in density functional methods, World Scientific, Singapore, 1995. 9 C. A. Marques, M. A. L. Ullrich, F. Nogueira, A. Rubio, K. Burke and E. K. U. Gross, Time-dependent density functional theory, Springer, 2006. 10 S. J. A. Van Gisbergen, C. F. Guerra and E. J. Baerends, J. Comput. Chem., 2000, 21, 1511. 11 D. Jacquemin, E. A. Perpe` te, I. Ciofini and C. Adamo, Acc. Chem. Res., 2009, 42, 326. 12 J. Fabian, Dyes Pigm., 2010, 84, 36. 13 A. D. Becke, J. Chem. Phys., 1993, 98, 5648. 14 C. Adamo and V. Barone, J. Chem. Phys., 1999, 110, 6158. Fig. 6 The comparison of experimental (solid lines with black circles) and theoretical (dotted lines) spectra convoluted based on eqn (1) using values lmax and oscillator strength predicted by HSE2PBE functional at the 6-31G(d,p)//6-31G(d,p) level. Fig. 7 Interpretation of the visible region of the AZ electronic spectrum predicted by different DFT methods at the 6-31G(d,p)//6-31G(d,p) level. HOMO and LUMO densities are estimated based on HSE2PBE functional.
  • 8. This journal is c The Royal Society of Chemistry and the Centre National de la Recherche Scientifique 2012 New J. Chem., 2012, 36, 1836–1843 1843 15 D. Jacquemin, E. Bre´ mond, A. Planchat, I. Ciofini and C. Adamo, J. Chem. Theory Comput., 2011, 7, 1882. 16 D. Jacquemin, E. Bre´ mond, I. Ciofini and C. Adamo, J. Phys. Chem. Lett., 2012, 3, 468. 17 F. De Angelis, F. Sanoto, M. K. Nazeruddon and V. Barone, J. Phys. Chem. B, 2008, 112, 13181. 18 L. G. Angelini, L. Pistelli, P. Belloni, A. Bertoli and S. Panconesi, Ind. Crops Prod., 1997, 6, 303. 19 P. Ba´ nyai, N. Kuzovkina, L. Kursinszki and E´ . Szo¨ ke, Chromato- graphia, 2006, 63, 111. 20 Q. Huang, G. Lu, H.-M. Shen, M. C. M. Chung and C. N. Ong, Interscience, 2006, 609. 21 M. V. Canamares, J. V. G. Ramos, C. Domingo and S. S. Cortes, J. Raman Spectrosc., 2006, 35, 921. 22 S. M. Mascaros, C. Domingo, S. S. Cortes, M. V. Canamares and J. V. G. Ramos, J. Raman Spectrosc., 2005, 36, 420. 23 R. H. Thomson, Naturally Occurring Quinones III. Recent Advances, Chapman and Hall, London, 1986. 24 W. A. Remers, The Chemistry of Antitumour Antibiotics, Wiley, New York, 1981. 25 R. H. Thomson, Naturally Occuring Quinones, Chapman and Hall, London, 3rd edn, 1981. 26 J. R. Choi, S. C. Jeoung and D. W. Cho, Chem. Phys. Lett., 2004, 385, 384. 27 T. D. Giacco, L. Latterini and F. Elisei, Photochem. Photobiol. Sci., 2003, 2, 681. 28 C. Milliani, A. Romani and G. Favaro, J. Phys. Org. Chem., 2000, 13, 141. 29 S. Das, A. Saha and P. C. Mandal, Talanta, 1996, 43, 95. 30 L. Quinti, N. Allen, M. Edge, B. Murphy and A. Perotti, J. Photochem. Photobiol., A, 2003, 155, 79. 31 L. Quinti, N. Allen, M. Edge, B. Murphy and A. Perotti, J. Photochem. Photobiol., A, 2003, 155, 93. 32 Y.-G. Son, Ch.-H. Lee, J.-S. Seo, B.-J. Park and J.-M. Kim, Bull. Korean Chem. Soc., 2005, 26, 1560. 33 C. Ahn and S. K. Obendorf, Text. Res. J., 2004, 74, 949. 34 M. V. Canamares, J. V. G. Ramos, C. Domingo and S. S. Cortes, J. Raman Spectrosc., 2006, 35, 921. 35 S. Das, A. Bhattacharya, P. C. Mandal, M. C. Rath and T. Mukherjee, Radiat. Phys. Chem., 2002, 65, 93. 36 H. M. Berman and P. R. Young, Annu. Rev. Biophys. Bioeng., 1981, 10, 87. 37 S. Murcia-Mascaro´ s, C. Domingo, S. Sanchez-Cortes, M. V. Can˜ amares and J. V. Garcia-Ramos, J. Raman Spectrosc., 2005, 36, 420. 38 V. Y. Fain, B. E. Zaitsev and M. A. Ryabov, Russ. J. Coord. Chem., 2004, 30, 365. 39 R. Sa´ nchez-de-Armas, J. Oviedo Lo´ pez, M. A. San-Miguel, J. F. Sanz, P. Ordejo´ n and M. Pruneda, J. Chem. Theory Comput., 2010, 6, 2856. 40 F. Ge, L. Jiang, D. Liu and C.h. Chen, Anal. Sci., 2011, 27, 79. 41 A. Downard, H. Powell, J. Kipton and S. Xu, Anal. Chim. Acta, 1991, 251, 157. 42 M. E. Khalifa, Chem. Anal. (Warsaw), 1996, 41, 357. 43 M. Ferreiro and J. Rodriguez-Otero, J. Mol. Struct. (Theochem), 2001, 542, 63. 44 V. Fain, B. Zaitsev and M. Ryabov, Russ. J. Coord. Chem., 2004, 30, 365. 45 V. Fain, B. Zaitsev and M. Ryabov, Russ. J. Gen. Chem., 2004, 74, 1558. 46 W. Duncan and V. Prezhdo, J. Phys. Chem. B, 2005, 109, 365. 47 D. Jacquemin, V. Wathelet, J. Pre´ at and E. Perpe` te, Spectrochim. Acta, Part A, 2007, 67, 334. 48 M. Savko, S. Kasackova, P. Gbur, P. Miskovsky and J. Ulicny, J. Mol. Struct. (Theochem), 2007, 823, 78. 49 J. Pre´ at, A. Laurent, C. Michaux, E. Perpe` te and D. Jacquemin, J. Mol. Struct. (Theochem), 2009, 901, 24. 50 M. Reta, J. Anunziata, R. Cattana and J. Silber, Anal. Chim. Acta, 1995, 306, 81. 51 V. Sasirekha, M. Umadevi and V. Ramakrishnan, Spectrochim. Acta, Part A, 2008, 69, 148. 52 S. Say-Liang-Fat and J. P. Cornard, Polyhedron, 2011, 30, 2326. 53 M. Doskocz, K. Kubas, A. Fra˛ckowiak and R. Gancarz, Polyhedron, 2009, 28, 2201. 54 N. Komiha, O. K. Kabbaj and M. Charibi, J. Mol. Chem., 2002, 594, 135. 55 E. Bremond, J. Kieffer and C. Adamo, J. Mol. Struct. (Theochem), 2010, 954, 52. 56 Origin ver. 8.0, OriginLab, Northampton, MA. 57 J. M. Hollas, High resolution spectroscopy, Butternorth, 1982. 58 J. E. Sturm, J. Chem. Educ., 1990, 67, 32. 59 J. E. Sturm, J. Chem. Educ., 1992, 69, 686. 60 G. M. Barrow, Introduction to molecular spectroscopy, McGraw Hill, 1962. 61 D. Jacquemin, X. Assfeld, J. Pre´ at and E. A. Perpe` te, Mol. Phys., 2007, 105, 325. 62 G. Fayet, D. Jacquemin, V. Wathelet, E. A. Perpe` te, P. Rotureau and C. Adamo, J. Mol. Graphics Modell., 2010, 28, 465. 63 M. J. Frisch, G. W. Trucks, H. B. Schlegel, G. E. Scuseria, M. A. Robb, J. R. Cheeseman, G. Scalmani, V. Barone, B. Mennucci, G. A. Petersson, H. Nakatsuji, M. Caricato, X. Li, H. P. Hratchian, A. F. Izmaylov, J. Bloino, G. Zheng, J. L. Sonnenberg, M. Hada, M. Ehara, K. Toyota, R. Fukuda, J. Hasegawa, M. Ishida, T. Nakajima, Y. Honda, O. Kitao, H. Nakai, T. Vreven, J. A. Montgomery, Jr., J. E. Peralta, F. Ogliaro, M. Bearpark, J. J. Heyd, E. Brothers, K. N. Kudin, V. N. Staroverov, R. Kobayashi, J. Normand, K. Raghavachari, A. Rendell, J. C. Burant, S. S. Iyengar, J. Tomasi, M. Cossi, N. Rega, J. M. Millam, M. Klene, J. E. Knox, J. B. Cross, V. Bakken, C. Adamo, J. Jaramillo, R. Gomperts, R. E. Stratmann, O. Yazyev, A. J. Austin, R. Cammi, C. Pomelli, J. W. Ochterski, R. L. Martin, K. Morokuma, V. G. Zakrzewski, G. A. Voth, P. Salvador, J. J. Dannenberg, S. Dapprich, A. D. Daniels, O. Farkas, J. B. Foresman, J. V. Ortiz, J. Cioslowski and D. J. Fox, Gaussian 09, Revision A.01, Gaussian, Inc., Wallingford, CT, 2009. 64 A. K. Jain, Fundamentals of Digital Image Processing, Prentice Hall, New Jersey, 1989. 65 V. Sasirekha, M. Umadevi and V. Ramakrishnan, Spectrochim. Acta, Part A, 2008, 69, 148. 66 S. Miertusˇ , E. Scrocco and J. Tomasi, Chem. Phys., 1981, 55, 117. 67 S. Miertusˇ and J. Tomasi, Chem. Phys., 1982, 65, 239. 68 J. Franck, Trans. Faraday Soc., 1926, 21, 536. 69 E. Condon, Phys. Rev., 1928, 32, 858. 70 J. Pre´ at, A. D. Laurent, C. Michaux, E. A. Perpe` te and D. Jacquemin, J. Mol. Struct. (Theochem), 2009, 901, 24. 71 K. Suhara, A. Fujii, K. Mizuse, N. Mikami and J.-L. Kuo, J. Chem. Phys., 2007, 126, 194306. 72 P. Kebarle, R. M. Haynes and J. G. Collins, J. Am. Chem. Soc., 1967, 89, 5753. 73 K. Roy and P. L. A. Popelier, J. Phys. Org. Chem., 2009, 22, 186. 74 A. Le Person, J.-P. Cornard and S. Say-Liang-Fat, Chem. Phys. Lett., 2011, 517, 41. 75 P. Purkayastha and N. Chattopadhyay, Phys. Chem. Chem. Phys., 2000, 2, 203. 76 T. K. DabsuTautomersim and Spectral Properties of Alizarin (1,2-Dihydroxyanthracene-9, 10-Dione), Thesis, Addis Ababa University, 2007. 77 D. Jacquemin, J. Pre´ at, V. Wathelet, J. M. Andre` and E. A. Perpe` te, Chem. Phys. Lett., 2005, 405, 429. 78 E. A. Perpe` te, V. Wathelet, J. Pre´ at, C. Lamber and D. Jacquemin, J. Chem. Theory Comput., 2006, 2, 434.