Download to read offline
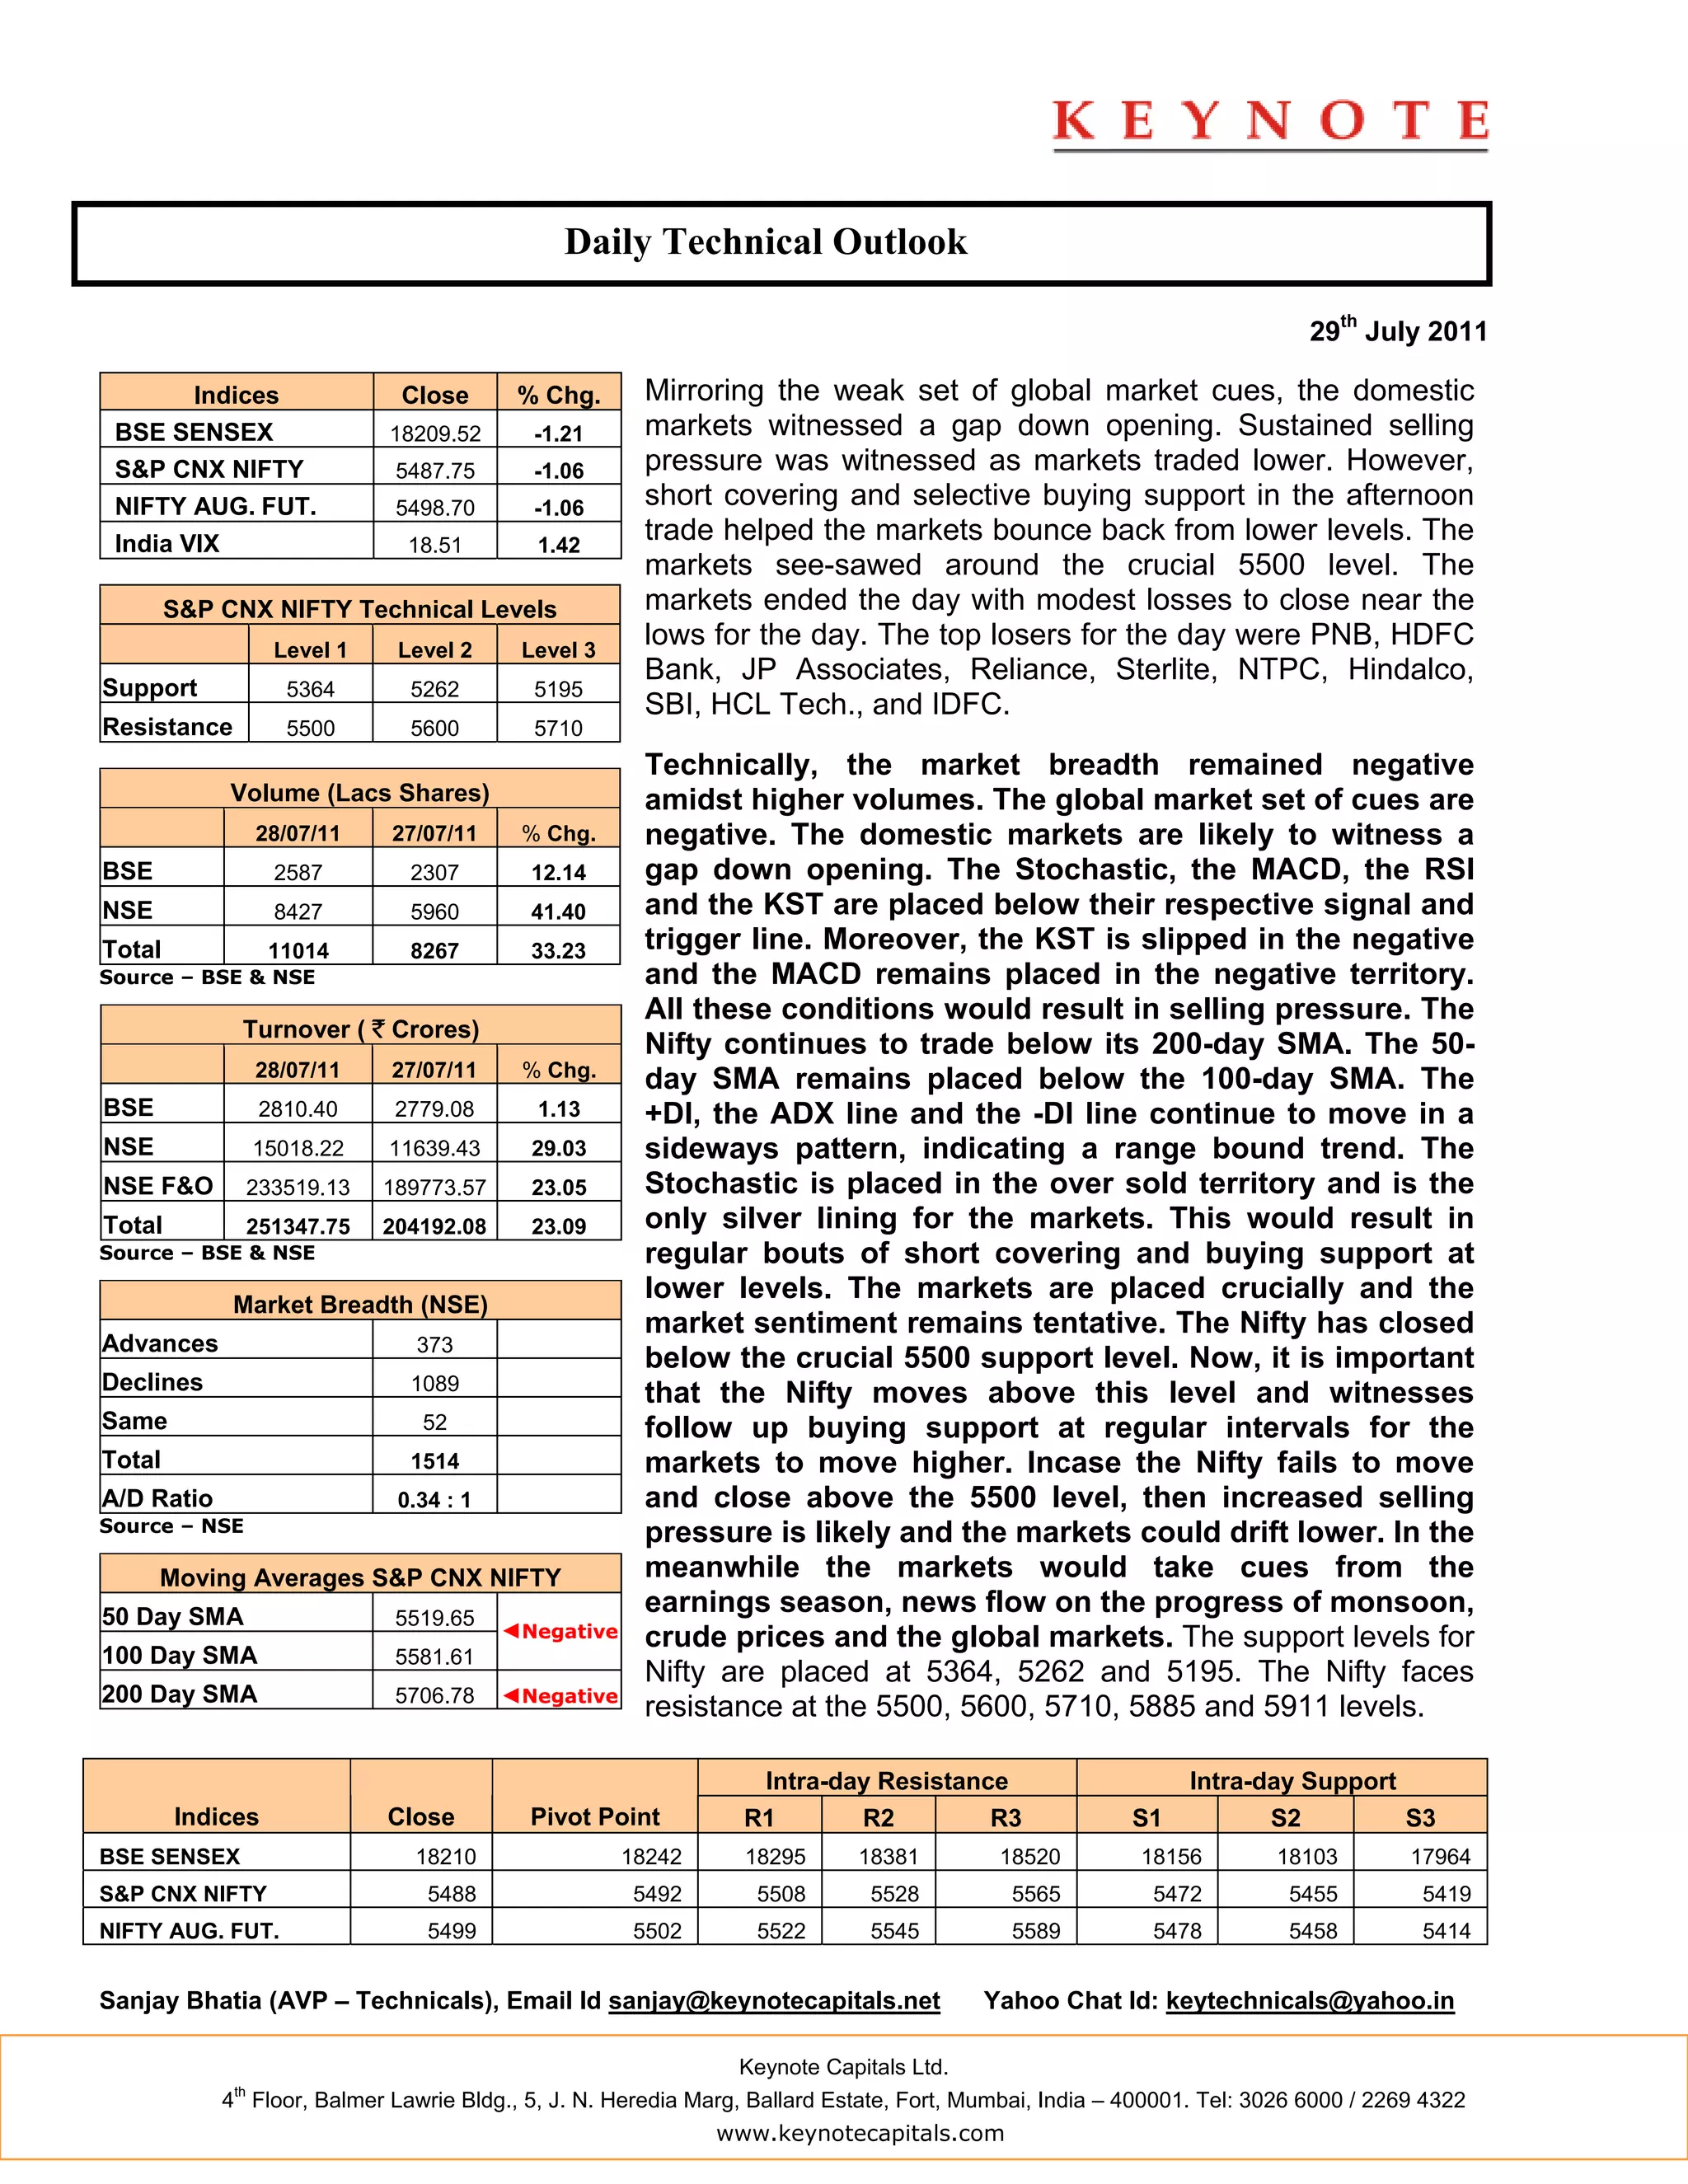


The domestic markets witnessed a gap down opening and sustained selling pressure, though short covering and selective buying later helped markets bounce back from lower levels. The markets ended the day with modest losses near the lows. Technically, market breadth remained negative amidst higher volumes. The global cues are negative and domestic markets are likely to see a gap down opening. Support levels for Nifty are at 5364, 5262 and 5195, while resistance levels are at 5500, 5600, 5710.


