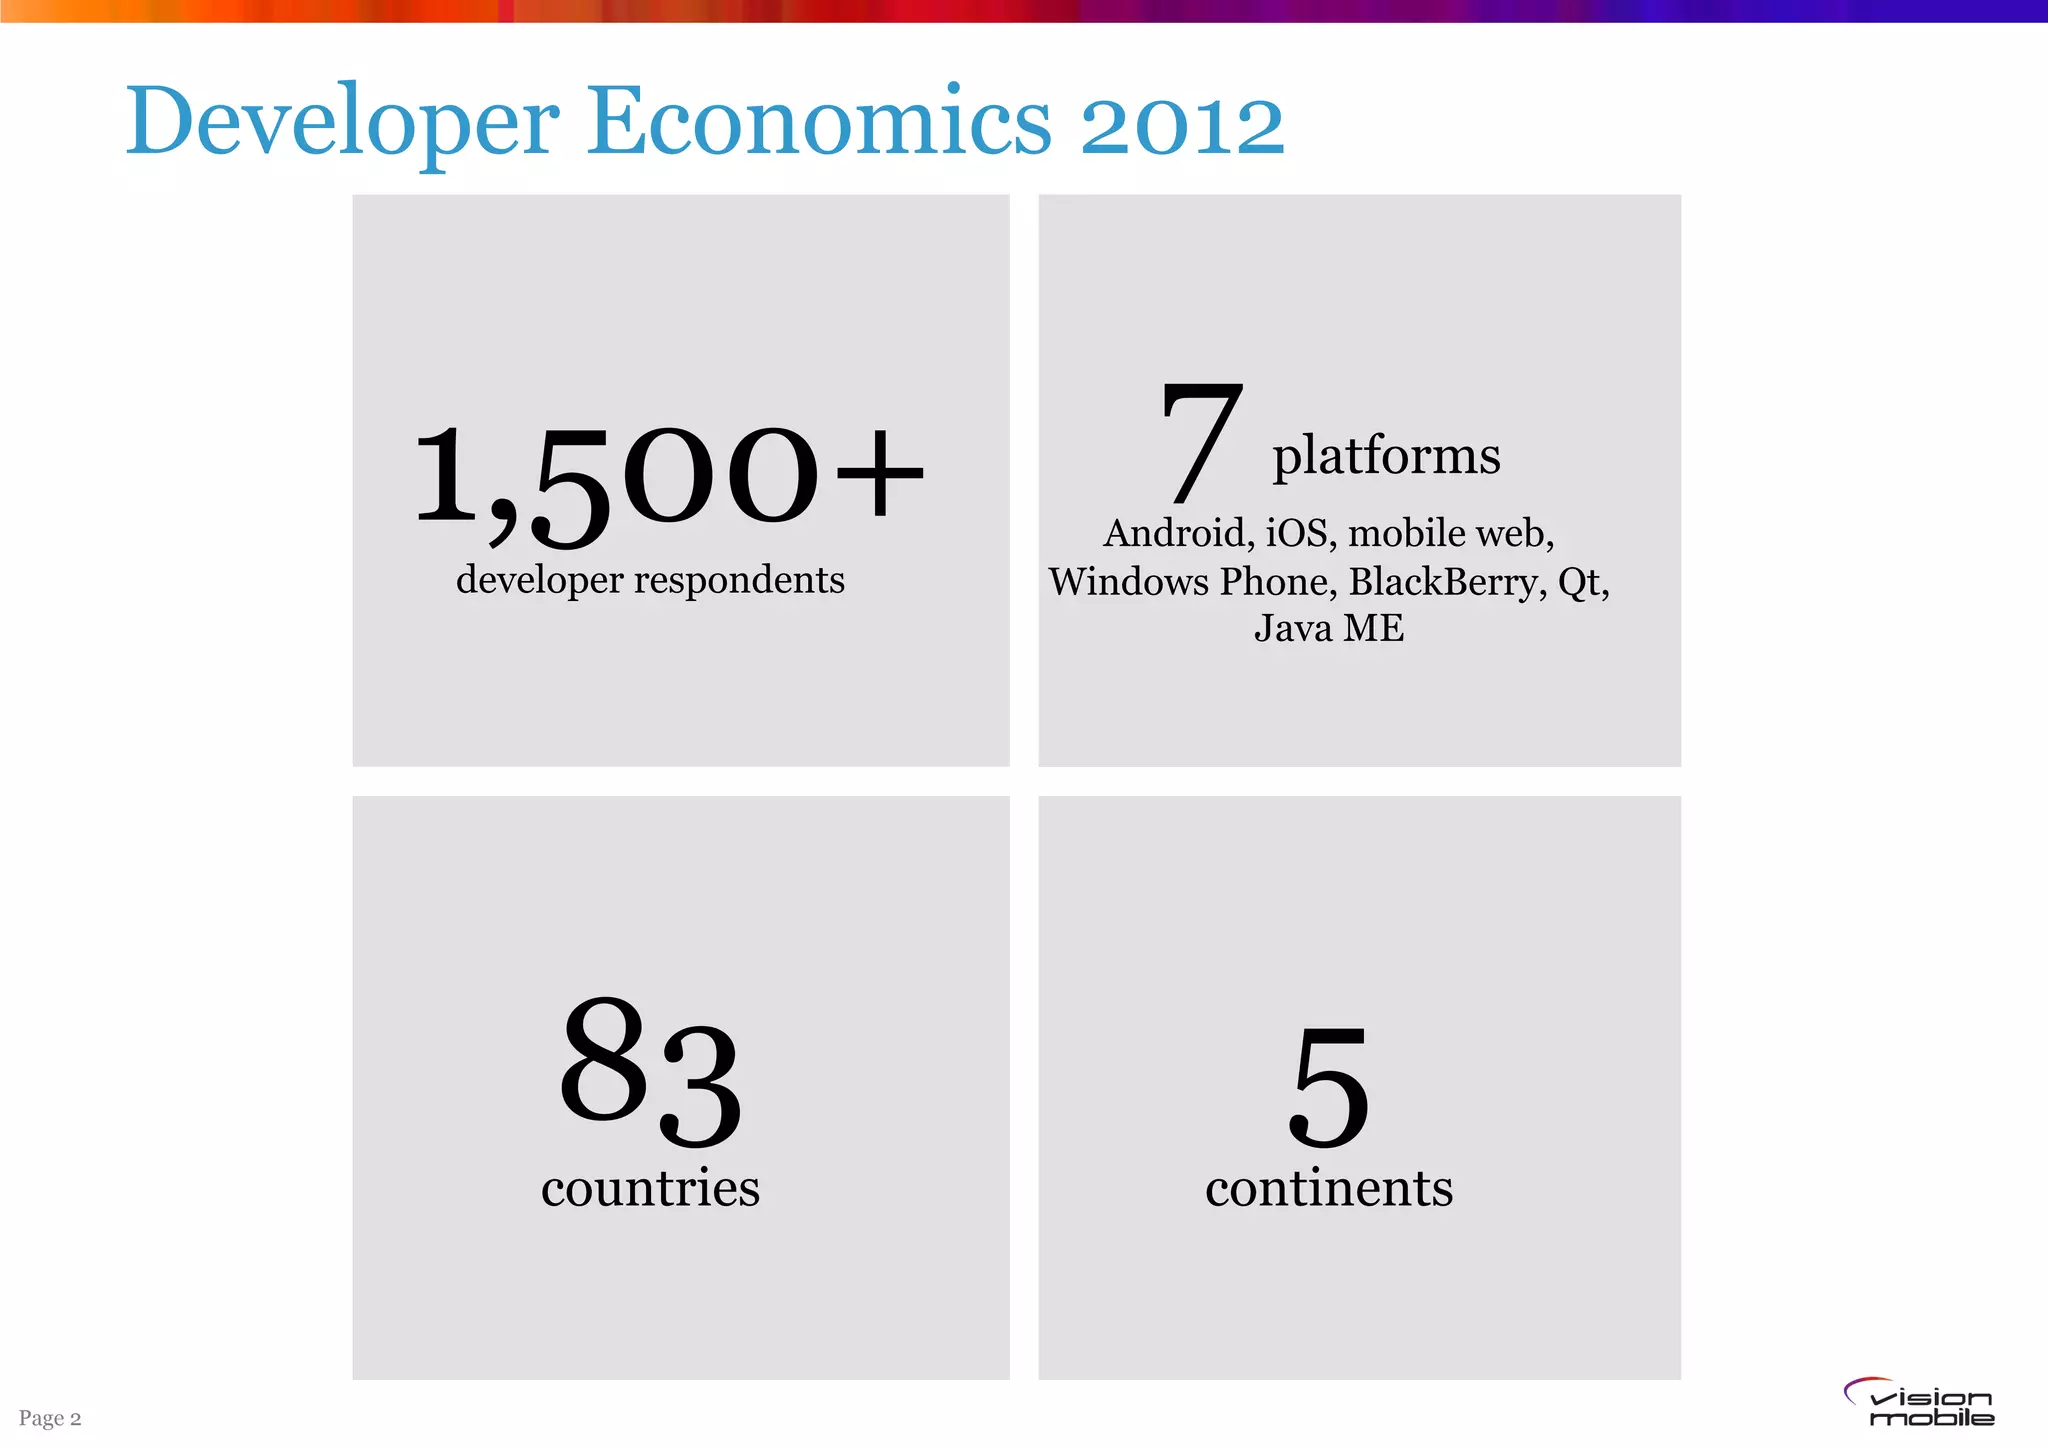
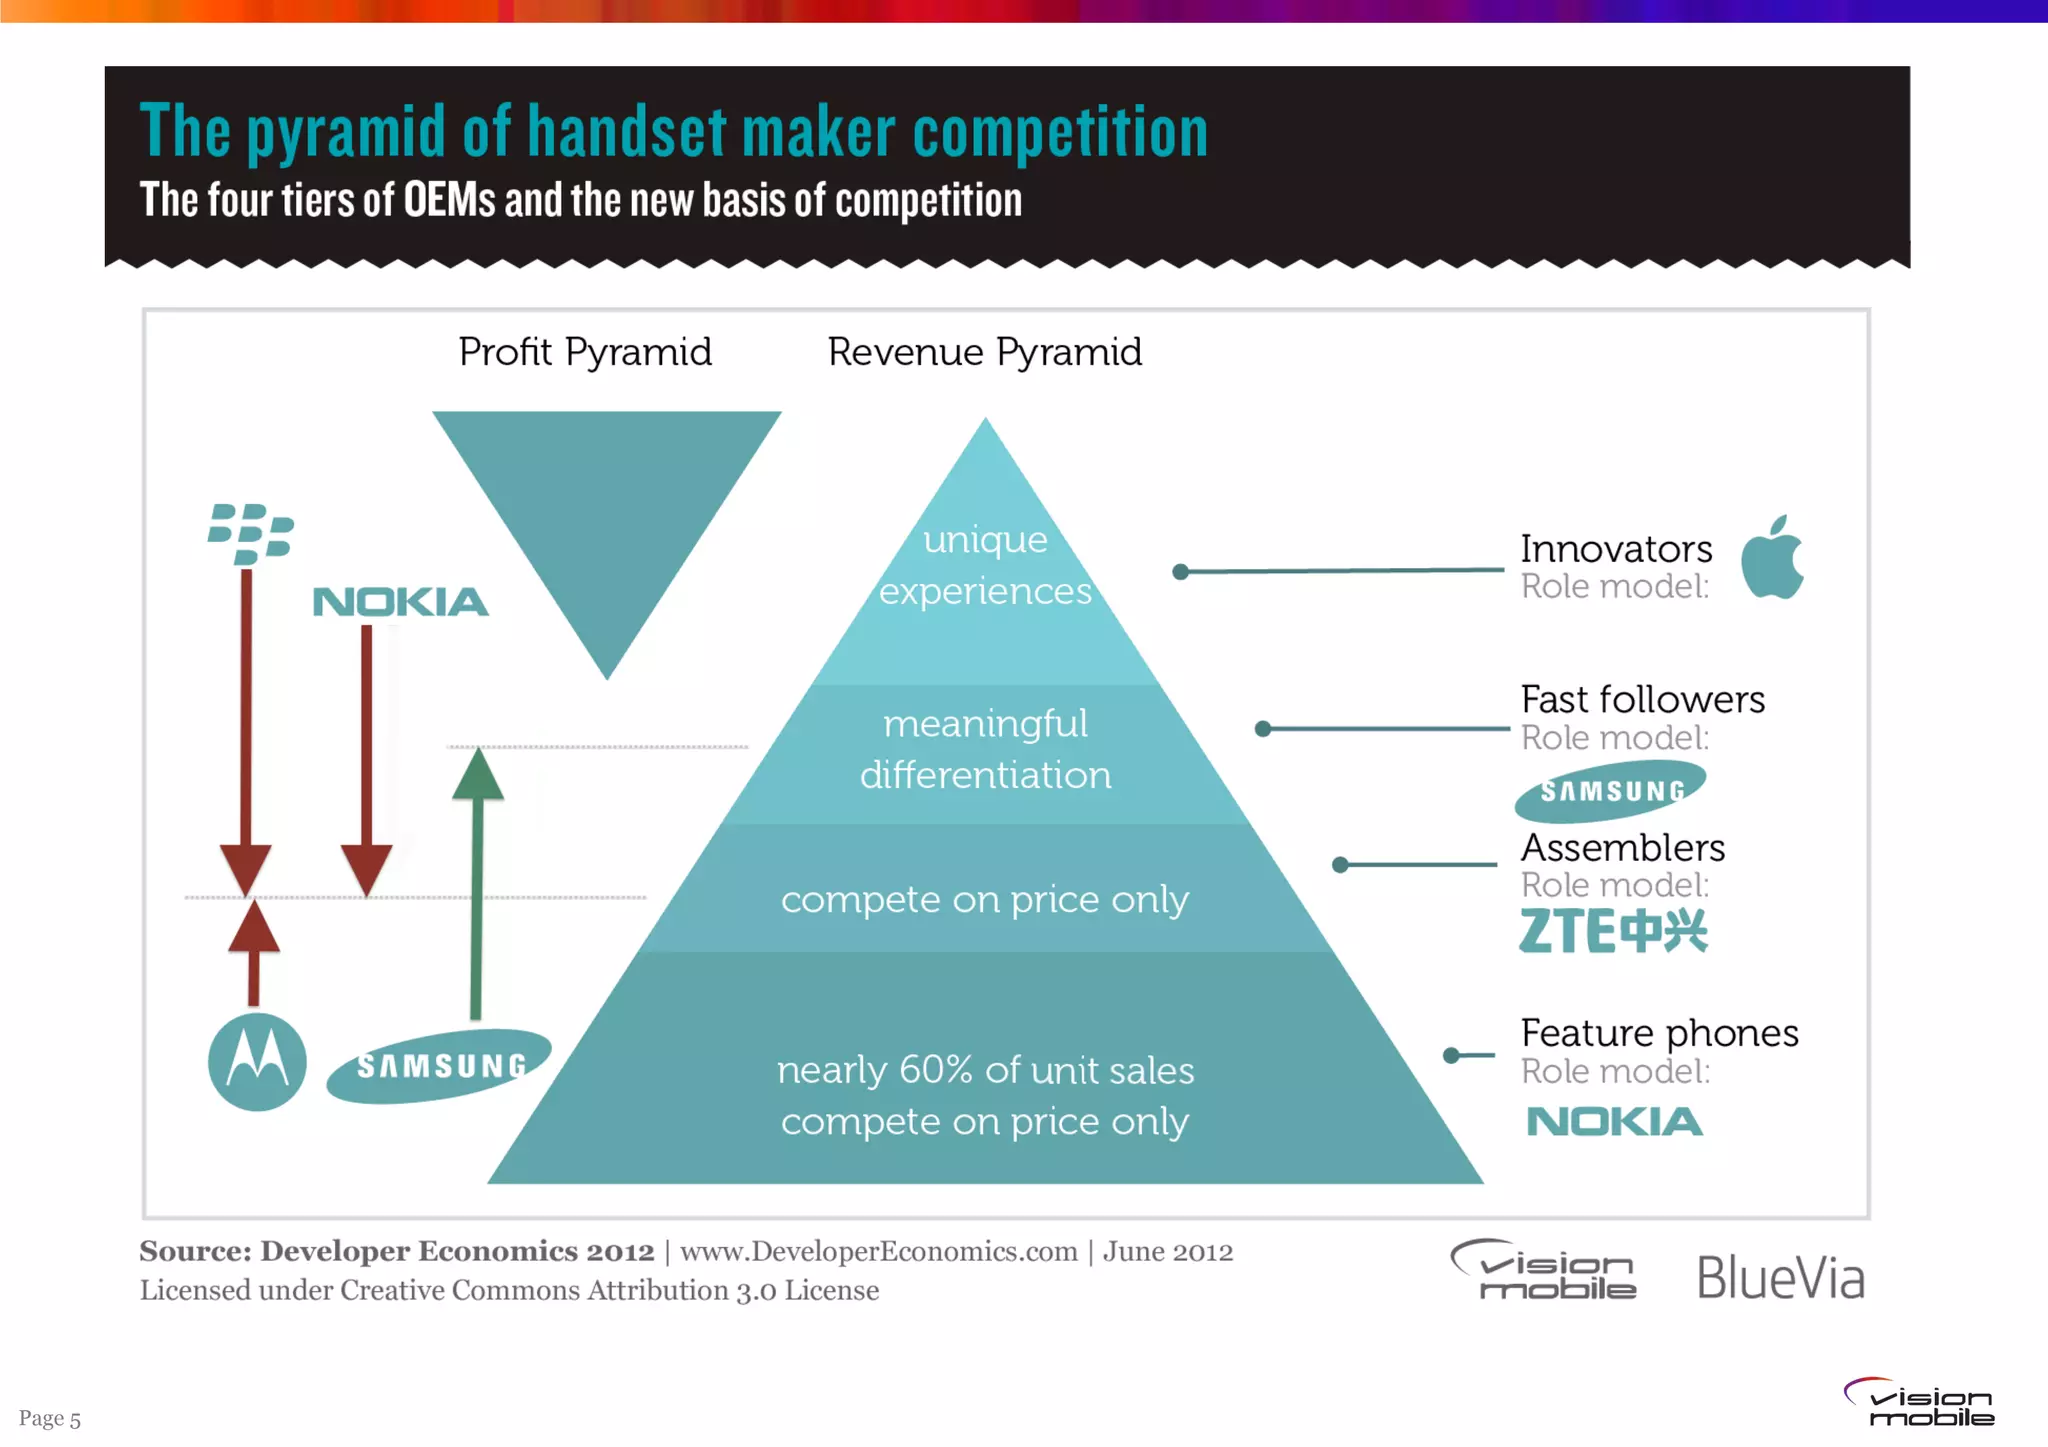
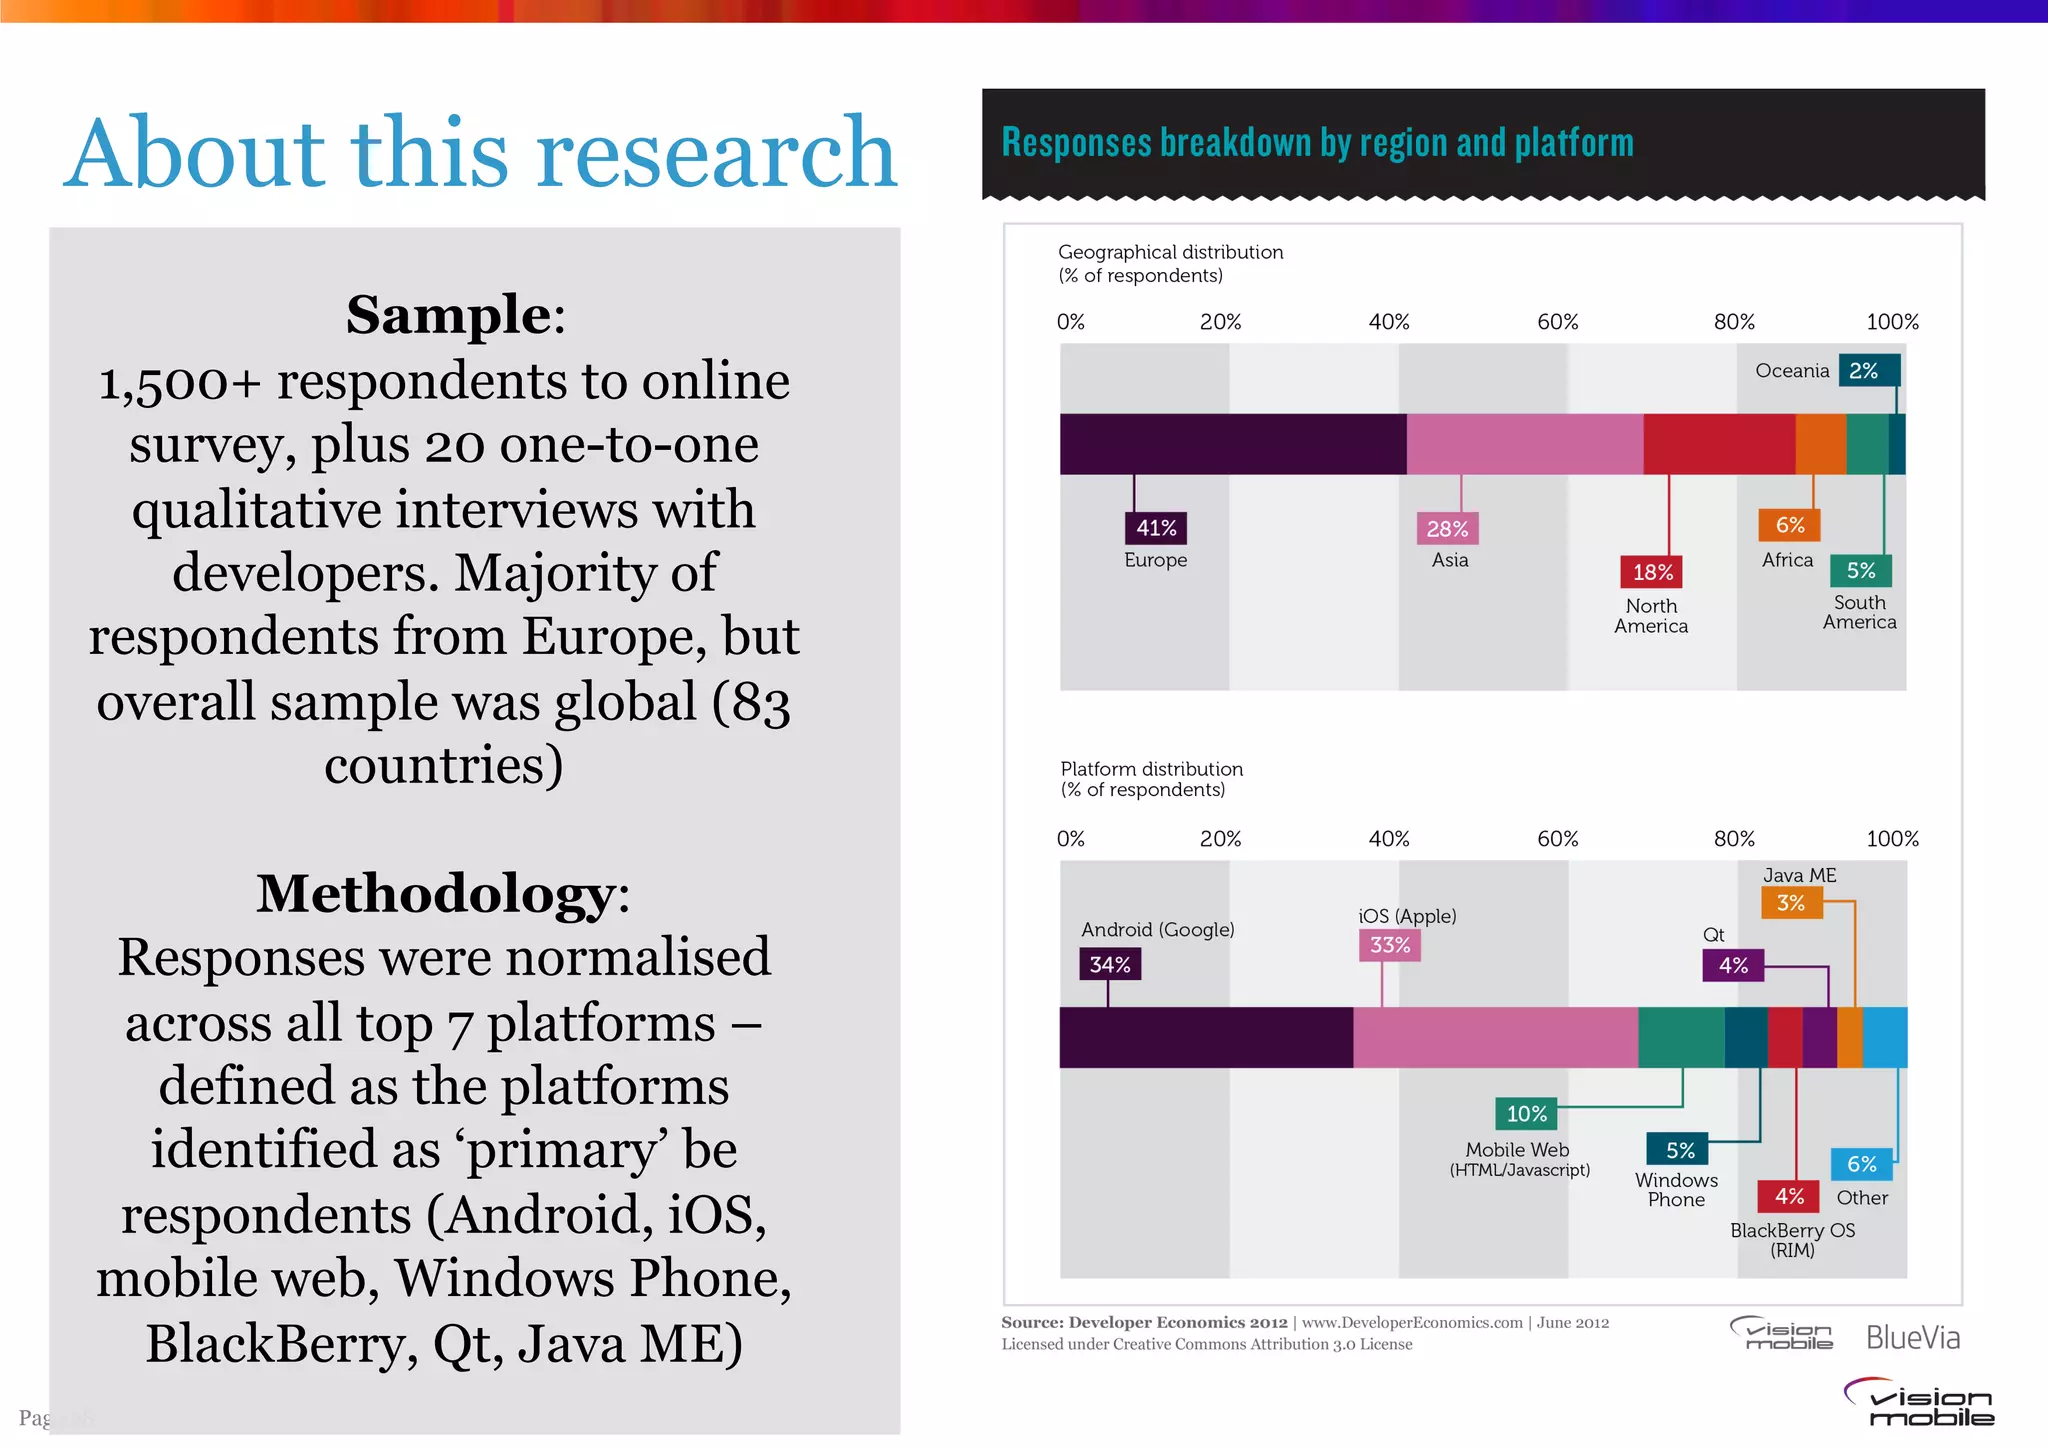
KEY INSIGHTS


Page 1
Developer Economics 2012


              1,500+                        7     platforms
                                         Android, iOS, mobile web,
               developer respondents   Windows Phone, BlackBerry, Qt,
                                                 Java ME


                    83                             5
                   countries                   continents


Page 2
Top 10 insights


Page 3
10
                       The new pyramid of
                    handset maker competition.
         In the new pyramid of handset maker competition, Apple leads innovators,
          Samsung leads fast-followers, ZTE leads assemblers and Nokia leads the
                                  feature phone market..


Page 4
Page 5
9
                 The next 10 million apps
         BRIC markets will drive app demand an order of magnitude
         larger as their smartphone penetration increases. The next 10
         million apps are not going to come from the current leading
         markets, but from BRIC demand for localised apps.


Page 6
Page 7
8
                    Tablets are now a
             mainstream screen for developers
          Irrespective of platform, more than 50% of developers are now
         targeting tablets, with iOS developers most likely (74%) to do so.


Page 8
Page 9
7
              Windows Phone is the new cool
              Interest among developers continues to build up. 57% of
                    developers, irrespective of platform, plan to adopt
                                     Windows Phone


Page 10
Page 11
6
              Mass exodus from second runners
            BREW (Qualcomm), Bada (Samsung), BlackBerry (RIM) are
          being rapidly abandoned. The developer exodus is a much greater
           and measurable testament to the decline than any other market
                                    indicator.


Page 12
Page 13
5
                 One in three developers live
                 below the “app poverty line”
               The average per-app revenue is in the range of $1,200-
              $3,900 per month. An app has a 35% chance of generating
                $1 – $500 per month, which means that one in three
                    developers live below the “app poverty line”


Page 14
Page 15
4
                   Developers struggle to
              identify the right revenue model
               There are 11 revenue models to pick and mix from, from
                  pay-per-download to product placements. In-app
              purchasing generating on average 24% more revenue than
               pay-per-download, 63% more than freemium and 78%
                                more than advertising.


Page 16
Page 17
3
                iOS most expensive platform
              to develop on at $27,000 per app
              iOS apps are costing 21% more than Android and 81% more
                  than Blackberry to make. The average app will take
                     approximately three man-months to develop.


Page 18
Page 19
2
                    The imbalance between
                   spoken vs. app languages
              85% of developers publishing in English address just 8%
               (around 500 million) of the world population speaking
                 English, while Chinese, spoken by 22% of the world
                    population, only attracts 16% of developers.


Page 20
Page 21
1
              Mapping the global app trade routes
                Developers in North America see relatively small demand from
                other regions, with Europe being their top export region. Latin
              America and Asia have a large share of developers (44% and 38%)
              that do not see high local demand - developers there mostly export
                              apps to North America and Europe.


Page 22
Page 23
Page 24
we‘re opening up the data to the world.


          full data.
          anonymised.
          visualised.
          live.


          Coming July 2nd
          DeveloperEconomics.com
Page 25
Knowledge. Passion. Innovation.


          Thank you!
           ✔ get in touch: andreas@visionmobile.com
           ✔ follow : @andreascon
           ✔ we ‘re hiring!


                                         Updated: 12 November 2010


Page 26                                    Copyright VisionMobile 2011
Appendix


Page 27
About this research
                  Sample:
      1,500+ respondents to online
        survey, plus 20 one-to-one
        qualitative interviews with
          developers. Majority of
      respondents from Europe, but
      overall sample was global (83
                 countries)

                 Methodology:
          Responses were normalised
           across all top 7 platforms –
             defined as the platforms
            identified as ‘primary’ be
           respondents (Android, iOS,
          mobile web, Windows Phone,
            BlackBerry, Qt, Java ME)
Page 28

Key insights from developer economics 2012

  • 1.
  • 2.
    Developer Economics 2012 1,500+ 7 platforms Android, iOS, mobile web, developer respondents Windows Phone, BlackBerry, Qt, Java ME 83 5 countries continents Page 2
  • 3.
  • 4.
    10 The new pyramid of handset maker competition. In the new pyramid of handset maker competition, Apple leads innovators, Samsung leads fast-followers, ZTE leads assemblers and Nokia leads the feature phone market.. Page 4
  • 5.
  • 6.
    9 The next 10 million apps BRIC markets will drive app demand an order of magnitude larger as their smartphone penetration increases. The next 10 million apps are not going to come from the current leading markets, but from BRIC demand for localised apps. Page 6
  • 7.
  • 8.
    8 Tablets are now a mainstream screen for developers Irrespective of platform, more than 50% of developers are now targeting tablets, with iOS developers most likely (74%) to do so. Page 8
  • 9.
  • 10.
    7 Windows Phone is the new cool Interest among developers continues to build up. 57% of developers, irrespective of platform, plan to adopt Windows Phone Page 10
  • 11.
  • 12.
    6 Mass exodus from second runners BREW (Qualcomm), Bada (Samsung), BlackBerry (RIM) are being rapidly abandoned. The developer exodus is a much greater and measurable testament to the decline than any other market indicator. Page 12
  • 13.
  • 14.
    5 One in three developers live below the “app poverty line” The average per-app revenue is in the range of $1,200- $3,900 per month. An app has a 35% chance of generating $1 – $500 per month, which means that one in three developers live below the “app poverty line” Page 14
  • 15.
  • 16.
    4 Developers struggle to identify the right revenue model There are 11 revenue models to pick and mix from, from pay-per-download to product placements. In-app purchasing generating on average 24% more revenue than pay-per-download, 63% more than freemium and 78% more than advertising. Page 16
  • 17.
  • 18.
    3 iOS most expensive platform to develop on at $27,000 per app iOS apps are costing 21% more than Android and 81% more than Blackberry to make. The average app will take approximately three man-months to develop. Page 18
  • 19.
  • 20.
    2 The imbalance between spoken vs. app languages 85% of developers publishing in English address just 8% (around 500 million) of the world population speaking English, while Chinese, spoken by 22% of the world population, only attracts 16% of developers. Page 20
  • 21.
  • 22.
    1 Mapping the global app trade routes Developers in North America see relatively small demand from other regions, with Europe being their top export region. Latin America and Asia have a large share of developers (44% and 38%) that do not see high local demand - developers there mostly export apps to North America and Europe. Page 22
  • 23.
  • 24.
  • 25.
    we‘re opening upthe data to the world. full data. anonymised. visualised. live. Coming July 2nd DeveloperEconomics.com Page 25
  • 26.
    Knowledge. Passion. Innovation. Thank you! ✔ get in touch: andreas@visionmobile.com ✔ follow : @andreascon ✔ we ‘re hiring! Updated: 12 November 2010 Page 26 Copyright VisionMobile 2011
  • 27.
  • 28.
    About this research Sample: 1,500+ respondents to online survey, plus 20 one-to-one qualitative interviews with developers. Majority of respondents from Europe, but overall sample was global (83 countries) Methodology: Responses were normalised across all top 7 platforms – defined as the platforms identified as ‘primary’ be respondents (Android, iOS, mobile web, Windows Phone, BlackBerry, Qt, Java ME) Page 28