Download to read offline

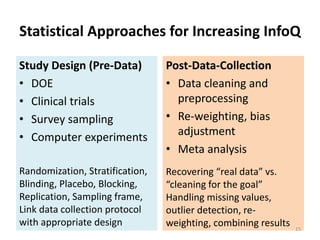
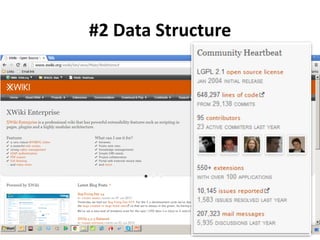


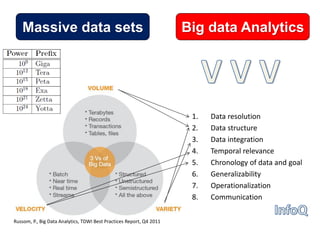
![Assessing InfoQ in Practice
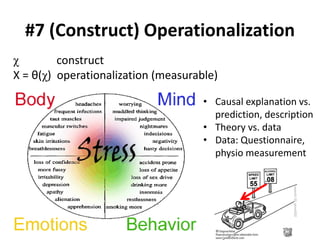
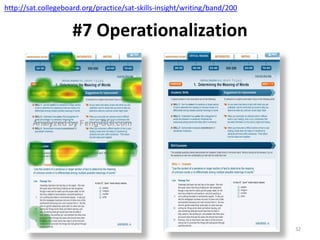
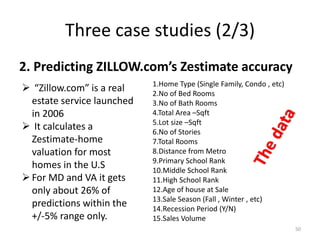
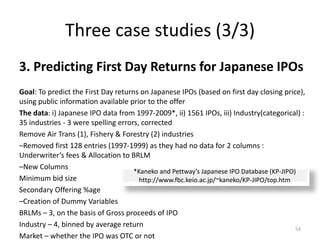
Rating-based assessment
1-5 scale on each dimension:
InfoQ Score = [d1(Y1) d2(Y2) … d8(Y8)]1/8
Experience from two research methods courses
– Preparing a PhD research proposal (U Ljubljana, 50
students, goo.gl/f6bIA)
– Post-hoc evaluation of five completed studies (CMU,
16 students, goo.gl/erNPF) 42
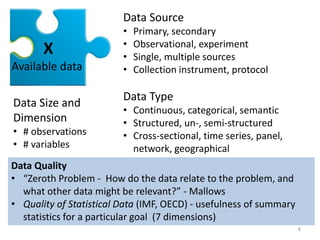
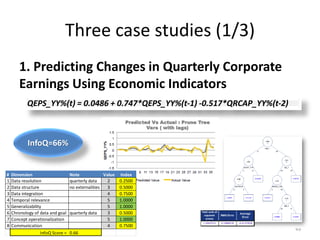
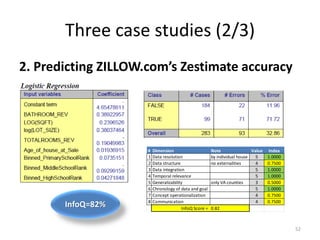
# Dimension Note Value Index
1 Data resolution 5 1.0000
2 Data structure 4 0.7500
3 Data integration 5 1.0000
4 Temporal relevance 5 1.0000
5 Generalizability 3 0.5000
6 Chronology of data and goal 5 1.0000
7 Concept operationalization 2 0.2500
8 Communication 3 0.5000
InfoQ Score = 0.68
InfoQ=68%](https://image.slidesharecdn.com/5fdebc21-b4d5-49df-905f-46a99aa8c2d5-150621203418-lva1-app6892/85/Kenett-On-Information-NYU-Poly-2013-42-320.jpg)
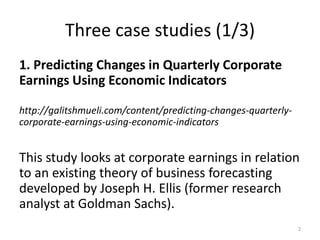
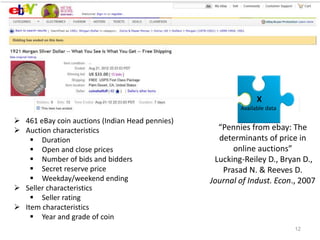
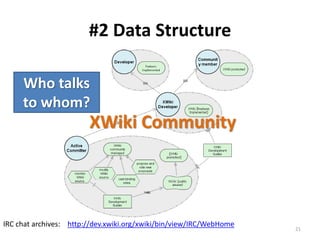
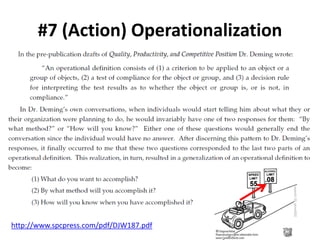
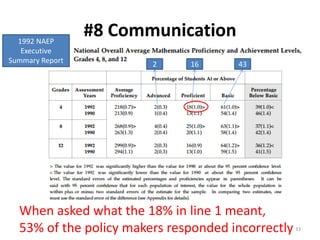
![Three case studies (1/3)
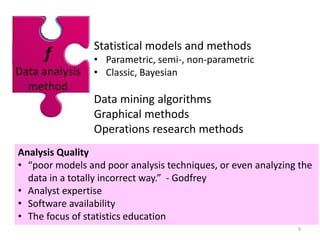
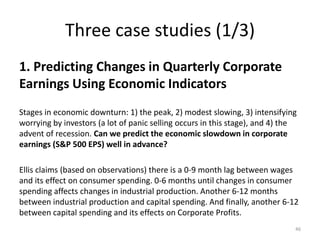
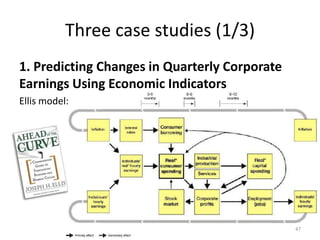
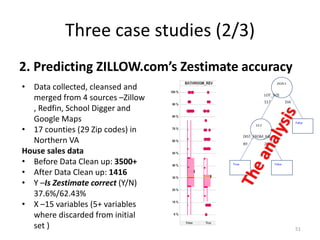
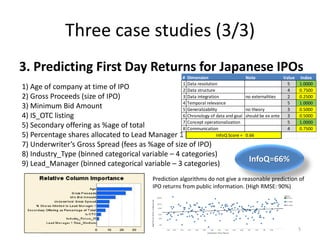
1. Predicting Changes in Quarterly Corporate
Earnings Using Economic Indicators
The data: i) 180 quarters. 6 [Economic] x variables. Ii) Change
in S&P EPS = y variable, iii) All variables transformed to year vs
year % change, iv( All data used is publicly available via websites
of US agencies: BEA, BLS, FED, and S&P.
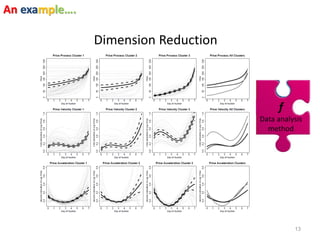
The analysis: XLMiner on these different versions of datasets.
Partitioned it. Ran predictor applications: ACF Plots, MLR,
Regression Tree – full and pruned.
48
Auto Correlation Chart. Based on this, took Lag_1
as one of the predictors. Lag_1 = QEPS_YY(Q-1)](https://image.slidesharecdn.com/5fdebc21-b4d5-49df-905f-46a99aa8c2d5-150621203418-lva1-app6892/85/Kenett-On-Information-NYU-Poly-2013-48-320.jpg)


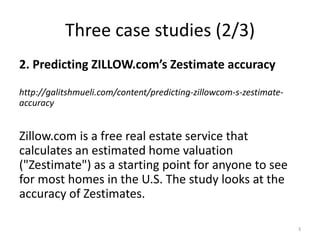
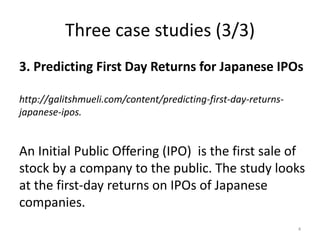
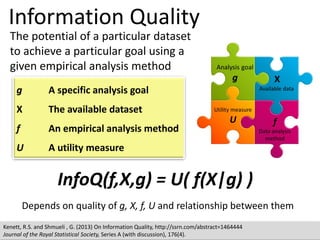
This document discusses three case studies that use data analysis methods to address financial and risk-related questions. The first case study looks at predicting changes in corporate earnings using economic indicators. The second predicts the accuracy of Zillow home valuation estimates. The third examines factors that influence returns on initial public offerings of Japanese companies. The document then discusses dimensions of information quality that can impact the ability of a given dataset and analysis method to achieve a specified goal.