Downloaded 111 times


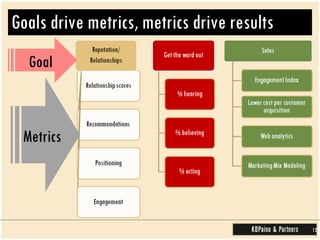

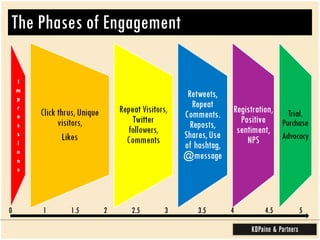
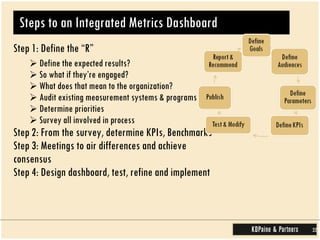
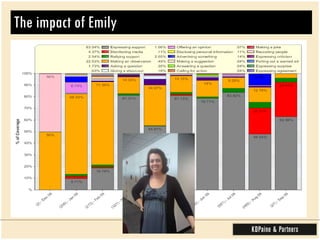
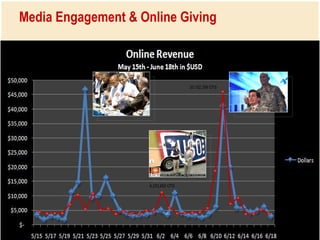


This document provides guidance on measuring the effectiveness of social media and public relations efforts through key performance indicators (KPIs). It recommends defining clear objectives, agreeing on investments, establishing benchmarks, selecting relevant KPIs like engagement, sentiment, and cost metrics. Common tools for measurement include web analytics, surveys, and content analysis. Setting goals drives the choice of right metrics to improve results over time.


