Nach einem eher verhaltenen Jahr 2013 nahmen 2014 M&A-Transaktionen in der Öl- und Gasindustrie deutlich zu. Angesichts des weiter sinkenden Ölpreises und der Entscheidung der OPEC gegen eine Drosselung der Fördermengen werden 2015 noch intensivere M&A-Aktivitäten in der gesamten Wertschöpfungskette stattfinden. Diese strategischen Deals sind für die Unternehmen wichtig, um Wertzuwächse zu erzielen, sich für kommende Marktturbulenzen zu rüsten und die Wettbewerbslandschaft zu ihren Gunsten zu formen.
This is an example of an investment memo for a consumer products company, Kraft Heinz. This does not constitute investment advice and is an outdated valuation. This should only serve educational purposes.
Duff & Phelps and the Financial Executives Research Foundation (“FERF”) first published the results of their comprehensive Goodwill Impairment Study in 2009. This inaugural study examined U.S. publicly-traded companies’ recognition of goodwill impairment at the height of the financial crisis (the end of 2008 and the beginning of 2009), and featured a comparative analysis of the goodwill impairments of over 5,000 companies (by industry), as well as the findings of a survey of Financial Executives International (“FEI”) members.
CommerceTel Corporation ($MFON) was listed in the "Top Picks" for communications technology in the January 18, 2012 issue of Dick Davis Investment Digest.
Running Head FINANCIAL RESEARCH REPORT1FINANCIAL RESEARCH RE.docxwlynn1
Running Head: FINANCIAL RESEARCH REPORT 1
FINANCIAL RESEARCH REPORT 7
Financial Research Report
Chet L. Walker
Strayer University
Dr. Inez Black
FIN 534 – Financial Management
24 May 2020
Financial Research Report
As the child of a recent retiree on a fixed income, I understand how much my mother worked for money. With that in mind, she would not be willing to work so hard for so long to frivolously squander it away in her twilight years casing risky investments. At the same time, due to her health needs, I know that I would want to make sure her money worked for her on a level to ensure she can get the care she needs without wondering how she will pay for medication or deductibles. With that in mind, I would want to find the optimum stock for her to invest in.
Since she does not have the disposable income or time to recover from a huge loss, I would suggest she invest in intermediate-cap or large-cap company, and attempt to avert little-caps names altogether. The reason startups give such high returns is because they are indeed risky investments. She has a great of a chance of bottoming out as she would striking it big. Even though some small firms would suit the older individual’s investing framework, most of her picks should follow this advice (Bunker, Cagle & Harris, 2019). Moreover, if you are participating in "best of breed" firms and unique brands which conform to the rules of Graham and Buffet investing thoughts should not be a challenge.
The next criteria I would use to help her pick a stock would be to find a stock that is a robust past performer. It may not give double-digit returns every year, and it can even be subject to an occasional lousy quarter. The overall thought process is the long-term plan has to be persuasive. I would want her to invest in a business that has made shareholders rich while avoiding a stock that has ruined stockholder value in the long run. She should invest in stocks that meet the metrics as mentioned earlier, and that has done well over a considerable duration.
Once we weed out the type of stocks to focus on, it’s now time to zero in on a particular company. I would advise her to invest in a stock that offers a simple, reasonably direct company business model. These companies usually provide a good or service that is easily understood and extremely recognizable. Since she is not an industry expert, she should avoid companies that other investors might find complicated. That company should also be considered "best in the breed."
These companies are among the best in their industry. The general rule of thumb is it is best to stick with excellent, permeating, and highly-admired brands. Additionally, if you look at the best stocks in past, have a great brand as an everyday thing. If one is looking for rapidly-emerging brands, it should not be difficult to trace one that has an antiquity of better performance. Most firms that suit this outline have a tremendous continuing traje.
The past few months stock markets have seen some unusual phenomena. Stocks at the brink of bankruptcy surged, relatively unknown stocks that have stock acronyms similar to those of large companies were rising. Pandemic buzzword stocks exploded. There is a force that is moving the stock market, it’s not the fed, it’s not the hedge funds. It’s an army of amateur traders using the zero-commission trading app Robinhood disrupting long-standing norms in capital markets.
So how do you value the share price of stock for a given company? In other words, what is the intrinsic value of a given stock? Generally speaking, a stock is valued based on the company’s current financial state and what the market believes the company’s future financial state will look like. https://carnick.com/
This paper is due TODAY AT 10.30 PM no later.Complete the follow.docxbrockdebroah
This paper is due TODAY AT 10.30 PM no later.
Complete
the following:
Case Problem 6.1 A-C (page 252)
Case Problem 6.2 A-C (page 252)
Case Problem 7.1 A-C (page 293)
Case Problem 7.2 A-C (page 294)
Case Problem 8.1 A-B (page 332)
Case Problem 8.2 A-B (page 333)
Case Problem 9.2 A-C (page 374)
Format
your submission consistent with APA guidelines.
Case problem 6.1 A-C
Case Problem
6.1
Sara Decides to Take the Plunge
1.
LG
1
2.
LG
6
Sara Thomas is a child psychologist who has built a thriving practice in her hometown of Boise, Idaho. Over the past several years she has been able to accumulate a substantial sum of money. She has worked long and hard to be successful, but she never imagined anything like this. Even so, success has not spoiled Sara. Still single, she keeps to her old circle of friends. One of her closest friends is Terry Jenkins, who happens to be a stockbroker and who acts as Sara’s financial advisor.
Not long ago Sara attended a seminar on investing in the stock market, and since then she’s been doing some reading about the market. She has concluded that keeping all of her money in low-yielding savings accounts doesn’t make sense. As a result, Sara has decided to move part of her money to stocks. One evening, Sara told Terry about her decision and explained that she had found several stocks that she thought looked “sort of interesting.” She described them as follows:
·
North Atlantic Swim Suit Company.
This highly speculative stock pays no dividends. Although the earnings of NASS have been a bit erratic, Sara feels that its growth prospects have never been brighter—“what with more people than ever going to the beaches the way they are these days,” she says.
·
Town and Country Computer.
This is a long-established computer firm that pays a modest dividend yield (of about 1.50%). It is considered a quality growth stock. From one of the stock reports she read, Sara understands that T&C offers excellent long-term growth and capital gains potential.
·
Southeastern Public Utility Company.
This income stock pays a dividend yield of around 5%. Although it’s a solid company, it has limited growth prospects because of its location.
·
International Gold Mines, Inc.
This stock has performed quite well in the past, especially when inflation has become a problem. Sara feels that if it can do so well in inflationary times, it will do even better in a strong economy. Unfortunately, the stock has experienced wide price swings in the past. It pays almost no dividends.
Questions
a.
What do you think of the idea of Sara keeping “substantial sums” of money in savings accounts? Would common stocks make better investments for her than savings accounts? Explain.
b.
What is your opinion of the four stocks Sara has described? Do you think they are suitable for her investment needs? Explain.
c.
What kind of common stock investment program would you recommend for Sara? What investment objectives do you think she should set for hers.
Exceptional Stock Market returns in Turbulent TimesAtul Khekade
This paper discusses historic patterns of Micro and Macro decisions and environment where the stocks have fetched exceptional returns in spite of the turbulent economic environment.
Building Your Employer Brand with Social MediaLuanWise
Presented at The Global HR Summit, 6th June 2024
In this keynote, Luan Wise will provide invaluable insights to elevate your employer brand on social media platforms including LinkedIn, Facebook, Instagram, X (formerly Twitter) and TikTok. You'll learn how compelling content can authentically showcase your company culture, values, and employee experiences to support your talent acquisition and retention objectives. Additionally, you'll understand the power of employee advocacy to amplify reach and engagement – helping to position your organization as an employer of choice in today's competitive talent landscape.
Understanding User Needs and Satisfying ThemAggregage
https://www.productmanagementtoday.com/frs/26903918/understanding-user-needs-and-satisfying-them
We know we want to create products which our customers find to be valuable. Whether we label it as customer-centric or product-led depends on how long we've been doing product management. There are three challenges we face when doing this. The obvious challenge is figuring out what our users need; the non-obvious challenges are in creating a shared understanding of those needs and in sensing if what we're doing is meeting those needs.
In this webinar, we won't focus on the research methods for discovering user-needs. We will focus on synthesis of the needs we discover, communication and alignment tools, and how we operationalize addressing those needs.
Industry expert Scott Sehlhorst will:
• Introduce a taxonomy for user goals with real world examples
• Present the Onion Diagram, a tool for contextualizing task-level goals
• Illustrate how customer journey maps capture activity-level and task-level goals
• Demonstrate the best approach to selection and prioritization of user-goals to address
• Highlight the crucial benchmarks, observable changes, in ensuring fulfillment of customer needs
Best practices for project execution and deliveryCLIVE MINCHIN
A select set of project management best practices to keep your project on-track, on-cost and aligned to scope. Many firms have don't have the necessary skills, diligence, methods and oversight of their projects; this leads to slippage, higher costs and longer timeframes. Often firms have a history of projects that simply failed to move the needle. These best practices will help your firm avoid these pitfalls but they require fortitude to apply.
3 Simple Steps To Buy Verified Payoneer Account In 2024SEOSMMEARTH
Buy Verified Payoneer Account: Quick and Secure Way to Receive Payments
Buy Verified Payoneer Account With 100% secure documents, [ USA, UK, CA ]. Are you looking for a reliable and safe way to receive payments online? Then you need buy verified Payoneer account ! Payoneer is a global payment platform that allows businesses and individuals to send and receive money in over 200 countries.
If You Want To More Information just Contact Now:
Skype: SEOSMMEARTH
Telegram: @seosmmearth
Gmail: seosmmearth@gmail.com
The 10 Most Influential Leaders Guiding Corporate Evolution, 2024.pdfthesiliconleaders
In the recent edition, The 10 Most Influential Leaders Guiding Corporate Evolution, 2024, The Silicon Leaders magazine gladly features Dejan Štancer, President of the Global Chamber of Business Leaders (GCBL), along with other leaders.
An introduction to the cryptocurrency investment platform Binance Savings.Any kyc Account
Learn how to use Binance Savings to expand your bitcoin holdings. Discover how to maximize your earnings on one of the most reliable cryptocurrency exchange platforms, as well as how to earn interest on your cryptocurrency holdings and the various savings choices available.
Recruiting in the Digital Age: A Social Media MasterclassLuanWise
In this masterclass, presented at the Global HR Summit on 5th June 2024, Luan Wise explored the essential features of social media platforms that support talent acquisition, including LinkedIn, Facebook, Instagram, X (formerly Twitter) and TikTok.
Anny Serafina Love - Letter of Recommendation by Kellen Harkins, MS.AnnySerafinaLove
This letter, written by Kellen Harkins, Course Director at Full Sail University, commends Anny Love's exemplary performance in the Video Sharing Platforms class. It highlights her dedication, willingness to challenge herself, and exceptional skills in production, editing, and marketing across various video platforms like YouTube, TikTok, and Instagram.
Tata Group Dials Taiwan for Its Chipmaking Ambition in Gujarat’s DholeraAvirahi City Dholera
The Tata Group, a titan of Indian industry, is making waves with its advanced talks with Taiwanese chipmakers Powerchip Semiconductor Manufacturing Corporation (PSMC) and UMC Group. The goal? Establishing a cutting-edge semiconductor fabrication unit (fab) in Dholera, Gujarat. This isn’t just any project; it’s a potential game changer for India’s chipmaking aspirations and a boon for investors seeking promising residential projects in dholera sir.
Visit : https://www.avirahi.com/blog/tata-group-dials-taiwan-for-its-chipmaking-ambition-in-gujarats-dholera/
B2B payments are rapidly changing. Find out the 5 key questions you need to be asking yourself to be sure you are mastering B2B payments today. Learn more at www.BlueSnap.com.
LA HUG - Video Testimonials with Chynna Morgan - June 2024Lital Barkan
Have you ever heard that user-generated content or video testimonials can take your brand to the next level? We will explore how you can effectively use video testimonials to leverage and boost your sales, content strategy, and increase your CRM data.🤯
We will dig deeper into:
1. How to capture video testimonials that convert from your audience 🎥
2. How to leverage your testimonials to boost your sales 💲
3. How you can capture more CRM data to understand your audience better through video testimonials. 📊
LA HUG - Video Testimonials with Chynna Morgan - June 2024
Kase capital-q1-2013
1. Whitney R. Tilson phone: 212 277 5606
Managing Partner WTilson@KaseCapital.com
April 3, 2013
Dear Partner:
Our fund is off to a solid start to the year, rising 6.7% in the first quarter vs. 10.6% for the S&P
and 11.9% for the Dow.
The fund s returns were driven by nice gains across most of the long portfolio, with a special
mention for Netflix, which more than doubled. Here is the Q1 performance of all 11 long stock
positions in the fund as of the beginning of the year (disclosed in the 2012 annual letter), plus
two new stocks I bought during the quarter (ranked in descending order of current size):
1. AIG 10.0%
2. Berkshire Hathaway 16.6%
3. Howard Hughes 14.8%
4. Deckers 34.9%*
5. Citigroup 11.8%
6. Goldman Sachs 15.4%
7. Netflix 104.4%
8. Canadian Pacific 28.4%
9. dELiA*s -15.4%
10. Iridium -10.3%
11. Grupo Prisa (B) 16.0%
12. Sears Hometown & Outlet Stores -5.2%*
13. Spark Networks -9.7%
* Performance since the position was established. Note that this excludes two private placements in Spencer Holdings and the
Japan side fund.
The two headwinds to the portfolio during the quarter (both discussed below) were cash, which
comprised about a third of the fund, and the short book, which averaged approximately 20% of
the fund. The fund is currently 66% long and 22% short.
Two New Long Positions: Deckers and Sears Hometown & Outlet Stores
I m pleased that I was able to identify two compelling new stocks to add to our portfolio during
the quarter a satisfactory pace in light of the complacent market in which the major indices are
near all-time highs.
Deckers
Deckers is best known for its UGG brand, which accounted for 95% of sales last quarter. The
brand has been around since California surfers started wearing UGG boots in the late 1970s, but
UGGs really became a fashion trend (some would say a fad) a few years ago, which resulted in
the stock soaring nearly 10-fold from early 2009 to late 2011, peaking at close to $120. And then
Carnegie Hall Tower, 152 West 57th Street, 46th Floor, New York, NY 10019
2. the bottom fell out. The company reported steadily worse results as 2012 progressed and the
stock plunged to under $30 by the end of last October.
Even at its low point, however, the company was not only profitable, but had double-digit profit
margins, high returns on equity, and a strong balance sheet, so the question for investors was: are
UGGs a fad that will largely disappear (think Heelys), as the many people who are short the
stock believe (short interest was 40.5% of the float as of 3/15/13), or will UGGs prove to be an
enduring brand that s simply encountered some short-term turbulence? If so, then the stock
which was around $40 when I was analyzing the company two months ago trading at just over
10x depressed earnings, was a bargain.
The company attributed its weak results to three primary factors:
1. One of the warmest winters ever in 2011;
2. The price of sheepskin (the primary raw material in UGG boots) rising 80% due to floods
in Australia that decimated sheep herds; and
3. The economic weakness in Europe.
These are all true statements but was the company just making excuses to cover up the fact that
the fad had passed and nobody wanted to wear UGGs anymore? To answer this question, I
designed a survey (click here to see it) and sent it out to my various email lists. The 274
responses (posted here) I received were very revealing:
60% of respondents owned UGGs classic sheepskin boots, 48% owned more than one
UGGs product, and 78% had owned an UGGs product for at least two years.
When asked how highly they would recommend UGGs to a friend (on a scale of 1-10),
25% gave UGGs a perfect 10 and an additional 45% rated UGGs 7-9. 70% said they were
certain (25%) or likely (35%) to buy UGGs again. These are satisfied customers.
When asked whether they view their Uggs more as a fashion product or a
utilitarian/functional product, 74% said the latter, and when asked how their views
about Uggs changed over the past year, 65% said no change, 20% said more positive,
and only 15% said more negative. These responses are not consistent with a fad product
that s going away.
The comments in the open response part of the survey also reinforced my thesis that most
customers love their UGGs and would continue to buy, wear, and recommend them.
The survey was the final piece of evidence that confirmed my investment thesis that, while
UGGs may have become faddish for a while, the core brand and products were strong and
Deckers was mostly suffering from short-term issues, so I purchased the stock, which has risen
34.9% in the two months since then.
Sears Hometown & Outlet Stores
I also added Sears Hometown & Outlet Stores (SHOS) to the portfolio during the quarter. Last
October, Sears Holdings spun off SHOS, which is comprised of four divisions:
-2-
3. Sears Outlet: 127 warehouse style stores, all but three of which are company owned,
selling mostly scratched, dented, refurbished and old model appliances at steep discounts;
$564 million in sales and $42.1 million in operating income in 2012;
Sears Hometown Stores: 943 stores, all but one operated by franchisees, selling mostly
appliances, lawn & garden, and tools, typically in small, rural markets (average store
size: 8,500 sq. ft.) in all 50 states, Puerto Rico and Bermuda;
Sears Hardware Stores: 90 stores in 16 states, 33 company owned, 57 franchised,
selling similar merchandise as Hometown stores, but in bigger markets (average store
size: 28,000 sq. ft.), similar to ACE Hardware;
Sears Home Appliance Showrooms: 85 stores in 22 states, 27 company owned, 58
franchised, selling strictly appliances in a 5,000 sq. ft. showroom.
The latter three, under the Sears Hometown and Hardware segment, had sales of $1.9 billion and
operating income of $57.4 million in 2012.
This might not sound like a good business, but keep in mind that 85% of the company s 1,245
total stores are franchised, meaning the franchisees put up the money and do the hard work,
while the SHOS simply collects a royalty on all this effort an excellent business.
SHOS has strong growth potential management has indicated that the company could more
than double its store count to 3,000 stores. As an independent company, management now has
appropriate incentives, and SHOS is also benefitting from Sears closing large numbers of its
mainline stores (it closed 1,462 stores in FY 2012, 36% of its total). In fact, given that Sears s
controlling shareholder and CEO, Eddie Lampert, owns a 62% stake in SHOS (larger than
Lampert s 56% stake in Sears itself), it appears that Lampert may be quietly adopting a strategy
of closing unprofitable full-size Sears stores and effectively transferring to SHOS the sales (and
profits) of Sears s best businesses, its appliances and other hard goods sold under top brands like
Kenmore and Craftsman. If so, this will provide a substantial long-term tailwind to SHOS, as
Sears had $40 billion in sales in 2012 vs. only $2.5 billion for SHOS.
If SHOS is such an attractive company, why is it only my 12th largest position (approximately
2%)? The answer is valuation. By the time I discovered this investment, the stock had run up
from under $30 at the time of the spinoff to over $40, leaving less margin of safety. At its current
price of $40, the company has an enterprise value of around $1 billion vs. 2012 operating income
of $99.5 million and adjusted EBITDA of $109.8 million. I think earnings will grow
substantially in years to come, so 9x trailing EBITDA is a reasonable multiple, but it s not cheap
enough to make it a full position so I ve established a starter position and am hoping the market
gives me the opportunity at some point to buy a lot more at a better price.
Short Book
Here is the first quarter performance of the three shorts I disclosed in my 2012 annual letter:
1. InterOil 37.1%
2. K-12 18.0%
3. Nokia -17.0%
-3-
4. Their performance was quite representative of the 10 stocks that comprise our current short book
while a few worked, most ran up along with the market. I remain highly confident that every
one of our short positions is vastly overvalued and there are catalysts that will cause the stocks to
tumble, but over a short period when the market is ripping upward and complacency abounds,
our short book is going to be a headwind.
Thoughts on Q1 Performance, Risks, and the Sustainability of Corporate Profit M argins
In the first sentence of this letter, I describe our Q1 performance as solid. In light of the fact
that our fund trailed the major indices, some might challenge this view, so allow me to explain.
First and foremost, my goal is to preserve capital and, secondly, to earn a satisfactory rate of
return. I achieved both of these objectives in Q1 hence the word solid. In general, our fund
will likely not keep up with the market when it is rising rapidly because I usually hold some cash
and always have a decent-sized short book.
This is not an ideal environment for a value investor like me because to find wonderful bargains
it helps to have some distress in the market or at least some area of the market but there s
very little of this today. The major indices are at or near all-time highs and, for example, the
VIX, a volatility measure of the S&P 500, dropped 30% during the first quarter. Nevertheless,
I spend almost all of my time doing bottoms-up analysis of companies and industries, but as I
construct the overall portfolio and determine how aggressively or conservatively to position the
fund, I am guided by Buffett s simple maxim: Be fearful when others are greedy and greedy
when others are fearful.
ck market bubble (the bond market is
another matter!), but our fund is quite conservatively positioned right now because valuations are
full, complacency is high, and bargains are scarce and there are plenty of things that could
change this. In addition to the usual risk factors (a tepid economy recovery in the U.S., possibly
dependent on unsustainable money printing and deficit spending; the ongoing recession in
Europe; a potential mother-of-all-real-estate/infrastructure bubbles bursting in China; and a
bankrupt Japan), who was even thinking about the risks associated with Cyprus or war breaking
out on the Korean Peninsula until very recently? Donald Rumsfeld
well.
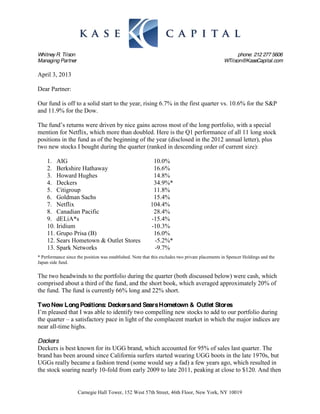
The critical question for U.S. stocks is whether corporate profit margins can remain at today s
all-time-high levels. This chart shows profit margins (before depreciation, interest, and tax, as a
percent of output) going back to 1929:
-4-
5. As you can see, historically, when margins have peaked, they ve soon reverted to the mean. If
this happens again, stocks could be in for some rough sledding. If so, I believe we are well
positioned to take advantage due to our significant cash balance and relatively low market
exposure.
Privacy Policy and Updated Form ADV
Once a year, we are required to send you a copy of our Privacy Policy, so it s attached in
Appendix A. In addition, our latest Form ADV is posted at: www.tilsonfunds.com/ADV.pdf.
Conclusion
Thank you for your confidence and support. If you have any comments or questions, please call
me anytime on my cell phone at (646) 258-0687.
Sincerely yours,
Whitney Tilson
-5-
6. The unaudited return for the Kase Fund versus major benchmarks (including reinvested
dividends) is:
Q1 Since Inception
Kase Fund net 6.7% 124.7%
S&P 500 10.6% 65.7%
Dow 11.9% 121.6%
Past performance is not indicative of future results. Please refer to the disclosure section at the end of this letter. The Kase Fund
was launched on 1/1/99.
Kase Fund Performance (Net) Since I nception
200
180
160
140
120
100
(% ) 80
60
40
20
0
-20
-40
Jan-99 Jan-00 Jan-01 Jan-02 Jan-03 Jan-04 Jan-05 Jan-06 Jan-07 Jan-08 Jan-09 Jan-10 Jan-11 Jan-12 Jan-13
Kase Fund S& P 500
Past performance is not indicative of future results.
Kase Fund M onthly Performance (Net) Since I nception
1999 2000 2001 2002 2003 2004 2005 2006 2007 2008 2009 2010 2011 2012 2013
Kase S& P Kase S& P Kase S& P Kase S& P Kase S& P Kase S& P Kase S& P Kase S& P Kase S& P Kase S& P Kase S& P Kase S& P Kase S& P Kase S& P Kase S& P
Fund 500 Fund 500 Fund 500 Fund 500 Fund 500 Fund 500 Fund 500 Fund 500 Fund 500 Fund 500 Fund 500 Fund 500 Fund 500 Fund 500 Fund 500
January 7.8 4.1 -6.3 -5.0 4.4 3.6 -1.8 -1.5 -5.5 -2.6 4.7 1.8 1.1 -2.4 1.9 2.7 2.4 1.7 1.9 -5.9 -3.6 -8.4 -1.6 -3.6 -2.8 2.4 12.6 4.5 4.5 5.2
February -2.9 -3.1 6.2 -1.9 -0.6 -9.2 -1.1 -2.0 2.9 -1.6 7.0 1.5 2.1 2.0 -3.1 0.2 -3.3 -2.1 -6.9 -3.3 -8.9 -10.8 7.3 3.1 4.1 3.4 -0.8 4.3 0.8 1.4
M arch 4.1 4.0 10.3 9.8 -2.6 -6.4 3.0 3.7 1.4 0.9 3.9 -1.5 3.9 -1.7 3.9 1.3 -0.8 1.1 -2.3 -0.5 2.9 9.0 4.6 6.0 -4.1 0.0 10.9 3.3 1.3 3.8
April 2.1 3.7 -5.1 -3.0 5.1 7.8 -0.2 -6.0 10.5 8.2 2.4 -1.5 0.6 -1.9 2.2 1.4 4.4 4.6 -0.9 4.9 20.1 9.6 -2.1 1.6 1.9 3.0 1.3 -0.6
M ay -5.7 -2.5 -2.8 -2.0 1.8 0.6 0.0 -0.8 6.6 5.3 -1.4 1.4 -2.6 3.2 1.8 -2.9 2.5 3.3 7.9 1.2 8.1 5.5 -2.6 -8.0 -1.9 -1.1 -13.6 -6.0
June 2.2 5.8 4.1 2.4 4.6 -2.4 -7.3 -7.1 2.9 1.3 0.1 1.9 -3.1 0.1 -0.2 0.2 -3.0 -1.5 -1.2 -8.4 -5.0 0.2 4.5 -5.2 -2.4 -1.7 0.5 4.1
July -0.7 -3.2 -3.6 -1.6 -1.1 -1.0 -5.0 -7.9 2.3 1.7 4.6 -3.4 0.5 3.7 -0.9 0.7 -5.4 -3.0 -2.5 -0.9 6.8 7.6 3.5 7.0 -4.6 -2.0 0.2 1.4
August 4.1 -0.4 5.4 6.1 2.5 -6.3 -4.3 0.5 0.4 1.9 -0.9 0.4 -3.2 -1.0 2.9 2.3 1.7 1.5 -3.3 1.3 6.3 3.6 -1.5 -4.5 -13.9 -5.4 -7.2 2.3
September -3.3 -2.7 -7.2 -5.3 -6.1 -8.1 -5.4 -10.9 1.7 -1.0 -1.6 1.1 -1.5 0.8 5.0 2.6 -1.1 3.6 15.9 -9.1 5.9 3.7 1.7 8.9 -9.3 -7.0 0.0 2.6
October 8.1 6.4 -4.5 -0.3 -0.8 1.9 2.8 8.8 6.2 5.6 -0.4 1.5 3.5 -1.6 6.3 3.5 8.2 1.7 -12.5 -16.8 -1.9 -1.8 -1.7 3.8 7.0 10.9 1.6 -1.9
November 2.8 2.0 -1.5 -7.9 2.3 7.6 4.1 5.8 2.2 0.8 0.8 4.0 3.1 3.7 1.9 1.7 -3.6 -4.2 -8.9 -7.1 -1.2 6.0 -1.9 0.0 -0.6 -0.2 -4.5 0.6
December 9.8 5.9 2.3 0.5 6.5 0.9 -7.4 -5.8 -0.4 5.3 -0.2 3.4 -1.3 0.0 1.4 1.4 -4.3 -0.7 -4.0 1.1 5.5 1.9 0.5 6.7 0.1 1.0 0.1 0.9
YTD
31.0 21.0 -4.5 -9.1 16.5 -11.9 -22.2 -22.1 35.1 28.6 20.6 10.9 2.6 4.9 25.2 15.8 -3.2 5.5 -18.1 -37.0 37.1 26.5 10.5 15.1 -24.9 2.1 -1.7 16.0 6.7 10.6
TOTAL
Past performance is not indicative of future results.
Note: Returns in 2001, 2003, and 2009 reflect the benefit of the high-water mark, assuming an investor at inception.
-6-
7. Appendix A
PRI VACY POLI CY
This privacy policy explains the manner in which the Partnership, the General Partner and the
Investment Manager (collectively, the Partnership ) collect, utilize and maintain nonpublic
personal information about the Partnership s investors, as required under Federal legislation.
Collection of I nvestor I nformation
The Partnership collects nonpublic personal information about its investors mainly through the
following sources: Subscription forms, investor questionnaires a nd other information provided
by the investor in writing, in person, by telephone, electronically or by any other means. This
information includes name, address, nationality, tax identification number and financial and
investment qualifications; and transactions within the Partnership, including account balances,
investments and withdrawals.
Disclosure of Nonpublic Personal I nformation
The Partnership does not sell or rent investor information. The Partnership does not disclose
nonpublic personal information about its investors to nonaffiliated third parties or to affiliated
entities, except as permitted by law. For example, the Partnership may share nonpublic personal
information in the following situations:
To service providers in connection with the administration and servicing of the
Partnership, which may include attorneys, accountants, auditors and other professionals.
The Partnership may also share information in connection with the servicing or
processing of Partnership transactions;
To 3rd party marketing firms who have been engaged by the Investment Manager to raise
assets for the Partnership. Any information provided to a 3rd party marketing firm would
be limited to name and basic contact information.
To affiliated companies in order to provide you with ongoing personal advice and
assistance with respect to the products and services you have purchased through the
Partnership and to introduce you to other products and services that may be of value to
you;
To respond to a subpoena or court order, judicial process or regulatory authorities;
To protect against fraud, unauthorized transactions (such as money laundering), claims or
other liabilities; and
Upon consent of an investor to release such information, including authorization to
disclose such information to persons acting in a fiduciary or representative capacity on
behalf of the investor.
If you elect to opt-out and do not want us to share your non-public personal information other
than when required to perform normal services or when required by law, please contact us at:
Carnegie Hall Tower, 152 West 57th Street, 46th Floor, New York, New York 10019, Ph: (212)
-7-
8. 277-5606 or by email: kalires@kasecapital.com.
Protection of I nvestor I nformation
The Partnership s policy is to require that all employees, financial professionals and companies
providing services on its behalf keep client information confidential.
The Partnership maintains safeguards that comply with federal standards to protect investor
information. The Partnership restricts access to the personal and account information of investors
to those employees who need to know that information in the course of their job responsibilities.
Third parties with whom the Partnership shares investor information must agree to follow
appropriate standards of security and confidentiality.
The Partnership s privacy policy applies to both current and former investors. The Partnership
may disclose nonpublic personal information about a former investor to the same extent as for a
current investor.
Changes to Privacy Policy
The Partnership may make changes to its privacy policy in the future. The Partnership will not
make any change affecting you without first sending you a revised privacy policy describing the
change.
-8-
9. The T2 Accredited Fund, LP (dba the Kase Fund) (the Fund ) commenced operations on January 1,
1999. The Fund s investment objective is to achieve long-term after-tax capital appreciation
commensurate with moderate risk, primarily by investing with a long-term perspective in a concentrated
portfolio of U.S. stocks. In carrying out the Partnership s investment objective, the Investment Manager,
T2 Partners Management, LP (dba Kase Capital Management), seeks to buy stocks at a steep discount to
intrinsic value such that there is low risk of capital loss and significant upside potential. The primary
focus of the Investment Manager is on the long-term fortunes of the companies in the Partnership s
portfolio or which are otherwise followed by the Investment Manager, relative to the prices of their
stocks.
There is no assurance that any securities discussed herein will remain in Fund s portfolio at the time you
receive this report or that securities sold have not been repurchased. The securities discussed may not
represent the Fund s entire portfolio and in the aggregate may represent only a small percentage of an
account s portfolio holdings. The material presented is compiled from sources believed to be reliable and
honest, but accuracy cannot be guaranteed.
It should not be assumed that any of the securities transactions, holdings or sectors discussed were or will
prove to be profitable, or that the investment recommendations or decisions we make in the future will be
profitable or will equal the investment performance of the securities discussed herein. All
recommendations within the preceding 12 months or applicable period are available upon request. Past
results are no guarantee of future results and no representation is made that an investor will or is likely to
achieve results similar to those shown. All investments involve risk including the loss of principal.
Performance results shown are for the Kase Fund and are presented net of all fees, including management
and incentive fees, brokerage commissions, administrative expenses, and other operating expenses of the
Fund. Net performance includes the reinvestment of all dividends, interest, and capital gains.
The fee schedule for the Investment Manager includes a 1.5% annual management fee and a 20%
incentive fee allocation. For periods prior to June 1, 2004 and after July 1, 2012, the Investment
Manager s fee schedule included a 1% annual management fee and a 20% incentive fee allocation. In
practice, the incentive fee is earned on an annual, not monthly, basis or upon a withdrawal from the
Fund. Because some investors may have different fee arrangements and depending on the timing of a
specific investment, net performance for an individual investor may vary from the net performance as
stated herein.
The return of the S&P 500 and other indices are included in the presentation. The volatility of these
indices may be materially different from the volatility in the Fund. In addition, the Fund s holdings differ
significantly from the securities that comprise the indices. The indices have not been selected to represent
appropriate benchmarks to compare an investor s performance, but rather are disclosed to allow for
comparison of the investor s performance to that of certain well-known and widely recognized indices.
You cannot invest directly in these indices.
This document is confidential and may not be distributed without the consent of the Investment Manager
and does not constitute an offer to sell or the solicitation of an offer to purchase any security or
investment product. Any such offer or solicitation may only be made by means of delivery of an approved
confidential offering memorandum.
-9-