Download to read offline

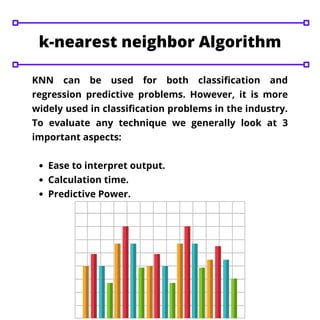
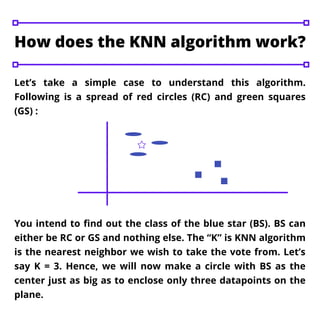
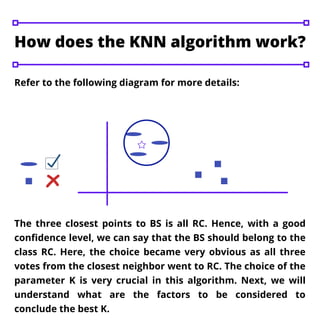
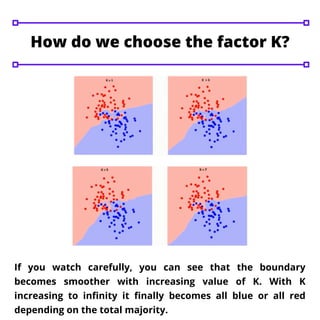
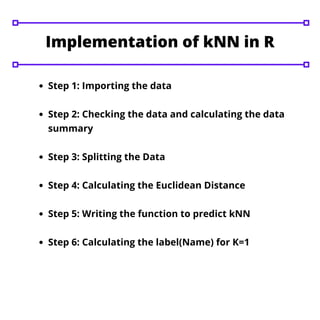

The k-nearest neighbor (KNN) algorithm is a fundamental machine learning technique used for classification and regression problems, prominently in classification. It operates by determining the 'k' closest data points to a new input to ascertain its class, with the choice of 'k' significantly affecting the algorithm's outcomes. A higher value of 'k' generally results in smoother decision boundaries but can compromise specificity, while KNN implementation involves steps such as data importation, distance calculation, and prediction functions.


![k-nearestneighborknn-231215171119-a5cfb915.pptx [Read-Only].pptx](https://cdn.slidesharecdn.com/ss_thumbnails/k-nearestneighborknn-231215171119-a5cfb915-251010013925-09814a4b-thumbnail.jpg?width=640&height=640&fit=bounds)