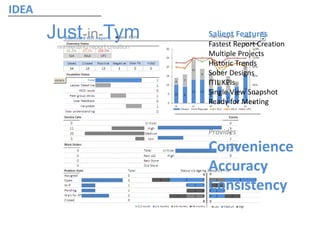
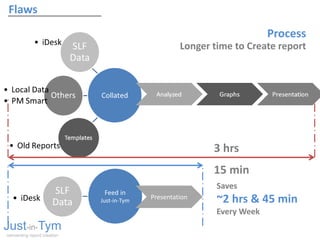
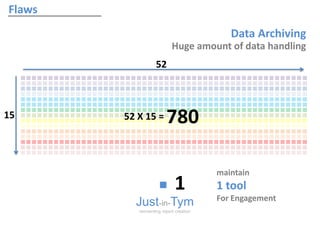
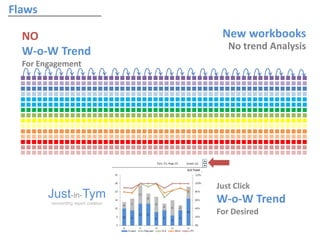
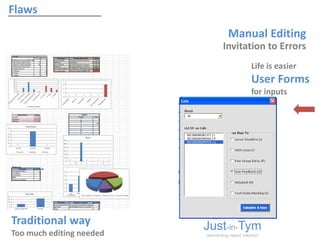
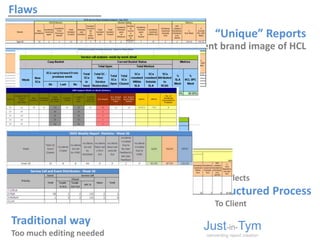
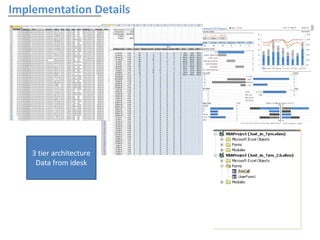
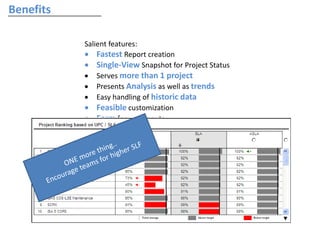
IKEA Engagement
INOS, COS, ODS,
COMS, OMS, PCM, SCM,
DWP, GPS, SIMNA
NCP, SCPIX, DSP,
CASY, CUSTOMS, MDB
Its time for a new leap
Just-in-Tym
reinventing report creation
274 Associates
23 Projects
16 Support Projects
IDEA
Project
Key KPIs Trends
Escalations
Problem
Management
Priority
Dist.
Work Order
On-Call
IDEA
Just-in-Tym
reinventing report creation
Salient Features
Fastest Report Creation
Multiple Projects
Historic Trends
Sober Designs
ITIL KPIs
Single View Snapshot
Ready for Meeting
Provides
Convenience
Accuracy
Consistency
IDEA
Existing Process
Collated
SLF
Data
• iDesk
Others
• Local Data
• PM Smart
Templates
• Old Reports
Analyzed Graphs Presentation
• Cumbersome and unnecessary overload on leads
• Every time struggle with graphs
• 1 new Workbook is created every Week
• Multiple sheets are maintained for different KPIs
• Sticking to Traditional way of using Excel
• Every project make report in their “Unique” way
• Reports are sent to Senior Management in scatters form
Conclusion
Cumbersome Process
Struggle with graphs
New workbook every time
Multiple sheets
Traditional way
Multiple reports
Cluttered reports at SMR
Flaws
Process
Feed in
Just-in-Tym
SLF
Data• iDesk Presentation
Just-in-Tym
reinventing report creation
3 hrs
15 min
Saves
~2 hrs & 45 min
Every Week
Longer time to Create report
Flaws
Data Archiving
Just-in-Tym
reinventing report creation
Huge amount of data handling
52
15
1
52 X 15 = 780
maintain
1 tool
For Engagement
Flaws
New workbooks
Just-in-Tym
reinventing report creation
No trend Analysis
Just Click
W-o-W Trend
For Desired
NO
W-o-W Trend
For Engagement
Flaws
Manual Editing
Just-in-Tym
reinventing report creation
Invitation to Errors
Life is easier
User Forms
for inputs
Traditional way
Too much editing needed
Flaws
“Unique” Reports
Just-in-Tym
reinventing report creation
Inconsistent brand image of HCL
It reflects
Structured Process
To Client
Traditional way
Too much editing needed
Implementation Details
3 tier architecture
Data from idesk
Implementation Plan
KPIs
Customiz
use
KPI
Adjusted SLF
UPC
Ping-pong Cases
Reopened cases
Problem Handling
Value-add ideas
Business C-SAT
Incident reduction goal
6/8 KPIs can be
included
Benefits
Salient features:
 Fastest Report creation
 Single-View Snapshot for Project Status
 Serves more than 1 project
 Presents Analysis as well as trends
 Easy handling of historic data
 Feasible customization
 Form for user inputs
 Consistent view from HCL to client
ROI
• Perceived Benefits
• Senior Management at HCL and Project Management at IKEA will have a single, consolidated view of “Weekly/Monthly Status Repo
• This report generating tool has the capabilities of being in use forever in IKEA engagement, for its ease of handling and reliability
• Savings through implementation of this tool = 1 FTE/Year
Rational:
Effort spent per year in creating weekly reports across IKEA engagement
= 3 x 4 x 12 x 15 = 2160 man hrs / yr
Hrs. spent per week
Weeks Months No. of Support Projects in IKEA
1 FTE/Year at Offshore = 9 x 20 x 12 = 2160 man hrs / yr.
Months
Working hrs at offshore Working days in a month

justinTym

  • 2.
    IKEA Engagement INOS, COS,ODS, COMS, OMS, PCM, SCM, DWP, GPS, SIMNA NCP, SCPIX, DSP, CASY, CUSTOMS, MDB Its time for a new leap Just-in-Tym reinventing report creation 274 Associates 23 Projects 16 Support Projects IDEA
  • 3.
  • 4.
    Just-in-Tym reinventing report creation SalientFeatures Fastest Report Creation Multiple Projects Historic Trends Sober Designs ITIL KPIs Single View Snapshot Ready for Meeting Provides Convenience Accuracy Consistency IDEA
  • 5.
    Existing Process Collated SLF Data • iDesk Others •Local Data • PM Smart Templates • Old Reports Analyzed Graphs Presentation • Cumbersome and unnecessary overload on leads • Every time struggle with graphs • 1 new Workbook is created every Week • Multiple sheets are maintained for different KPIs • Sticking to Traditional way of using Excel • Every project make report in their “Unique” way • Reports are sent to Senior Management in scatters form Conclusion Cumbersome Process Struggle with graphs New workbook every time Multiple sheets Traditional way Multiple reports Cluttered reports at SMR
  • 6.
    Flaws Process Feed in Just-in-Tym SLF Data• iDeskPresentation Just-in-Tym reinventing report creation 3 hrs 15 min Saves ~2 hrs & 45 min Every Week Longer time to Create report
  • 7.
    Flaws Data Archiving Just-in-Tym reinventing reportcreation Huge amount of data handling 52 15 1 52 X 15 = 780 maintain 1 tool For Engagement
  • 8.
    Flaws New workbooks Just-in-Tym reinventing reportcreation No trend Analysis Just Click W-o-W Trend For Desired NO W-o-W Trend For Engagement
  • 9.
    Flaws Manual Editing Just-in-Tym reinventing reportcreation Invitation to Errors Life is easier User Forms for inputs Traditional way Too much editing needed
  • 10.
    Flaws “Unique” Reports Just-in-Tym reinventing reportcreation Inconsistent brand image of HCL It reflects Structured Process To Client Traditional way Too much editing needed
  • 11.
    Implementation Details 3 tierarchitecture Data from idesk
  • 12.
    Implementation Plan KPIs Customiz use KPI Adjusted SLF UPC Ping-pongCases Reopened cases Problem Handling Value-add ideas Business C-SAT Incident reduction goal 6/8 KPIs can be included
  • 13.
    Benefits Salient features:  FastestReport creation  Single-View Snapshot for Project Status  Serves more than 1 project  Presents Analysis as well as trends  Easy handling of historic data  Feasible customization  Form for user inputs  Consistent view from HCL to client
  • 14.
    ROI • Perceived Benefits •Senior Management at HCL and Project Management at IKEA will have a single, consolidated view of “Weekly/Monthly Status Repo • This report generating tool has the capabilities of being in use forever in IKEA engagement, for its ease of handling and reliability • Savings through implementation of this tool = 1 FTE/Year Rational: Effort spent per year in creating weekly reports across IKEA engagement = 3 x 4 x 12 x 15 = 2160 man hrs / yr Hrs. spent per week Weeks Months No. of Support Projects in IKEA 1 FTE/Year at Offshore = 9 x 20 x 12 = 2160 man hrs / yr. Months Working hrs at offshore Working days in a month