This document provides charts and analysis of the Toronto real estate market in June 2018. Key points include:
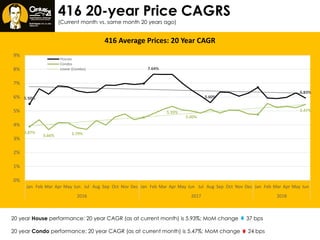
- The average price of detached homes was up 23K from June 2017 but down from peak bubble prices in 2016-2017. Condo prices rose 54K or 9.7% from last June.
- Home sales rose 6.5% from June 2017 but remain below recent years. Condo sales fell 4.8% from last June but were up from the 7-year average.
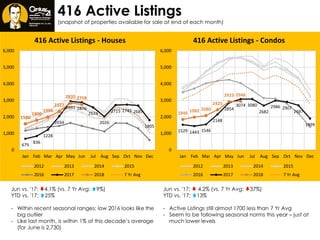
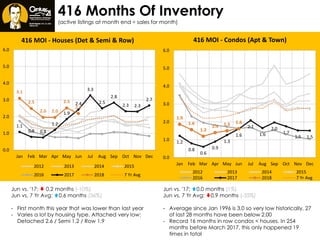
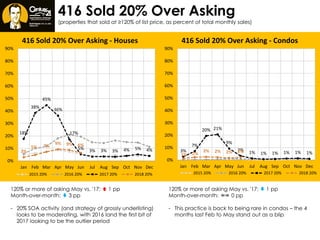
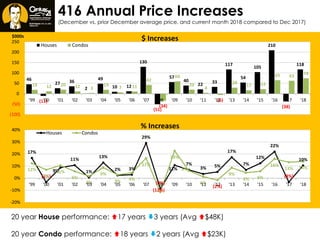
- Active listings rose slightly for both homes and condos compared to 2017 but remain below historical averages. Months of inventory fell for homes and was flat for condos.
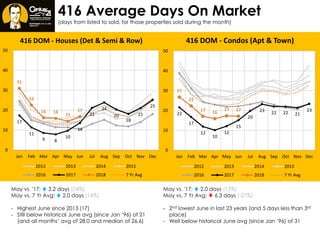
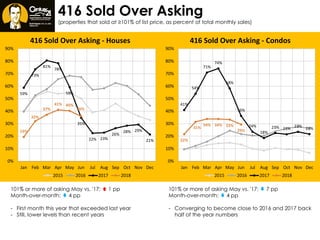
- The author analyzes various