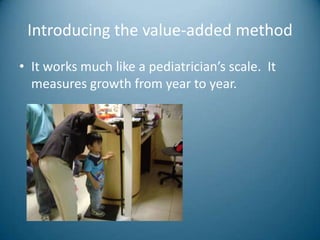
Value-added
        by Dr. William Sanders


Let’s really leave no child behind.
What have we really been doing with
               data?


• Historically, we have
 been shelving it into a
 filing cabinet.
What are the problems with how we
         look at data now?
• We see how the middle level students of our
  classes perform but does our current system
  really measure our highest and lowest
  performers?
Introducing the value-added method
• It works much like a pediatrician’s scale. It
  measures growth from year to year.
Purposes of measurement:
• Measure each child
• One day’s testing could be influenced by a
  variety of factors
• Look at comparable plots on many children
  can lead us to inferences about certain
  classrooms
• Each student serves as his/her own control
The goal of value-added
• Increase the academic achievement for every
  child
Sample            What inferences can we make
scores            from this data?
 800


 600


 400


 200


              2      3            4     5
   District
   Student        Student grade
• This is not enough data to accurately show
  information about the teacher of first or
  second grade.
• What if we saw the progress of all the
  students in that teacher’s class and then for
  various years?
Types of Patterns
• Shed patterns – some of
  the most hurtful that
  exist in schools. This
  happens when the                       “Shed” pattern
                            Gain
  lowest achievers make
  the greatest gains and
  the highest achievers
  are held back.
                                   Previous Achievement
• Tee-Pee patterns – this
  occurs when teachers
  focus their instruction                     “Tee-Pee” pattern
  on the average students
  in the class. Average     Gain
  students make the
  greatest gain and those
  at the top and bottom
  of the class have less
  gain.                            Previous achievement
June River’s Study
• Examined the performance of eighth grade
  students on ninth grade proficiency tests and
  linked these scores back to performance on
  fourth grade tests to predict the possibility of
  passing on the first attempt a ninth grade test.
Findings:
• Students assigned a       • Students assigned a
  sequence of teachers in     sequence of teachers
  the top quintile for 4      from the bottom
  years had a 60% passing     quintile had a 15%
  rate.                       passing rate.
Realized Gain


Grade   100%   80%        110%       110%   120%   60%
level
2       2.0    2.0        2.0        1.0    1.0    1.0
3       3.0    2.8        3.1        2.1    2.2    1.8
4       4.0    3.         4.2        3.2    3.4    2.6
5       6.0    4.4        5.3        4.3    4.6    3.4
6       6.0    5.2        6.4        5.4    5.8    4.2
7       7.0    6.0        7.5        6.5    7.0    5.0
8       8.0    6.8        8.6        7.6    8.2    5.8
Why is this important?
• Value-added research
  tells us that teacher
  effectiveness is the
  single largest factor
  affecting academic
  growth.
Highly effective teachers
• Ensure that all children
  are achieving
• Teach students from
  where they are
• Differentiate instruction
  and focus on individuals
• Make excellent gains
  across the previous
  achievement spectrum
Highly effective schools
• Link teachers over
  grade levels and focus
  on gains in achievement
  grade by grade.

Value Added

  • 1.
    Value-added by Dr. William Sanders Let’s really leave no child behind.
  • 2.
    What have wereally been doing with data? • Historically, we have been shelving it into a filing cabinet.
  • 3.
    What are theproblems with how we look at data now? • We see how the middle level students of our classes perform but does our current system really measure our highest and lowest performers?
  • 4.
    Introducing the value-addedmethod • It works much like a pediatrician’s scale. It measures growth from year to year.
  • 5.
    Purposes of measurement: •Measure each child • One day’s testing could be influenced by a variety of factors • Look at comparable plots on many children can lead us to inferences about certain classrooms • Each student serves as his/her own control
  • 6.
    The goal ofvalue-added • Increase the academic achievement for every child
  • 7.
    Sample What inferences can we make scores from this data? 800 600 400 200 2 3 4 5 District Student Student grade
  • 8.
    • This isnot enough data to accurately show information about the teacher of first or second grade. • What if we saw the progress of all the students in that teacher’s class and then for various years?
  • 9.
    Types of Patterns •Shed patterns – some of the most hurtful that exist in schools. This happens when the “Shed” pattern Gain lowest achievers make the greatest gains and the highest achievers are held back. Previous Achievement
  • 10.
    • Tee-Pee patterns– this occurs when teachers focus their instruction “Tee-Pee” pattern on the average students in the class. Average Gain students make the greatest gain and those at the top and bottom of the class have less gain. Previous achievement
  • 11.
    June River’s Study •Examined the performance of eighth grade students on ninth grade proficiency tests and linked these scores back to performance on fourth grade tests to predict the possibility of passing on the first attempt a ninth grade test.
  • 12.
    Findings: • Students assigneda • Students assigned a sequence of teachers in sequence of teachers the top quintile for 4 from the bottom years had a 60% passing quintile had a 15% rate. passing rate.
  • 13.
    Realized Gain Grade 100% 80% 110% 110% 120% 60% level 2 2.0 2.0 2.0 1.0 1.0 1.0 3 3.0 2.8 3.1 2.1 2.2 1.8 4 4.0 3. 4.2 3.2 3.4 2.6 5 6.0 4.4 5.3 4.3 4.6 3.4 6 6.0 5.2 6.4 5.4 5.8 4.2 7 7.0 6.0 7.5 6.5 7.0 5.0 8 8.0 6.8 8.6 7.6 8.2 5.8
  • 14.
    Why is thisimportant? • Value-added research tells us that teacher effectiveness is the single largest factor affecting academic growth.
  • 15.
    Highly effective teachers •Ensure that all children are achieving • Teach students from where they are • Differentiate instruction and focus on individuals • Make excellent gains across the previous achievement spectrum
  • 16.
    Highly effective schools •Link teachers over grade levels and focus on gains in achievement grade by grade.