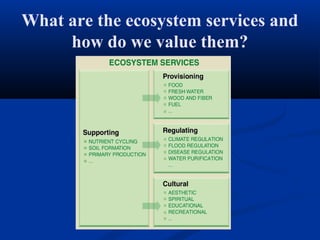
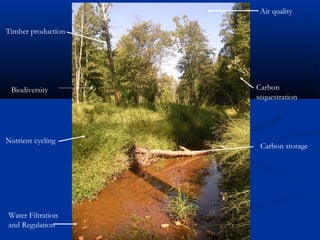
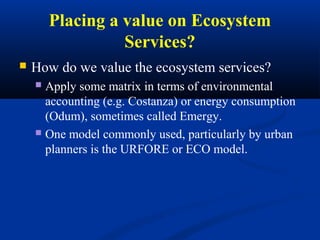
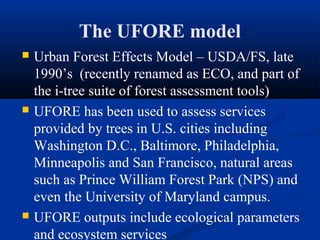
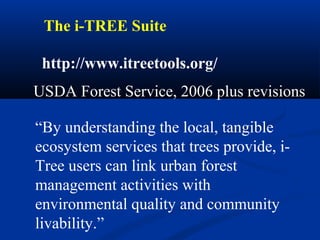
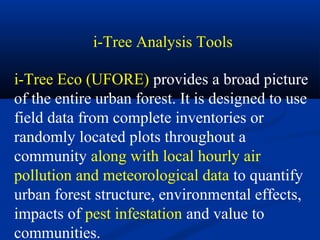
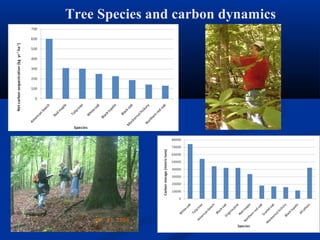
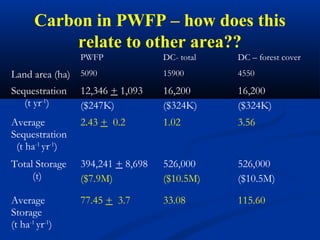
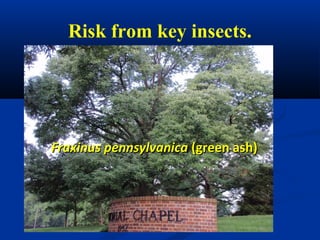
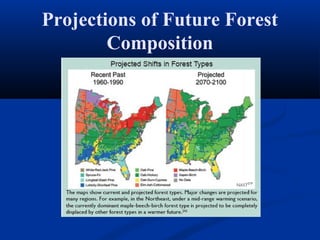
Walking the Woods
Understanding our natural areas
        and their value
                 Joe H. Sullivan, PhD
Department of Plant Science and Landscape Architecture
                University of Maryland
Brief Outline
   Why do we values our trees and forests?
   How do we place a value on these in economic
    terms?
   What are some of the threats to our woods?
What is the value of a forest or
              woodland?

Real estate value – simple market value
Tourism value – aesthetics, fees, etc
Direct use – quantitative value, e.g. timber
Ecosystem services or non-use values – these are
   difficult to quantify and frequently modeled
   values.
What are the ecosystem services and
     how do we value them?
Air quality

Timber production


 Biodiversity       Carbon
                    sequestration


Nutrient cycling
                     Carbon storage


Water Filtration
and Regulation
Placing a value on Ecosystem
                  Services?
   How do we value the ecosystem services?
     Apply some matrix in terms of environmental
      accounting (e.g. Costanza) or energy consumption
      (Odum), sometimes called Emergy.
     One model commonly used, particularly by urban
      planners is the URFORE or ECO model.
The UFORE model
   Urban Forest Effects Model – USDA/FS, late
    1990’s (recently renamed as ECO, and part of
    the i-tree suite of forest assessment tools)
   UFORE has been used to assess services
    provided by trees in U.S. cities including
    Washington D.C., Baltimore, Philadelphia,
    Minneapolis and San Francisco, natural areas
    such as Prince William Forest Park (NPS) and
    even the University of Maryland campus.
   UFORE outputs include ecological parameters
    and ecosystem services
The i-TREE Suite

 http://www.itreetools.org/
USDA Forest Service, 2006 plus revisions

“By understanding the local, tangible
ecosystem services that trees provide, i-
Tree users can link urban forest
management activities with
environmental quality and community
livability.”
Off-the shelf software OR design
Josh Nadler your own!      Taylor Keen
i-Tree Analysis Tools

i-Tree Eco (UFORE) provides a broad picture
of the entire urban forest. It is designed to use
field data from complete inventories or
randomly located plots throughout a
community along with local hourly air
pollution and meteorological data to quantify
urban forest structure, environmental effects,
impacts of pest infestation and value to
communities.
OTHER TOOLS OF INTEREST
 OFF THE I-TREE SUITE
i-Tree Vue allows you to use of national land cover data
maps to assess your community's land cover, including tree
canopy, and some of the ecosystem services provided by your
current urban forest.
i-Tree Streets (Stratum) focuses on the benefits provided by a
municipality's street trees.
i-Tree Hydro (beta) is a new application designed to simulate
the effects of changes in tree and impervious cover on stream
flow and water quality.
i-Tree Canopy offers a quick and easy way to produce a
statistically valid estimate of land cover types (e.g., tree
cover)
OTHER TOOLS OF INTEREST
  OFF THE i-TREE SUITE

i-Tree Design (beta) is a simple online tool that provides a
platform for assessments of individual trees at the parcel level.
This tool links to Google Maps and allows you to see how tree
selection, tree size, and placement around your home effects
energy use and other benefits.
i-Tree Pest Detection Module is a portable, accessible and
standardized protocol for observing a tree for possible insect or
disease problems.
i-Tree Storm provides a method for a community to assess
widespread storm damage in a simple, credible, and efficient
manner immediately after a severe storm.
Example: Prince William Forest
                Park
   Located just west of I-95, SW of Washington D.C., in Prince
    William County, Virginia.

   National Park under National Park Service administration
    since the 1930s.

   Previous uses include farmland, pyrite mines, social services
    during the Great Depression, and training grounds for the
    precursor to the CIA

   Mixture of Atlantic Coastal Plain and Piedmont regions.

   Naturally regenerating vegetation but in the urban “footprint”
Prince William County


        Manassas


             Prince William Forest Park
Sampling Methods
   100 random plots within the park, located via
    GPS coordinates.
   Each plot 1/10 acre (approximately 37.2 feet in
    radius).
   ID all woody species in the plot.
   Data include DBH, height, height to crown,
    crown area, dieback, % of crown missing,
    impervious surfaces and crown light exposure.
   Couple these data with weather and air quality
    data.
   Estimates are provided by the model.
Summary Results
•   Total number of trees surveyed 5099
•   Total estimated trees in the park 5.7 X 10⁶
•   Mean trees/hectare                1126
•   Mean trees per plot (total)          51
•   Number of tree species surveyed      39
•   Leaf Area Index                       3.36
•   Shannon-Weiner Diversity Index
    2.45
Species Composition: all trees

               15.6
                              22.2          American beech
                                            Black tupelo
    5.4                                     Red maple
                                            Virginia pine
   5.4
                                            Flowering dogwood
                                            Tulip tree
   5.6
                                     17.5   White oak
         6.5                                American holly
                                            Other species
                10.3   11.5
Proportion of all sampled trees (%)


                                        10
                                              20
                                                    30
                                                          40
                                                                50
                                                                      60


                                  0
                  2.5
                      -7
                          .62
              7.6
                  3-
                     15
                         .2
            15              4
               .25
                   -22
                        .86
            22
               .87
                   -30
                        .48
              30
                 .49
                      -38
            38             .1
               .11
                   -45
                        .72
            45
               .73
                   -53
                        .34
            53
               .35
                   -60
                        .96
            60


DBH (cm)
               .97
                   -68
                        .58
              68
                 .59
                      -76
            76             .2
               .21
                   -83
                        .82
            83
               .83
                   -91
                        .44
            91
               .45
                   -99
           99           .06
             .07
                 -10
                      6.6
                           8
                                                                           Size distribution
Forest Community Composition
                             Relative    Relative
                                                     Leaf Area   Importan
                             density      Basal
   Species       Frequency                           Index (m2    ce Value
                              (% of      Area (%
                                                        m-2)        (I.V.)
                              total)     of total)

American beech          90        24.6       11.0         0.86      125.6

  Black gum             86        18.0         4.6        0.24      108.6

  Red maple             83        11.8         9.3        0.41      104.1

  White oak             62         5.3       15.1         0.32       82.4

 Tulip poplar           61         5.7       16.5         0.49       73.2

 Virginia pine          45         8.2       16.5         0.23       69.7
Changing Forest Composition?
Carbon in PWFP
Net                Average                               Average
Sequestration      Sequestration      Total Storage      Storage
    (t yr-1)        (t ha-1 yr-1)          (t)           (t ha-1 yr-1)
12,346 + 1,093     2.43 + 0.2         394,241 + 8,698    77.45 + 3.7


Value at $20 t-1   Value at $20 t-1   Value at $20 t-1   Value at $20 t-1


$246,920           $48.60             $7,884,820         $1549
Carbon


                                                Carbon Storage
                                                                                                                                  Sequestration
                                    Carbon storage (10K metric tons)                                                 Estimated net carbon sequestration


                                    0
                                        1
                                            2
                                                  3
                                                                 4
                                                                     5
                                                                         6
                                                                             7
                      2.                                                                                                     (metric tons/year)
                         5-
                           7.
                             62
                   7.
                      63
                                                                                                                                               1,000.00
                                                                                                                                                          1,500.00
                                                                                                                                                                     2,000.00
                                                                                                                                                                                2,500.00
                                                                                                                                                                                                3,000.00


                                                                                                                     -500.00
                                                                                                                                      500.00

                                                                                                                               0.00


                        -1                                                                             2.
                          5.                                                                              5-
                             24                                                                             7.
                                                                                                              62
                  15
                     .2                                                                              7.
                       5-                                                                               63
                         22                                                                                -1
                           .8                                                                                5.
                              6                                                                                 24
                  22                                                                               15
                     .8                                                                                .2
                       7-                                                                                 5-
                         30                                                                                 22
                           .4                                                                                 .8
                              8                                                                                  6
                                                                                                   22
                   30                                                                                  .8
                       .4                                                                                 7-
                         9-                                                                                 30
                           38                                                                                 .4
                             .1                                                                                  8
                                                                                                     30
                  38                                                                                     .4
                     .1                                                                                    9-
                        1-                                                                                   38
                          45                                                                                    .1
                            .7
                              2                                                                    38
                                                                                                       .1
                  45                                                                                      1-
                     .7                                                                                     45
                        3-                                                                                    .7
                          53                                                                                     2
                            .3                                                                     45
                              4                                                                        .7
                                                                                                          3-
                  53                                                                                        53
                     .3                                                                                       .3


dbh class (cm)
                        5-                                                                                       4
                          60                                                                       53
                            .9                                                                         .3
                              6                                                                           5-
                                                                                 dbh class (cm)


                  60                                                                                        60
                                                                                                              .9
                     .9
                        7-                                                                                       6
                          68                                                                       60
                            .5                                                                         .9
                              8                                                                           7-
                                                                                                            68
                                                                                                              .5
                    68                                                                                           8
                        .5                                                                           68
                          9-
                            76                                                                           .5
                               .2                                                                          9-
                                                                                                             76
                  76                                                                                            .2
                      .2                                                                           76
                         1-
                           83                                                                          .2
                                                                                                          1-
                             .8                                                                             83
                                2                                                                             .8
                 99                                                                               99             2
                    .0                                                                               .0
                       7-                                                                               7-
                          10                                                                               10
                                                                                                                                                                                 Tree size and carbon dynamics


                            6.                                                                               6.
                              68                                                                                68
Tree Species and carbon dynamics
Carbon in PWFP – how does this
            relate to other area??
                 PWFP              DC- total   DC – forest cover
Land area (ha) 5090                15900       4550

Sequestration    12,346 + 1,093    16,200      16,200
   (t yr-1)      ($247K)           ($324K)     ($324K)
Average          2.43 + 0.2        1.02        3.56
Sequestration
 (t ha-1 yr-1)
Total Storage    394,241 + 8,698   526,000     526,000
     (t)         ($7.9M)           ($10.5M)    ($10.5M)

Average          77.45 + 3.7       33.08       115.60
Storage
(t ha-1 yr-1)
What are some of the threats to
our woods and what can we do
        about them?
Risk from key insects.


Fraxinus pennsylvanica (green ash)
Fraxinus (ash) Trees
          Emerald Ash Borer EAB
Fraxinus comprise 88 of 9000 Inventoried plants = ~1%
41 Fraxinus americana (white ash) @ UMD

47 Fraxinus pennsylvanica (green ash) @ UMD
2008 UMD UFORE Study: Potential
          Pest Impacts
Pest Damage in DC and UMD
Pest          UMD %      UMD         DC %       DC
              Impacted   Potential   Impacted   Potential
                         Loss ($)               Loss ($)
Asian         27.3       14.7M       34.4       916M
longhorned
beetle
Gypsy moth    20.6       45.2M       13.8       1.39B

Dutch elm     2.1        376 T       2.4        112M
disease
Emerald ash   0.8        2.35M       2.1        72M
borer
Changes in Greenhouse Gasses
Changes in Temperature
Climate Change
Climate Change and Forests?
Projections of Future Forest
        Composition
Some modeles for PWFP
The low-emission B2 scenario of the Intergovernmental Panel on
Climate Change predicts moderate increases in mean annual
global temperature by the end of the twenty-first century.

In the next 30 years, 35 out of 39 tree species in PWFP will
continue to experience optimal growth conditions.
By 2070, however, the model predicts that the number of species
that would find the Park optimal would decrease to ten, while
one species, witch-hazel (Hamamelis virginiana L.), would
experience a climate entirely unsuitable for growth
This model also predicts that 10 species would be extirpated
from the park by the end of this century and that all current
tree species would be in the fringe range or outside of optimal
conditions for growth.
What about the higher emission models??

By 2070 ALL species would be listed in the unfavorable climate
range!

Is this true??
What are current emission levels?
What does this mean?
Land Use and Fragmentation
Deforestation, urban sprawl, agriculture, and other human influences
have substantially altered and fragmented our landscape.

Such disturbance of the land can change the atmospheric
concentration of carbon dioxide, as well as affect local, regional, and
global climate by changing the energy balance on Earth's surface.

The extent to which land use changes have contributed to global
warming is controversial but may account for up to half of the
warming reported today.

This is only one of the affects of development and land use changes
on our environment. Dr. Neel will speak in more detail on this topic
in the next presentation.

The Value of Trees

  • 1.
    Walking the Woods Understandingour natural areas and their value Joe H. Sullivan, PhD Department of Plant Science and Landscape Architecture University of Maryland
  • 2.
    Brief Outline  Why do we values our trees and forests?  How do we place a value on these in economic terms?  What are some of the threats to our woods?
  • 3.
    What is thevalue of a forest or woodland? Real estate value – simple market value Tourism value – aesthetics, fees, etc Direct use – quantitative value, e.g. timber Ecosystem services or non-use values – these are difficult to quantify and frequently modeled values.
  • 4.
    What are theecosystem services and how do we value them?
  • 5.
    Air quality Timber production Biodiversity Carbon sequestration Nutrient cycling Carbon storage Water Filtration and Regulation
  • 6.
    Placing a valueon Ecosystem Services?  How do we value the ecosystem services?  Apply some matrix in terms of environmental accounting (e.g. Costanza) or energy consumption (Odum), sometimes called Emergy.  One model commonly used, particularly by urban planners is the URFORE or ECO model.
  • 7.
    The UFORE model  Urban Forest Effects Model – USDA/FS, late 1990’s (recently renamed as ECO, and part of the i-tree suite of forest assessment tools)  UFORE has been used to assess services provided by trees in U.S. cities including Washington D.C., Baltimore, Philadelphia, Minneapolis and San Francisco, natural areas such as Prince William Forest Park (NPS) and even the University of Maryland campus.  UFORE outputs include ecological parameters and ecosystem services
  • 8.
    The i-TREE Suite http://www.itreetools.org/ USDA Forest Service, 2006 plus revisions “By understanding the local, tangible ecosystem services that trees provide, i- Tree users can link urban forest management activities with environmental quality and community livability.”
  • 9.
    Off-the shelf softwareOR design Josh Nadler your own! Taylor Keen
  • 10.
    i-Tree Analysis Tools i-TreeEco (UFORE) provides a broad picture of the entire urban forest. It is designed to use field data from complete inventories or randomly located plots throughout a community along with local hourly air pollution and meteorological data to quantify urban forest structure, environmental effects, impacts of pest infestation and value to communities.
  • 11.
    OTHER TOOLS OFINTEREST OFF THE I-TREE SUITE i-Tree Vue allows you to use of national land cover data maps to assess your community's land cover, including tree canopy, and some of the ecosystem services provided by your current urban forest. i-Tree Streets (Stratum) focuses on the benefits provided by a municipality's street trees. i-Tree Hydro (beta) is a new application designed to simulate the effects of changes in tree and impervious cover on stream flow and water quality. i-Tree Canopy offers a quick and easy way to produce a statistically valid estimate of land cover types (e.g., tree cover)
  • 12.
    OTHER TOOLS OFINTEREST OFF THE i-TREE SUITE i-Tree Design (beta) is a simple online tool that provides a platform for assessments of individual trees at the parcel level. This tool links to Google Maps and allows you to see how tree selection, tree size, and placement around your home effects energy use and other benefits. i-Tree Pest Detection Module is a portable, accessible and standardized protocol for observing a tree for possible insect or disease problems. i-Tree Storm provides a method for a community to assess widespread storm damage in a simple, credible, and efficient manner immediately after a severe storm.
  • 13.
    Example: Prince WilliamForest Park  Located just west of I-95, SW of Washington D.C., in Prince William County, Virginia.  National Park under National Park Service administration since the 1930s.  Previous uses include farmland, pyrite mines, social services during the Great Depression, and training grounds for the precursor to the CIA  Mixture of Atlantic Coastal Plain and Piedmont regions.  Naturally regenerating vegetation but in the urban “footprint”
  • 14.
    Prince William County Manassas Prince William Forest Park
  • 15.
    Sampling Methods  100 random plots within the park, located via GPS coordinates.  Each plot 1/10 acre (approximately 37.2 feet in radius).  ID all woody species in the plot.  Data include DBH, height, height to crown, crown area, dieback, % of crown missing, impervious surfaces and crown light exposure.  Couple these data with weather and air quality data.  Estimates are provided by the model.
  • 17.
    Summary Results • Total number of trees surveyed 5099 • Total estimated trees in the park 5.7 X 10⁶ • Mean trees/hectare 1126 • Mean trees per plot (total) 51 • Number of tree species surveyed 39 • Leaf Area Index 3.36 • Shannon-Weiner Diversity Index 2.45
  • 18.
    Species Composition: alltrees 15.6 22.2 American beech Black tupelo 5.4 Red maple Virginia pine 5.4 Flowering dogwood Tulip tree 5.6 17.5 White oak 6.5 American holly Other species 10.3 11.5
  • 19.
    Proportion of allsampled trees (%) 10 20 30 40 50 60 0 2.5 -7 .62 7.6 3- 15 .2 15 4 .25 -22 .86 22 .87 -30 .48 30 .49 -38 38 .1 .11 -45 .72 45 .73 -53 .34 53 .35 -60 .96 60 DBH (cm) .97 -68 .58 68 .59 -76 76 .2 .21 -83 .82 83 .83 -91 .44 91 .45 -99 99 .06 .07 -10 6.6 8 Size distribution
  • 20.
    Forest Community Composition Relative Relative Leaf Area Importan density Basal Species Frequency Index (m2 ce Value (% of Area (% m-2) (I.V.) total) of total) American beech 90 24.6 11.0 0.86 125.6 Black gum 86 18.0 4.6 0.24 108.6 Red maple 83 11.8 9.3 0.41 104.1 White oak 62 5.3 15.1 0.32 82.4 Tulip poplar 61 5.7 16.5 0.49 73.2 Virginia pine 45 8.2 16.5 0.23 69.7
  • 21.
  • 22.
    Carbon in PWFP Net Average Average Sequestration Sequestration Total Storage Storage (t yr-1) (t ha-1 yr-1) (t) (t ha-1 yr-1) 12,346 + 1,093 2.43 + 0.2 394,241 + 8,698 77.45 + 3.7 Value at $20 t-1 Value at $20 t-1 Value at $20 t-1 Value at $20 t-1 $246,920 $48.60 $7,884,820 $1549
  • 23.
    Carbon Carbon Storage Sequestration Carbon storage (10K metric tons) Estimated net carbon sequestration 0 1 2 3 4 5 6 7 2. (metric tons/year) 5- 7. 62 7. 63 1,000.00 1,500.00 2,000.00 2,500.00 3,000.00 -500.00 500.00 0.00 -1 2. 5. 5- 24 7. 62 15 .2 7. 5- 63 22 -1 .8 5. 6 24 22 15 .8 .2 7- 5- 30 22 .4 .8 8 6 22 30 .8 .4 7- 9- 30 38 .4 .1 8 30 38 .4 .1 9- 1- 38 45 .1 .7 2 38 .1 45 1- .7 45 3- .7 53 2 .3 45 4 .7 3- 53 53 .3 .3 dbh class (cm) 5- 4 60 53 .9 .3 6 5- dbh class (cm) 60 60 .9 .9 7- 6 68 60 .5 .9 8 7- 68 .5 68 8 .5 68 9- 76 .5 .2 9- 76 76 .2 .2 76 1- 83 .2 1- .8 83 2 .8 99 99 2 .0 .0 7- 7- 10 10 Tree size and carbon dynamics 6. 6. 68 68
  • 24.
    Tree Species andcarbon dynamics
  • 25.
    Carbon in PWFP– how does this relate to other area?? PWFP DC- total DC – forest cover Land area (ha) 5090 15900 4550 Sequestration 12,346 + 1,093 16,200 16,200 (t yr-1) ($247K) ($324K) ($324K) Average 2.43 + 0.2 1.02 3.56 Sequestration (t ha-1 yr-1) Total Storage 394,241 + 8,698 526,000 526,000 (t) ($7.9M) ($10.5M) ($10.5M) Average 77.45 + 3.7 33.08 115.60 Storage (t ha-1 yr-1)
  • 26.
    What are someof the threats to our woods and what can we do about them?
  • 27.
    Risk from keyinsects. Fraxinus pennsylvanica (green ash)
  • 28.
    Fraxinus (ash) Trees Emerald Ash Borer EAB Fraxinus comprise 88 of 9000 Inventoried plants = ~1% 41 Fraxinus americana (white ash) @ UMD 47 Fraxinus pennsylvanica (green ash) @ UMD
  • 29.
    2008 UMD UFOREStudy: Potential Pest Impacts
  • 30.
    Pest Damage inDC and UMD Pest UMD % UMD DC % DC Impacted Potential Impacted Potential Loss ($) Loss ($) Asian 27.3 14.7M 34.4 916M longhorned beetle Gypsy moth 20.6 45.2M 13.8 1.39B Dutch elm 2.1 376 T 2.4 112M disease Emerald ash 0.8 2.35M 2.1 72M borer
  • 31.
  • 32.
  • 33.
  • 34.
  • 35.
    Projections of FutureForest Composition
  • 36.
    Some modeles forPWFP The low-emission B2 scenario of the Intergovernmental Panel on Climate Change predicts moderate increases in mean annual global temperature by the end of the twenty-first century. In the next 30 years, 35 out of 39 tree species in PWFP will continue to experience optimal growth conditions. By 2070, however, the model predicts that the number of species that would find the Park optimal would decrease to ten, while one species, witch-hazel (Hamamelis virginiana L.), would experience a climate entirely unsuitable for growth This model also predicts that 10 species would be extirpated from the park by the end of this century and that all current tree species would be in the fringe range or outside of optimal conditions for growth.
  • 37.
    What about thehigher emission models?? By 2070 ALL species would be listed in the unfavorable climate range! Is this true?? What are current emission levels? What does this mean?
  • 38.
    Land Use andFragmentation Deforestation, urban sprawl, agriculture, and other human influences have substantially altered and fragmented our landscape. Such disturbance of the land can change the atmospheric concentration of carbon dioxide, as well as affect local, regional, and global climate by changing the energy balance on Earth's surface. The extent to which land use changes have contributed to global warming is controversial but may account for up to half of the warming reported today. This is only one of the affects of development and land use changes on our environment. Dr. Neel will speak in more detail on this topic in the next presentation.

Editor's Notes

  • #6 Too bad someone didn’t take a better stream shot isn’t it