Use of web mapping tools to tackle local environmental issues
This paper describes some of the recent uses of modern digital mapping tools by local action groups, Parish Councils and independent organisations to visualise environmental issues in order to aid decision making. Over the past 3-6 years, digital map data has become easier to transmit over the Web due to better standards and improvements in the speed and reliability of the Internet. The way in which we view the Web has also changed dramatically with a wide range of internet-enabled devices and this has lead to high profile companies advocating the use of digital mapping, such as Apple, Google and Microsoft, and as a result making it an everyday part of our lives. Professional mapping software and map data has long been an essential aid in decision making processes. However, until recently gaining access to the necessary tools and data was particularly difficult for smaller local organisations due to cost, licencing and available skills. The introduction of the Public Sector Mapping Agreement (PSMA) and the release of Ordnance Survey OpenData played a part in changing this. Once this data was available, companies like Getmapping have been able to build lightweight web-based GIS tools to cater for this sector’s needs. Combining these tools and map layers with Getmapping’s aerial imagery and elevation datasets, national address datasets and other publically-available data such as Natural England layers makes GIS easy to grasp and immediately usable by non-GIS users. Uses of Getmapping’s GIS include assessing the recent flooding in the South West of England by Town and Parish Councils, plotting efficient and environmentally-conscious routes for broadband fibre in Somerset, and visualising the state of the Mendip Area of Outstanding Natural Beauty (AONB). There are, of course, many other potential uses of this GIS system to tackle topical, local issues and some of these will be highlighted.
Geospatial Data for Augmented Reality (GIality) – Democratising In-Field Renewables Visualisation
This paper will introduce the technology and applications for the use of geospatial data within augmented reality (AR) applications. GIality is the convergence of geospatial data and augmented reality and extends the use of AR from technology-preview to real-world business applications. Where augmented reality (AR) is the integration of real-world sensors (ie camera and orientation) with overlay data and imagery on a mobile device (usually as an app for a specific requirement such as marketing or gaming) the introduction of location and scaled 3D models, in combination with geospatial information and map data, provides new and engaging contextual in-field visualisation opportunities for planning, culture & heritage, retail and tourism. We will introduce how, using modern technology drivers including devices such as mobile phones and tablet computers, combined with geospatial positioning, spatial data and services, GIality can bring a new dimension democratisation and community engagement with planning & renewables data. Especially related to planning and renewable energy development, visual impact is one of the primary aspects in the consideration of acceptance under local and national guidance. This is most reported where the impact of wind turbines on the landscape has split political, environmental and consumer opinion. However the current mechanisms and procedures for visual impact assessment (VIA) are based on traditional printed off-site analysis which limits their context, scope and use. This paper introduces a new digital and in-field mobile solution for landscape visual impact analysis – in-field mobile VIA with GIality. The trends for mobile work and play, combined with integrated sensors and social coordination provide the availability and accessibility of tools for both professionals and citizens to democratise and personalise data. The augmentation of as-planned models and geospatial data with device location, attitude and orientation allows individual places of residence, work and play to be equally fairly, rigorously and unambiguously assessed for visual impact and create cost-effective solutions.
Maps are everywhere—on the Internet, in our car, and even on our mobile phone. Moreover, maps of the twenty-first century are not just paper diagrams folded like an accordion. Maps today are colorful, searchable, interactive, and shared. This transformation of the static map into dynamic and interactive multimedia reflects the integration of technological innovation and vast amounts of geographic data. The key technology behind this integration, and subsequently the maps of the twenty-first century, is geographic information systems or GIS.
Data Visualization for Development PlanningWayan Vota
Spiros Voyadzis and Anna Lauridsen from Development Gateway International Brussels attended the 7th European Development Days and presented a session on geocoding entitled “Data Visualization for Development Planning” focused on the Climate Change and African Political Stability Dashboards (CCAPS), which track conflict and environmental conditions across Africa, plus all aid projects in Malawi.
Presented by Stanley Wood (IFPRI/HarvestChoice) at the CGIAR-CSI Annual Meeting 2009: Mapping Our Future. March 31 - April 4, 2009, ILRI Campus, Nairobi, Kenya
[Day 2] Center Presentation: Bioversity and CIATcsi2009
Presented by Andy Jarvis (Bioversity), Andy Farrow (CIAT), and Glenn Hyman (CIAT) at the
CGIAR-CSI Annual Meeting 2009: Mapping Our Future. March 31 - April 4, 2009, ILRI Campus, Nairobi, Kenya
Presented by Mohammad AgusSalim (CIFOR) at the CGIAR-CSI Annual Meeting 2009: Mapping Our Future. March 31 - April 4, 2009, ILRI Campus, Nairobi, Kenya
Presented by Salman Asif Siddiqui (ICIMOD) at the CGIAR-CSI Annual Meeting 2009: Mapping Our Future. March 31 - April 4, 2009, ILRI Campus, Nairobi, Kenya
Presented by Salman Asif Siddiqui (ICIMOD) at the CGIAR-CSI Annual Meeting 2009: Mapping Our Future. March 31 - April 4, 2009, ILRI Campus, Nairobi, Kenya
JMeter webinar - integration with InfluxDB and GrafanaRTTS
Watch this recorded webinar about real-time monitoring of application performance. See how to integrate Apache JMeter, the open-source leader in performance testing, with InfluxDB, the open-source time-series database, and Grafana, the open-source analytics and visualization application.
In this webinar, we will review the benefits of leveraging InfluxDB and Grafana when executing load tests and demonstrate how these tools are used to visualize performance metrics.
Length: 30 minutes
Session Overview
-------------------------------------------
During this webinar, we will cover the following topics while demonstrating the integrations of JMeter, InfluxDB and Grafana:
- What out-of-the-box solutions are available for real-time monitoring JMeter tests?
- What are the benefits of integrating InfluxDB and Grafana into the load testing stack?
- Which features are provided by Grafana?
- Demonstration of InfluxDB and Grafana using a practice web application
To view the webinar recording, go to:
https://www.rttsweb.com/jmeter-integration-webinar
LF Energy Webinar: Electrical Grid Modelling and Simulation Through PowSyBl -...DanBrown980551
Do you want to learn how to model and simulate an electrical network from scratch in under an hour?
Then welcome to this PowSyBl workshop, hosted by Rte, the French Transmission System Operator (TSO)!
During the webinar, you will discover the PowSyBl ecosystem as well as handle and study an electrical network through an interactive Python notebook.
PowSyBl is an open source project hosted by LF Energy, which offers a comprehensive set of features for electrical grid modelling and simulation. Among other advanced features, PowSyBl provides:
- A fully editable and extendable library for grid component modelling;
- Visualization tools to display your network;
- Grid simulation tools, such as power flows, security analyses (with or without remedial actions) and sensitivity analyses;
The framework is mostly written in Java, with a Python binding so that Python developers can access PowSyBl functionalities as well.
What you will learn during the webinar:
- For beginners: discover PowSyBl's functionalities through a quick general presentation and the notebook, without needing any expert coding skills;
- For advanced developers: master the skills to efficiently apply PowSyBl functionalities to your real-world scenarios.
Software Delivery At the Speed of AI: Inflectra Invests In AI-Powered QualityInflectra
In this insightful webinar, Inflectra explores how artificial intelligence (AI) is transforming software development and testing. Discover how AI-powered tools are revolutionizing every stage of the software development lifecycle (SDLC), from design and prototyping to testing, deployment, and monitoring.
Learn about:
• The Future of Testing: How AI is shifting testing towards verification, analysis, and higher-level skills, while reducing repetitive tasks.
• Test Automation: How AI-powered test case generation, optimization, and self-healing tests are making testing more efficient and effective.
• Visual Testing: Explore the emerging capabilities of AI in visual testing and how it's set to revolutionize UI verification.
• Inflectra's AI Solutions: See demonstrations of Inflectra's cutting-edge AI tools like the ChatGPT plugin and Azure Open AI platform, designed to streamline your testing process.
Whether you're a developer, tester, or QA professional, this webinar will give you valuable insights into how AI is shaping the future of software delivery.
GDG Cloud Southlake #33: Boule & Rebala: Effective AppSec in SDLC using Deplo...James Anderson
Effective Application Security in Software Delivery lifecycle using Deployment Firewall and DBOM
The modern software delivery process (or the CI/CD process) includes many tools, distributed teams, open-source code, and cloud platforms. Constant focus on speed to release software to market, along with the traditional slow and manual security checks has caused gaps in continuous security as an important piece in the software supply chain. Today organizations feel more susceptible to external and internal cyber threats due to the vast attack surface in their applications supply chain and the lack of end-to-end governance and risk management.
The software team must secure its software delivery process to avoid vulnerability and security breaches. This needs to be achieved with existing tool chains and without extensive rework of the delivery processes. This talk will present strategies and techniques for providing visibility into the true risk of the existing vulnerabilities, preventing the introduction of security issues in the software, resolving vulnerabilities in production environments quickly, and capturing the deployment bill of materials (DBOM).
Speakers:
Bob Boule
Robert Boule is a technology enthusiast with PASSION for technology and making things work along with a knack for helping others understand how things work. He comes with around 20 years of solution engineering experience in application security, software continuous delivery, and SaaS platforms. He is known for his dynamic presentations in CI/CD and application security integrated in software delivery lifecycle.
Gopinath Rebala
Gopinath Rebala is the CTO of OpsMx, where he has overall responsibility for the machine learning and data processing architectures for Secure Software Delivery. Gopi also has a strong connection with our customers, leading design and architecture for strategic implementations. Gopi is a frequent speaker and well-known leader in continuous delivery and integrating security into software delivery.
Kubernetes & AI - Beauty and the Beast !?! @KCD Istanbul 2024Tobias Schneck
As AI technology is pushing into IT I was wondering myself, as an “infrastructure container kubernetes guy”, how get this fancy AI technology get managed from an infrastructure operational view? Is it possible to apply our lovely cloud native principals as well? What benefit’s both technologies could bring to each other?
Let me take this questions and provide you a short journey through existing deployment models and use cases for AI software. On practical examples, we discuss what cloud/on-premise strategy we may need for applying it to our own infrastructure to get it to work from an enterprise perspective. I want to give an overview about infrastructure requirements and technologies, what could be beneficial or limiting your AI use cases in an enterprise environment. An interactive Demo will give you some insides, what approaches I got already working for real.
Encryption in Microsoft 365 - ExpertsLive Netherlands 2024Albert Hoitingh
In this session I delve into the encryption technology used in Microsoft 365 and Microsoft Purview. Including the concepts of Customer Key and Double Key Encryption.
Smart TV Buyer Insights Survey 2024 by 91mobiles.pdf91mobiles
91mobiles recently conducted a Smart TV Buyer Insights Survey in which we asked over 3,000 respondents about the TV they own, aspects they look at on a new TV, and their TV buying preferences.
Key Trends Shaping the Future of Infrastructure.pdfCheryl Hung
Keynote at DIGIT West Expo, Glasgow on 29 May 2024.
Cheryl Hung, ochery.com
Sr Director, Infrastructure Ecosystem, Arm.
The key trends across hardware, cloud and open-source; exploring how these areas are likely to mature and develop over the short and long-term, and then considering how organisations can position themselves to adapt and thrive.
Epistemic Interaction - tuning interfaces to provide information for AI supportAlan Dix
Paper presented at SYNERGY workshop at AVI 2024, Genoa, Italy. 3rd June 2024
https://alandix.com/academic/papers/synergy2024-epistemic/
As machine learning integrates deeper into human-computer interactions, the concept of epistemic interaction emerges, aiming to refine these interactions to enhance system adaptability. This approach encourages minor, intentional adjustments in user behaviour to enrich the data available for system learning. This paper introduces epistemic interaction within the context of human-system communication, illustrating how deliberate interaction design can improve system understanding and adaptation. Through concrete examples, we demonstrate the potential of epistemic interaction to significantly advance human-computer interaction by leveraging intuitive human communication strategies to inform system design and functionality, offering a novel pathway for enriching user-system engagements.
Epistemic Interaction - tuning interfaces to provide information for AI support
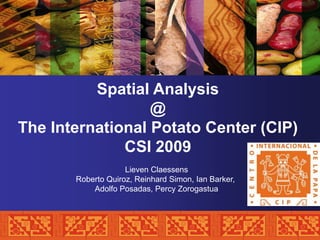
[Day 2] Center Presentation: CIP
1. Spatial Analysis
@
The International Potato Center (CIP)
CSI 2009
Lieven Claessens
Roberto Quiroz, Reinhard Simon, Ian Barker,
Adolfo Posadas, Percy Zorogastua
2. Geographical Presence
South, West and Central Asia
- New Delhi, India
- Tashkent, Uzbekistan
Latin America
& Caribbean
East and Southeast
- Lima, Peru (HQ)
Asia & Pacific:
- Quito, Ecuador
- Lembang-Bandung,
- La Paz, Bolivia
Indonesia
- Beijing, China
- Hanoi, Vietnam
Sub-Saharan Africa:
- Nairobi, Kenya
- Kampala, Uganda
- Maputo, Mozambique
- Lilongwe, Malawi
- Huambo, Angola
4. Spatial Data and Analysis @ CIP:
Data Management / Sharing
• Genebank data management
• (Sweet) Potato Atlas:
- Geography / Potential production zones
• Contributions to Geonetwork: - Spatial data on (sweet) potato
- Climate surfaces
• DIVA-GIS…
Modeling and GIS
• System Analysis (‘Tradeoff Analysis’)
• Digital Soil Mapping
• Environmental Vulnerability Assessment
• Climate Change applications
• Pest and Disease modeling
Remote Sensing
• Disease detection
• Cropping areas / crop statistics
5. Data Management / Sharing
• Genebank data management:
- Linkage of in-situ & ex-situ genebank management (potato parque Cuzco)
- ‘Participatory’ GIS
6. Modeling and GIS
• Ag. System Analysis (Tradeoffs production ~ env.):
- Modeling scenarios of technology and policy interventions
- Tradeoff Analysis framework: coupled bio-physical and econometric models
- Spatially explicit (depending on research question)
Effects of market prices on soil nutrient depletion
Ex ante impact assessment of introducing improved varieties in CC context
Effects of adapting ICM practices on soil fertility/health
Land use change / intensification scenarios
Effects of water harvesting (e.g. terracing) on yields and poverty
www.tradeoffs.nl
7. Modeling and GIS
• Environmental Vulnerability Assessment:
- Modeling scenarios of agricultural intensification
Land Degradation (e.g. landslides, water erosion)
Nutrient depletion
Pesticide leaching
8. Modeling and GIS
• Potential soil erosion in Africa (ILRI):
- Secondary data: climate, soils, topography, landcover, hydrology
- (R)USLE + attempts on using physically based model (LAPSUS)
9. Modeling and GIS
• Climate Change applications:
- Drought mapping based on RS (time series of NDVI)
Drought Probability Index
Drought Probability Index
‘Normal’
El Niño
Max NDVI Min NDVI Current NDVI PCC Drought Map
10. Modeling and GIS
• Climate Change applications:
- Ex ante assessment of adaptation technologies/policies
(e.g. introduction of drought-, heat-, disease - tolerant or short duration varieties,…)
- Collaboration with Max Planck Institute for Metereology on regional climate modeling
- Wavelet tools for rainfall mapping (climate extremes)
Vulnerability to Climate extremes: Wavelet tools for rainfall mapping
(ppm)
HUANCANE
50
40
m.m.
30
20
10
0
1-Jan-99 20-Jul-99 5-Feb-00 23-Aug-00 11-Mar-01 27-Sep-01 15-Apr-02 1-Nov-02
Días
11. Modeling and GIS
• Pest and Disease modeling:
- Linking pest and disease modeling with spatial predictions of environmental conditions
(e.g. Potato Tuber Moth lifecycle & Late Blight modeling linked to Climate Change)
B
A
12. Modeling and GIS
• Pest and Disease modeling:
- Risk mapping of Potato yellow vein virus
13. Remote Sensing
• Disease Detection:
- Low cost air-borne platforms for high resolution RS
- Spectral signatures of disease symptoms
- Early warning applications
(e.g. potato yellow vein virus transmitted by whiteflies)
15. Remote Sensing
• Crop statistics / areas:
- High resolution satellite imagery (SPOT, 10 and 5 m)
- Digital processing to discriminate small sweet potato fields from others
- Results indicate only 63% of crop area in national statistics
- Seeking collaboration for commodity atlasses!
ORANGE FIELDS = SP