Downloaded 21 times

![E. References
Air transportation. (2014). Encyclopedia of Global Industries. Retrieved from Business Insights:
Essentials database.
American airlines. (2014). Retrieved October 22, 2014, from http://www.aa.com/homePage.do
Delta. (2014). Retrieved October 22, 2014, from http://www.delta.com/
Delta. (2014, September 22). Delta commercial no bag left behind [Video file]. Retrieved from
https://www.youtube.com/watch?v=U1vsRezK7v0
Draper, D. J. (2013). Leading information technology innovators in the hospitality and travel
industry, 2013. Business Rankings Annual, (September). Retrieved from Business Insights:
Essentials database.
Draper, D. J. (2013). Top North American airlines by passengers, 2012. Business Rankings
Annual, (July), 43. Retrieved from Business Insights: Essentials database.
Draper, D. J. (2014). Best major U.S. airlines, 2013. Business Rankings Annual, (January).
Retrieved from Business Insights: Essentials database.
Fall 2011 NHCS adult study 06-month [Chart]. (2014, October 22). Retrieved from Simmons
OneView database.
JetBlue. (2014). Retrieved October 22, 2014, from http://www.jetblue.com/
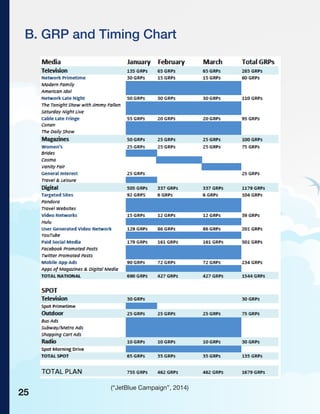
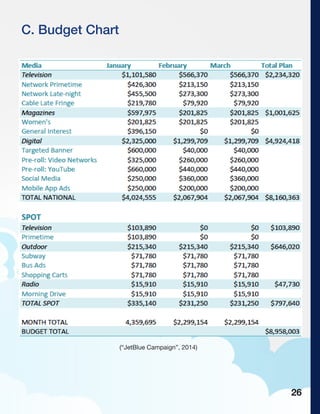
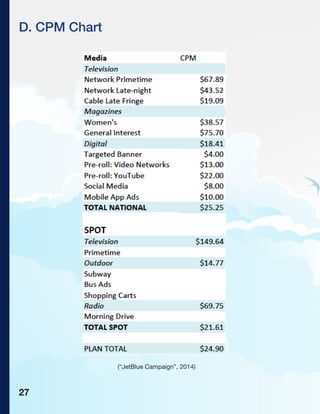
JetBlue campaign [Table]. (2014, December 7). Retrieved from Media Flight Plan database.
Kantar Media. (2010). Airline advertising by medium [Chart].
Levere, J. L. (2014, March 17). American Airlines focuses on the glory days of flying. Retrieved
December 7, 2014, from http://www.nytimes.com/2014/03/17/business/media/american-
airlines-focuses-on-the-glory-days-of-flying.html?_r=1
MRI Doublebase. (2009). JetBlue case MRI data [Table].
Nudd, T. (2014, April 23). JetBlue’s pigeon reflects on human foibles in web series from funny
or die. Retrieved December 7, 2014, from http://www.adweek.com/adfreak/jetblues-pigeon-
reflects-human-foibles-web-series-funny-or-die-157205
Revenue by company [Chart]. (2014). Retrieved from Business Insights: Essentials database.
Revenue by industry [Chart]. (2014). Retrieved from Business Insights: Essentials database.
30](https://image.slidesharecdn.com/momentummarketingjetbluemediaplan-151023062542-lva1-app6891/85/JetBlue-Media-Plan-31-320.jpg)
![Rooney, J. (2014, April 2). Pigeons take flight in JetBlue’s new campaign. Retrieved
October 22, 2014, from http://www.forbes.com/sites/jenniferrooney/2014/04/02/
pigeons-take-flight-in-jetblues-new-campaign/
Southwest airlines. (2014). Retrieved October 22, 2014, from https://www.southwest.
com/
Southwest Airlines Co. (2014). Southwest heart. Retrieved December 7, 2014, from
http://www.southwest-heart.com/
SRDS. (2009). Lifestyle analysis reports: market potential report [Chart].
United airlines. (2014). Retrieved October 22, 2014, from https://www.united.com/web/
en-US/default.aspx?root=1
United Airlines, Inc. (2014). United hub. Retrieved December 7, 2014, from https://hub.
united.com/en-us/flyerfriendly/pages/default.aspx
US airways. (2014). Retrieved October 22, 2014, from http://www.usairways.com/
default.aspx
31](https://image.slidesharecdn.com/momentummarketingjetbluemediaplan-151023062542-lva1-app6891/85/JetBlue-Media-Plan-32-320.jpg)


The media plan outlines JetBlue's strategies to differentiate the airline and increase brand awareness, targeting primarily women aged 25-34 and retirees aged 55-64, with a budget of $9 million focused on digital media. JetBlue aims to increase passenger seat miles by 5% and vacation traveler shares by 5% during the spring and summer months, while promoting its high-quality flights at competitive prices. The campaign will run from January to March, leveraging a mix of targeted digital advertising, traditional media, and key selling points such as premium in-flight entertainment and comfort.


