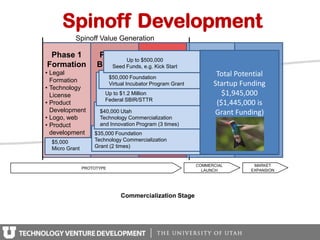
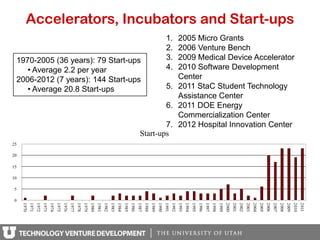
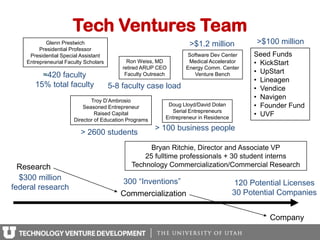
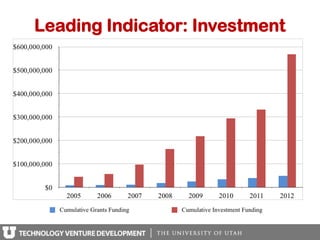
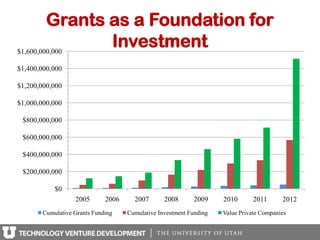
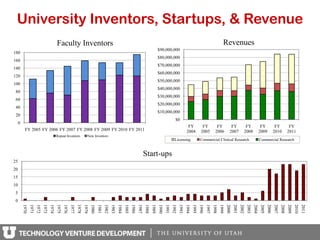
Papers, Patents and …


      Products
              Jack Brittain, PhD
        Pierre Lassonde Presidential Chair
                 University of Utah

       http://www.techventures.utah.edu/
Economic Significance
“The economic significance of the research university goes
far beyond its role of education and training. For several
decades, university research has increasingly formed the
foundation of significant technological advancements.
These technologies enter the marketplace through research
collaborations with industry, licenses, and to an increasing
extent, university-driven efforts to turn new ideas into start-
up companies.”
 Jan Crispin, Senior Research Economist.
 The Economic Impact of Startup Companies
 and Invention Licensees Originating from
 Research at the University of Utah.
 Bureau of Economic and Business Research,
 2011.
Technology Value Curve

                          Spinoff Value
                           Generation         Venture Bench Services
                                                • Prototype
  Where Universities
Traditionally Add Value
                                                • Incorporation
                                                • Logo/website
                                                • Corporate Secretary
                                                • CFO Solutions
                                                • Umbrella Insurance
                                                • Market research
                                                • Grants programs
            PROOF OF                      COMMERCIAL    MARKET
  IDEA                      PROTOTYPE
            CONCEPT                         LAUNCH     EXPANSION


                          Commercialization Stage
Small-Light-Fast
      Money
• Small amounts with immediate
  milestones (4 months or less)
    money chases success as milestones accumulate

• Light regulation and administration
    little administrative overhead in making awards
    universities recommend
    accountability is for university’s portfolio results
• Fast decisions sustain technology development
  momentum, facilitate continuity of effort
Spinoff Development
           Spinoff Value Generation

 Phase 1             Phase 2         Phase 3                 Phase 4
                             Up to $500,000
Formation            Business Operating
                        Seed Funds, e.g. Kick Start          Market
• Legal             • Business           • Customers          Entry Total Potential
                         $50,000 Foundation
  Formation           Plan                 Testing         • Marketing/
• Technology
                         Virtual Incubator Program Grant
                    • Product              Product
                                                                   Startup Funding 5
                                                                             Phase
                                                             Sales
  License               Up to $1.2 Million Investors
                      Validation         •                 • Strategic
                                                                       $1,945,000 Term
                                                                            Long
                        Federal SBIR/STTR
• Product           • Product            • Key                      ($1,445,000 is
                                                             Partnerships     Growth
  Development         development
                      $40,000 Utah         Managers        • New Grant Funding)
• Logo, web           grants             • Board of
                      Technology Commercialization          Products &
• Product           • Angel &
                      and Innovation Program (3 times)
                                           Directors        IP in
  development       $35,000 Foundation • Bank Credit
                      Seed                                  development
  grants
   $5,000             Investors
                    Technology Commercialization
  Micro Grant       Grant (2 times)


                                                            COMMERCIAL        MARKET
                PROTOTYPE
                                                              LAUNCH         EXPANSION


                               Commercialization Stage
Accelerators, Incubators and Start-ups
                                        1.   2005 Micro Grants
                                        2.   2006 Venture Bench
1970-2005 (36 years): 79 Start-ups      3.   2009 Medical Device Accelerator
   • Average 2.2 per year               4.   2010 Software Development
2006-2012 (7 years): 144 Start-ups           Center
   • Average 20.8 Start-ups               5. 2011 StaC Student Technology
                                             Assistance Center
                                          6. 2011 DOE Energy
                                             Commercialization Center
                                          7. 2012 Hospital Innovation Center
                                  Start-ups
Tech Ventures Team
            Glenn Prestwich                                         >$1.2 million            >$100 million
         Presidential Professor
     Presidential Special Assistant                                 Software Dev Center     Seed Funds
    Entrepreneurial Faculty Scholars         Ron Weiss, MD          Medical Accelerator     • KickStart
                                           retired ARUP CEO        Energy Comm. Center
                                                                                            • UpStart
         ≈420 faculty                       Faculty Outreach          Venture Bench
                                                                                            • Lineagen
       15% total faculty               5-8 faculty case load                                • Vendice
                              Troy D’Ambrosio
                                                                                            • Navigen
                           Seasoned Entrepreneur            Doug Lloyd/David Dolan          • Founder Fund
                                                             Serial Entrepreneurs
                                Raised Capital
                                                           Entrepreneur in Residence
                                                                                            • UVF
                       Director of Education Programs
                                                        > 100 business people
                          > 2600 students
                                                    Bryan Ritchie, Director and Associate VP
                                                  25 fulltime professionals + 30 student interns
  Research                                    Technology Commercialization/Commercial Research
  $300 million                             300 “Inventions”                            120 Potential Licenses
federal research
                                          Commercialization                            30 Potential Companies


                                                                                                Company
Leading Indicator: Investment
Grants as a Foundation for
$1,600,000,000
                Investment
$1,400,000,000

$1,200,000,000

$1,000,000,000

 $800,000,000

 $600,000,000

 $400,000,000

 $200,000,000

           $0
                  2005       2006     2007       2008      2009     2010       2011      2012
       Cumulative Grants Funding    Cumulative Investment Funding   Value Private Companies
Net Results
• Spanning Valley of Death
  • The Gully of Inconvenience
• Leverages investor dollars
• Community engagement
  • Student Opportunities:
    Pole Vault Media
  • Entrepreneurs In Residence
  • Commercialization Advisory
    Board/Company Collaborations
University Inventors, Startups, & Revenue
                                            Faculty Inventors                                                                                                                                                          Revenues
                                                                                                                                                     $90,000,000
180
                                                                                                                                                     $80,000,000
160
                                                                                                                                                     $70,000,000
140
                                                                                                                                                     $60,000,000
120
                                                                                                                                                     $50,000,000
100
                                                                                                                                                     $40,000,000
 80
                                                                                                                                                     $30,000,000
 60
                                                                                                                                                     $20,000,000
 40
                                                                                                                                                     $10,000,000
 20
                                                                                                                                                                      $0
     0
                                                                                                                                                                                   FY            FY             FY             FY                FY             FY            FY            FY
           FY 2005 FY 2006 FY 2007 FY 2008 FY 2009 FY 2010 FY 2011                                                                                                                2004          2005           2006           2007              2008           2009          2010          2011
                                            Repeat Inventors               New Inventors
                                                                                                                                                                     Licensing                  Commercial Clinical Research                                   Commercial Research


                                                                                                                                       Start-ups
25
20
15
10
 5
 0
         1970
                1971
                       1972
                              1973
                                     1974
                                            1975
                                                   1976
                                                          1977
                                                                 1978
                                                                        1979
                                                                               1980
                                                                                      1981
                                                                                             1982
                                                                                                    1983
                                                                                                           1984
                                                                                                                  1985
                                                                                                                         1986
                                                                                                                                1987
                                                                                                                                       1988
                                                                                                                                              1989
                                                                                                                                                     1990
                                                                                                                                                            1991
                                                                                                                                                                   1992
                                                                                                                                                                          1993
                                                                                                                                                                                 1994
                                                                                                                                                                                        1995
                                                                                                                                                                                               1996
                                                                                                                                                                                                      1997
                                                                                                                                                                                                             1998
                                                                                                                                                                                                                    1999
                                                                                                                                                                                                                           2000
                                                                                                                                                                                                                                  2001
                                                                                                                                                                                                                                         2002
                                                                                                                                                                                                                                                 2003
                                                                                                                                                                                                                                                        2004
                                                                                                                                                                                                                                                               2005
                                                                                                                                                                                                                                                                      2006
                                                                                                                                                                                                                                                                             2007
                                                                                                                                                                                                                                                                                    2008
                                                                                                                                                                                                                                                                                           2009
                                                                                                                                                                                                                                                                                                  2010
                                                                                                                                                                                                                                                                                                         2011
Total Mission Integration
• Educational programs > 2600 students
   Defining educational experience
   Huge positive for faculty
• Donor gifts over $35 million
   Lassonde Center
   Sorenson Discovery Center
   Annual sponsorships over $1 million
• University Venture Fund
   manages $18.5 million in Fund I
   Fund II target is $30 million
Returns from
            Commercialization
• Dollars are in
  – Equity and royalties
  – Research back to the University
  – Donations and other support

• Industry-sponsored
  research yields more than
  license income
Utah Economic Impact from
                University of Utah Research
                                  Total External           Operating                                   Total
         FY 2010                 Research Funds             Spinoff             Total                 Annual          Total Tax
                                  Spent in Utah            Companies         Employment[1]            Payroll       Contribution[2]
External Research
Funding (total =                   $388 million                                    8,906           $378 million     $33.4 million
$451 million)
Technology
Commercialization                                               150               19,818           $947 million     $96.2 million
(19 new in FY10)
Total                              $388 million                 150               28,724            $1.3 billion    $129.6 million


[1]   Bureau of Economic and Business Research, 2010 and 2011. Includes direct, indirect, and induced employment.
[2]   State and local taxes.
What Worked for Utah
• Leverage/OPM
  – Grants
  – Donors
  – Effort

• Fund Critical Paths
  – Monitor milestones
  – Do not fund “no results”
  – Post performance funding:
    money chases success

• Outcomes depend on shots on goal
  – control strangles speed and momentum
  – place small bets with immediate milestones

• Capital formation is about outcomes
Reinvented University
         Commercialization
• Changed from cost recovery to investment model
 – Cost recovery is inevitably a failure
 – Changed the nature of our work to the positive
• Commercial sponsored research
  = sustainable business model
• Total mission integration
  = strategic engagement
• Evolved structure
Universities and the
     Innovation
     Ecosystem
“Universities do not get enough credit for
the fact that as players in our innovation
ecosystem, they’re willing to gamble on
cash-strapped startups. At the end of the
day, who else is offering to pick up the
tab? … Warts and all, universities remain
willing to pay patent costs to support
expensive and increasingly sophisticated
IP strategies for startups who will likely
never be able to pay them back.”
  - Melba Kurman, Triple Helix Blog, 25 Feb 2011

Jack Brittain

  • 1.
    Papers, Patents and… Products Jack Brittain, PhD Pierre Lassonde Presidential Chair University of Utah http://www.techventures.utah.edu/
  • 2.
    Economic Significance “The economicsignificance of the research university goes far beyond its role of education and training. For several decades, university research has increasingly formed the foundation of significant technological advancements. These technologies enter the marketplace through research collaborations with industry, licenses, and to an increasing extent, university-driven efforts to turn new ideas into start- up companies.” Jan Crispin, Senior Research Economist. The Economic Impact of Startup Companies and Invention Licensees Originating from Research at the University of Utah. Bureau of Economic and Business Research, 2011.
  • 3.
    Technology Value Curve Spinoff Value Generation Venture Bench Services • Prototype Where Universities Traditionally Add Value • Incorporation • Logo/website • Corporate Secretary • CFO Solutions • Umbrella Insurance • Market research • Grants programs PROOF OF COMMERCIAL MARKET IDEA PROTOTYPE CONCEPT LAUNCH EXPANSION Commercialization Stage
  • 4.
    Small-Light-Fast Money • Small amounts with immediate milestones (4 months or less)  money chases success as milestones accumulate • Light regulation and administration  little administrative overhead in making awards  universities recommend  accountability is for university’s portfolio results • Fast decisions sustain technology development momentum, facilitate continuity of effort
  • 5.
    Spinoff Development Spinoff Value Generation Phase 1 Phase 2 Phase 3 Phase 4 Up to $500,000 Formation Business Operating Seed Funds, e.g. Kick Start Market • Legal • Business • Customers Entry Total Potential $50,000 Foundation Formation Plan Testing • Marketing/ • Technology Virtual Incubator Program Grant • Product Product Startup Funding 5 Phase Sales License Up to $1.2 Million Investors Validation • • Strategic $1,945,000 Term Long Federal SBIR/STTR • Product • Product • Key ($1,445,000 is Partnerships Growth Development development $40,000 Utah Managers • New Grant Funding) • Logo, web grants • Board of Technology Commercialization Products & • Product • Angel & and Innovation Program (3 times) Directors IP in development $35,000 Foundation • Bank Credit Seed development grants $5,000 Investors Technology Commercialization Micro Grant Grant (2 times) COMMERCIAL MARKET PROTOTYPE LAUNCH EXPANSION Commercialization Stage
  • 6.
    Accelerators, Incubators andStart-ups 1. 2005 Micro Grants 2. 2006 Venture Bench 1970-2005 (36 years): 79 Start-ups 3. 2009 Medical Device Accelerator • Average 2.2 per year 4. 2010 Software Development 2006-2012 (7 years): 144 Start-ups Center • Average 20.8 Start-ups 5. 2011 StaC Student Technology Assistance Center 6. 2011 DOE Energy Commercialization Center 7. 2012 Hospital Innovation Center Start-ups
  • 7.
    Tech Ventures Team Glenn Prestwich >$1.2 million >$100 million Presidential Professor Presidential Special Assistant Software Dev Center Seed Funds Entrepreneurial Faculty Scholars Ron Weiss, MD Medical Accelerator • KickStart retired ARUP CEO Energy Comm. Center • UpStart ≈420 faculty Faculty Outreach Venture Bench • Lineagen 15% total faculty 5-8 faculty case load • Vendice Troy D’Ambrosio • Navigen Seasoned Entrepreneur Doug Lloyd/David Dolan • Founder Fund Serial Entrepreneurs Raised Capital Entrepreneur in Residence • UVF Director of Education Programs > 100 business people > 2600 students Bryan Ritchie, Director and Associate VP 25 fulltime professionals + 30 student interns Research Technology Commercialization/Commercial Research $300 million 300 “Inventions” 120 Potential Licenses federal research Commercialization 30 Potential Companies Company
  • 8.
  • 9.
    Grants as aFoundation for $1,600,000,000 Investment $1,400,000,000 $1,200,000,000 $1,000,000,000 $800,000,000 $600,000,000 $400,000,000 $200,000,000 $0 2005 2006 2007 2008 2009 2010 2011 2012 Cumulative Grants Funding Cumulative Investment Funding Value Private Companies
  • 10.
    Net Results • SpanningValley of Death • The Gully of Inconvenience • Leverages investor dollars • Community engagement • Student Opportunities: Pole Vault Media • Entrepreneurs In Residence • Commercialization Advisory Board/Company Collaborations
  • 11.
    University Inventors, Startups,& Revenue Faculty Inventors Revenues $90,000,000 180 $80,000,000 160 $70,000,000 140 $60,000,000 120 $50,000,000 100 $40,000,000 80 $30,000,000 60 $20,000,000 40 $10,000,000 20 $0 0 FY FY FY FY FY FY FY FY FY 2005 FY 2006 FY 2007 FY 2008 FY 2009 FY 2010 FY 2011 2004 2005 2006 2007 2008 2009 2010 2011 Repeat Inventors New Inventors Licensing Commercial Clinical Research Commercial Research Start-ups 25 20 15 10 5 0 1970 1971 1972 1973 1974 1975 1976 1977 1978 1979 1980 1981 1982 1983 1984 1985 1986 1987 1988 1989 1990 1991 1992 1993 1994 1995 1996 1997 1998 1999 2000 2001 2002 2003 2004 2005 2006 2007 2008 2009 2010 2011
  • 12.
    Total Mission Integration •Educational programs > 2600 students  Defining educational experience  Huge positive for faculty • Donor gifts over $35 million  Lassonde Center  Sorenson Discovery Center  Annual sponsorships over $1 million • University Venture Fund  manages $18.5 million in Fund I  Fund II target is $30 million
  • 13.
    Returns from Commercialization • Dollars are in – Equity and royalties – Research back to the University – Donations and other support • Industry-sponsored research yields more than license income
  • 14.
    Utah Economic Impactfrom University of Utah Research Total External Operating Total FY 2010 Research Funds Spinoff Total Annual Total Tax Spent in Utah Companies Employment[1] Payroll Contribution[2] External Research Funding (total = $388 million 8,906 $378 million $33.4 million $451 million) Technology Commercialization 150 19,818 $947 million $96.2 million (19 new in FY10) Total $388 million 150 28,724 $1.3 billion $129.6 million [1] Bureau of Economic and Business Research, 2010 and 2011. Includes direct, indirect, and induced employment. [2] State and local taxes.
  • 15.
    What Worked forUtah • Leverage/OPM – Grants – Donors – Effort • Fund Critical Paths – Monitor milestones – Do not fund “no results” – Post performance funding: money chases success • Outcomes depend on shots on goal – control strangles speed and momentum – place small bets with immediate milestones • Capital formation is about outcomes
  • 16.
    Reinvented University Commercialization • Changed from cost recovery to investment model – Cost recovery is inevitably a failure – Changed the nature of our work to the positive • Commercial sponsored research = sustainable business model • Total mission integration = strategic engagement • Evolved structure
  • 17.
    Universities and the Innovation Ecosystem “Universities do not get enough credit for the fact that as players in our innovation ecosystem, they’re willing to gamble on cash-strapped startups. At the end of the day, who else is offering to pick up the tab? … Warts and all, universities remain willing to pay patent costs to support expensive and increasingly sophisticated IP strategies for startups who will likely never be able to pay them back.” - Melba Kurman, Triple Helix Blog, 25 Feb 2011

Editor's Notes

  • #2 Ambassador commentsNot entrepreneurship Entrepreneurship programs very important to us Commercialization is a discipline entrepreneurship is just one path