Downloaded 18 times
![Metricon 4.0: The importance of context Security measures as a dependent variable Data reveals foundational practices that optimize security and operations Kurt Milne Managing Director, IT Process Institute [email_address] Gene Kim CTO, Co-Founder, Tripwire, Inc. [email_address] , @RealGeneKim](https://image.slidesharecdn.com/itpimetricon0906afinal-100725031804-phpapp01/85/Itpi-metricon-0906a-final-1-320.jpg)
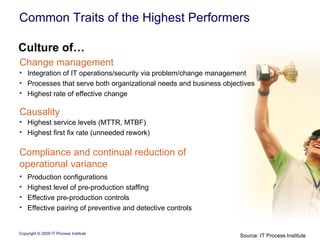
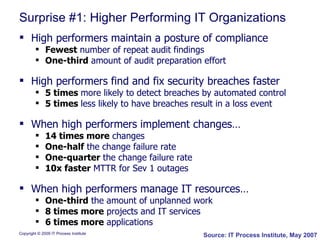
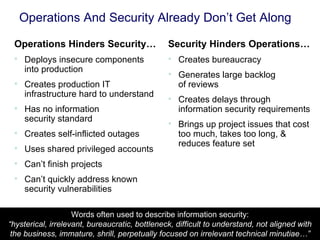
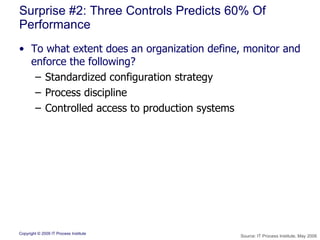
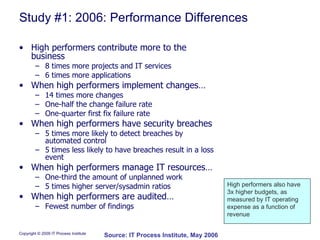
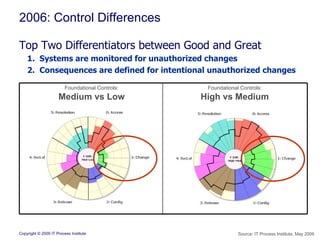
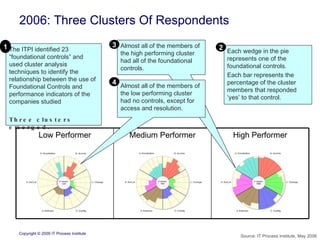
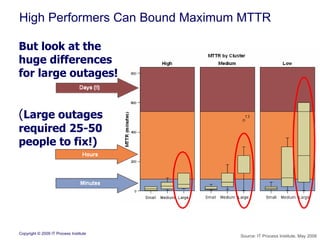
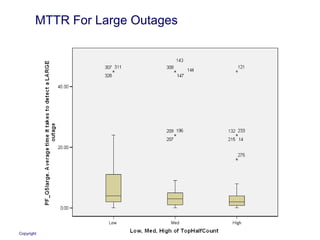
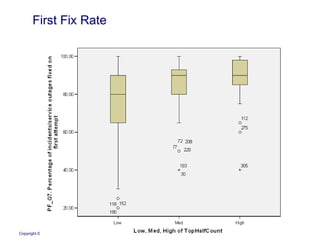
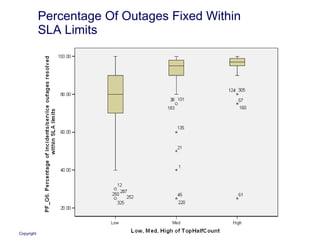
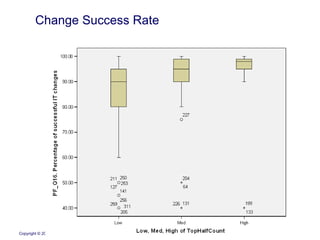
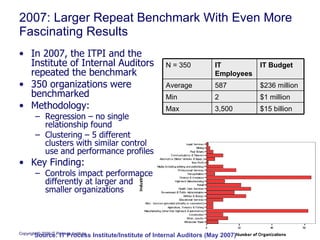
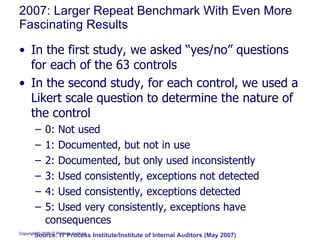
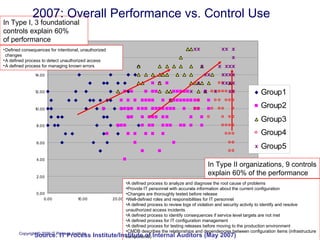
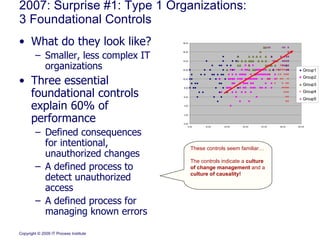
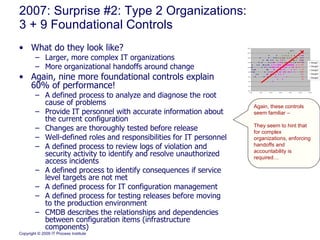
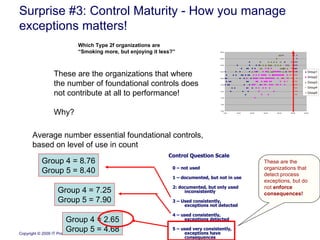

The document discusses research conducted by the IT Process Institute on the relationship between IT controls and organizational performance. The research found that: 1) Higher performing organizations consistently implement a small number of "foundational" IT controls related to change management, access controls, and configuration management. 2) For larger organizations, nine additional controls around release management, problem management, and service level management help explain performance differences. 3) How organizations manage exceptions to IT processes, through detection and enforcement of consequences, is a key factor in performance. Those that do not enforce consequences see less benefit from controls.


![[Cicle de subvencions 2010] subvencions de l ajuntament](https://cdn.slidesharecdn.com/ss_thumbnails/cicledesubvencions2010subvencionsdelajuntament-100720030825-phpapp02-thumbnail.jpg?width=640&height=640&fit=bounds)


