Download to read offline

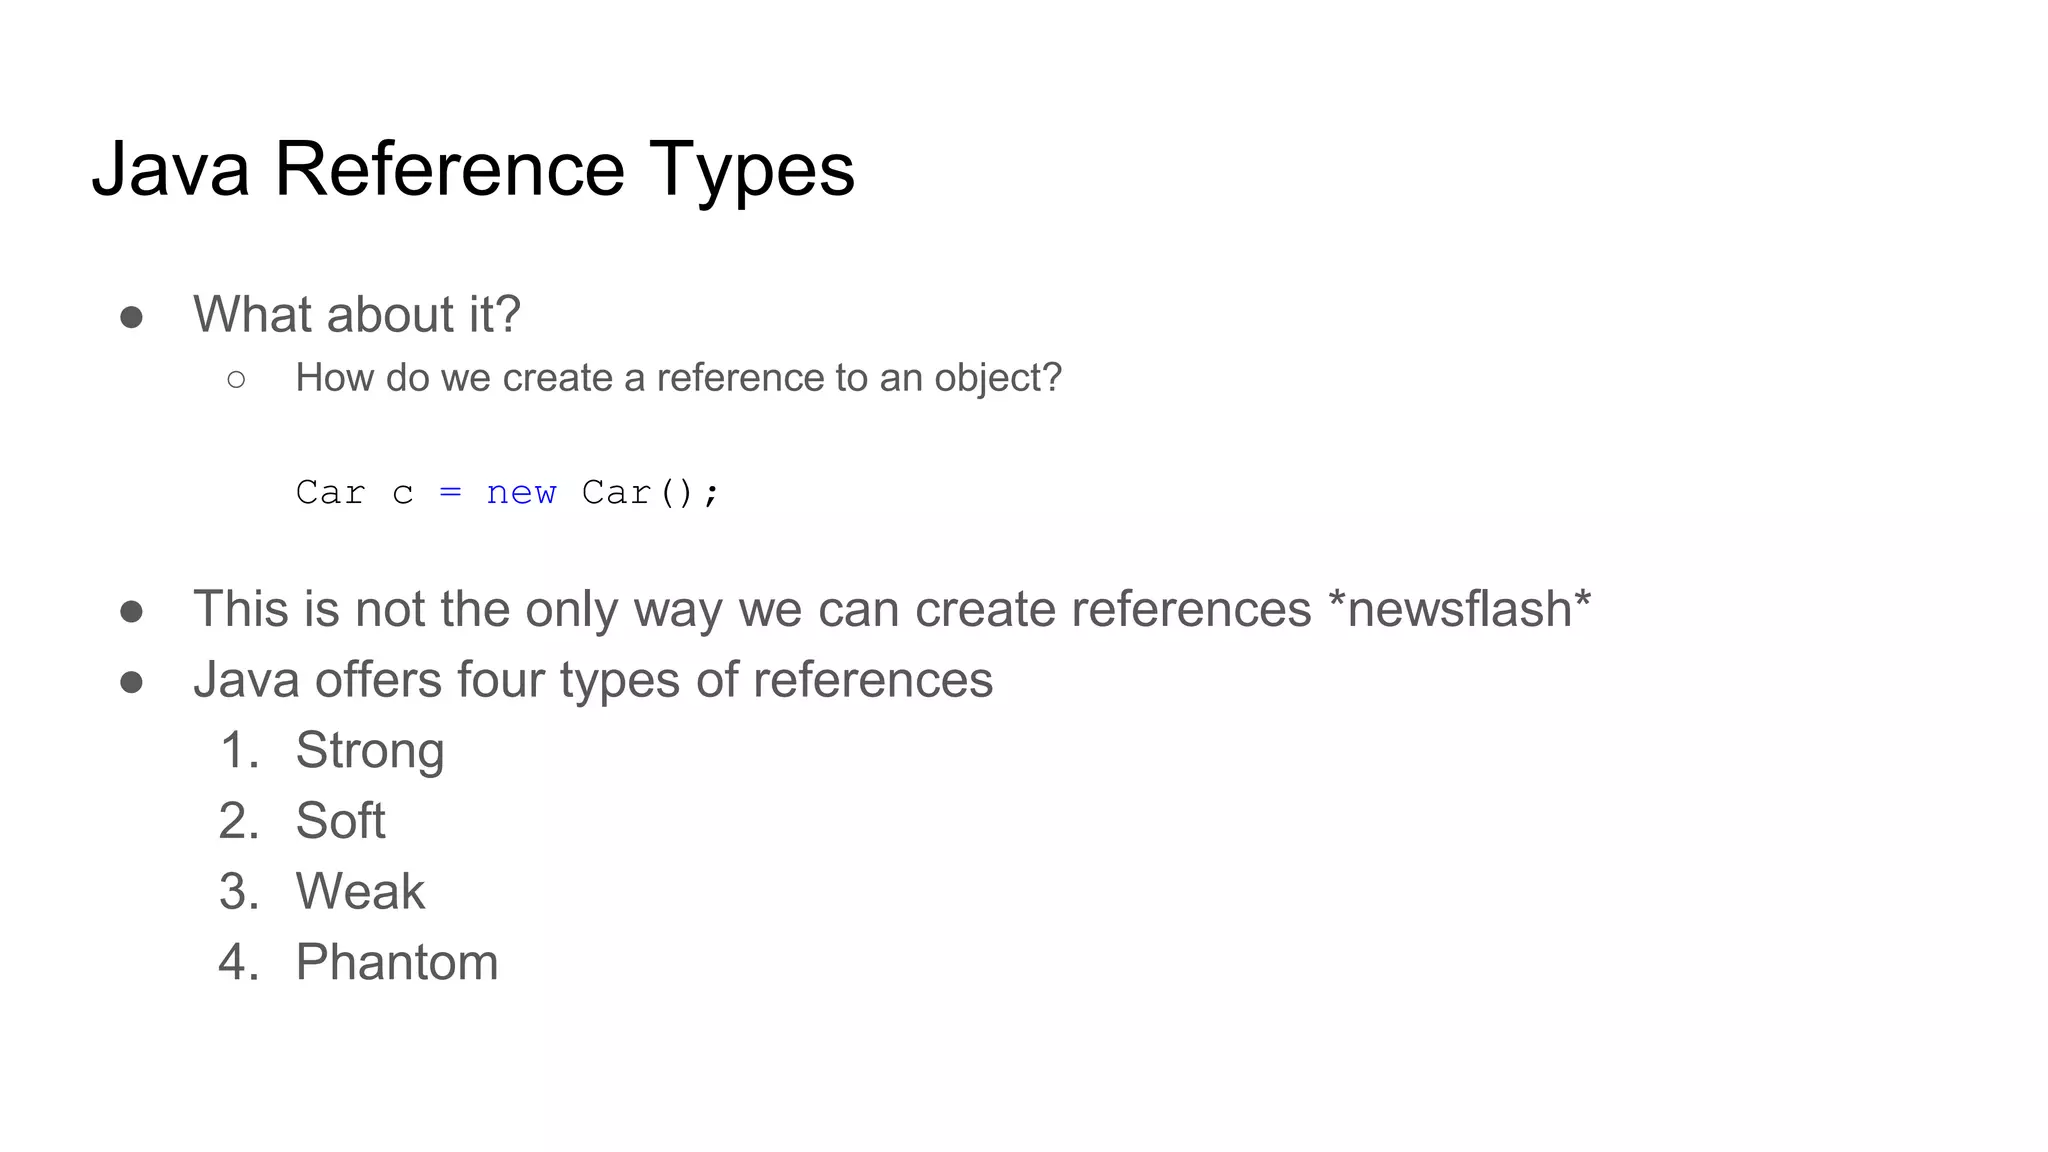
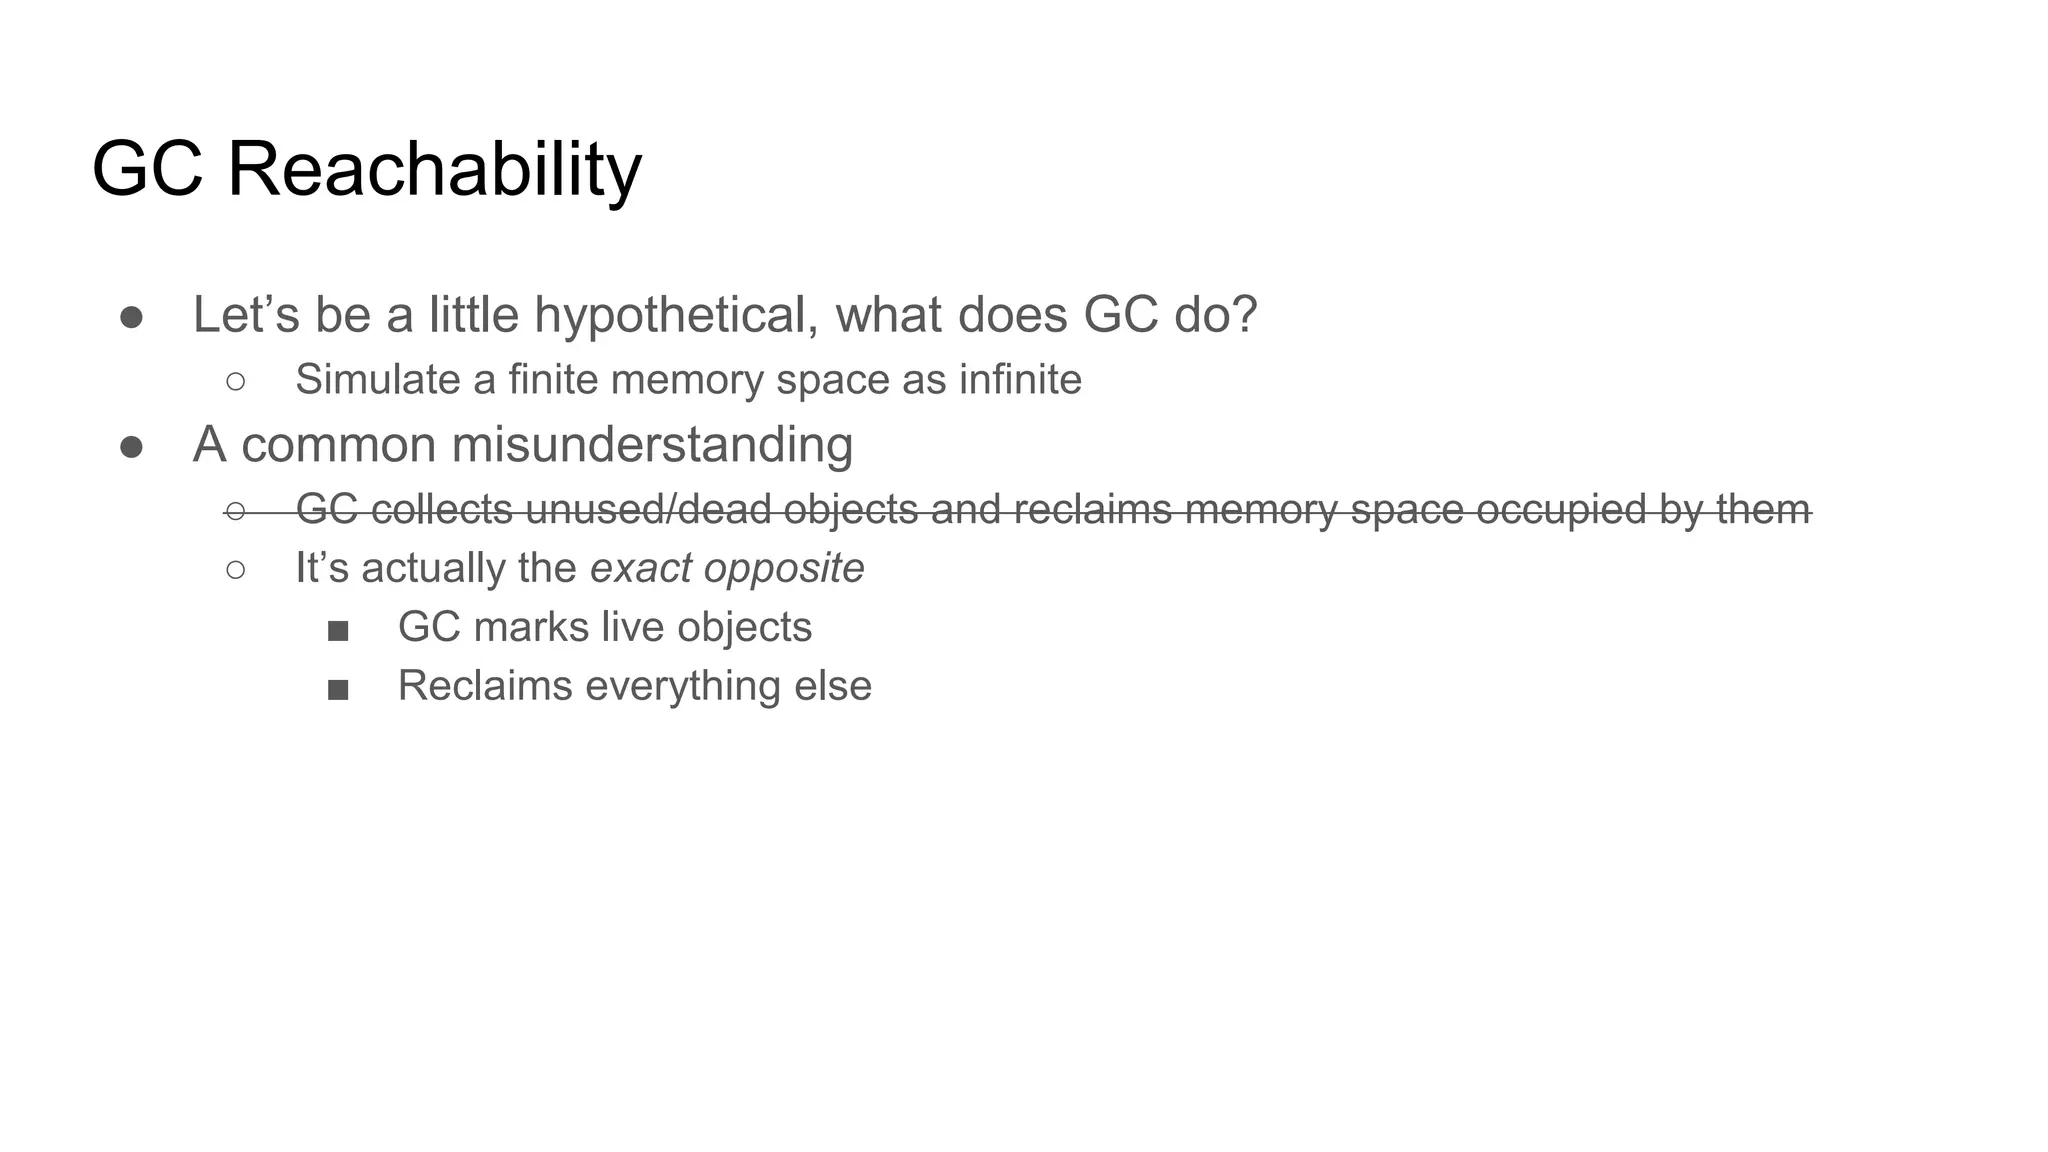
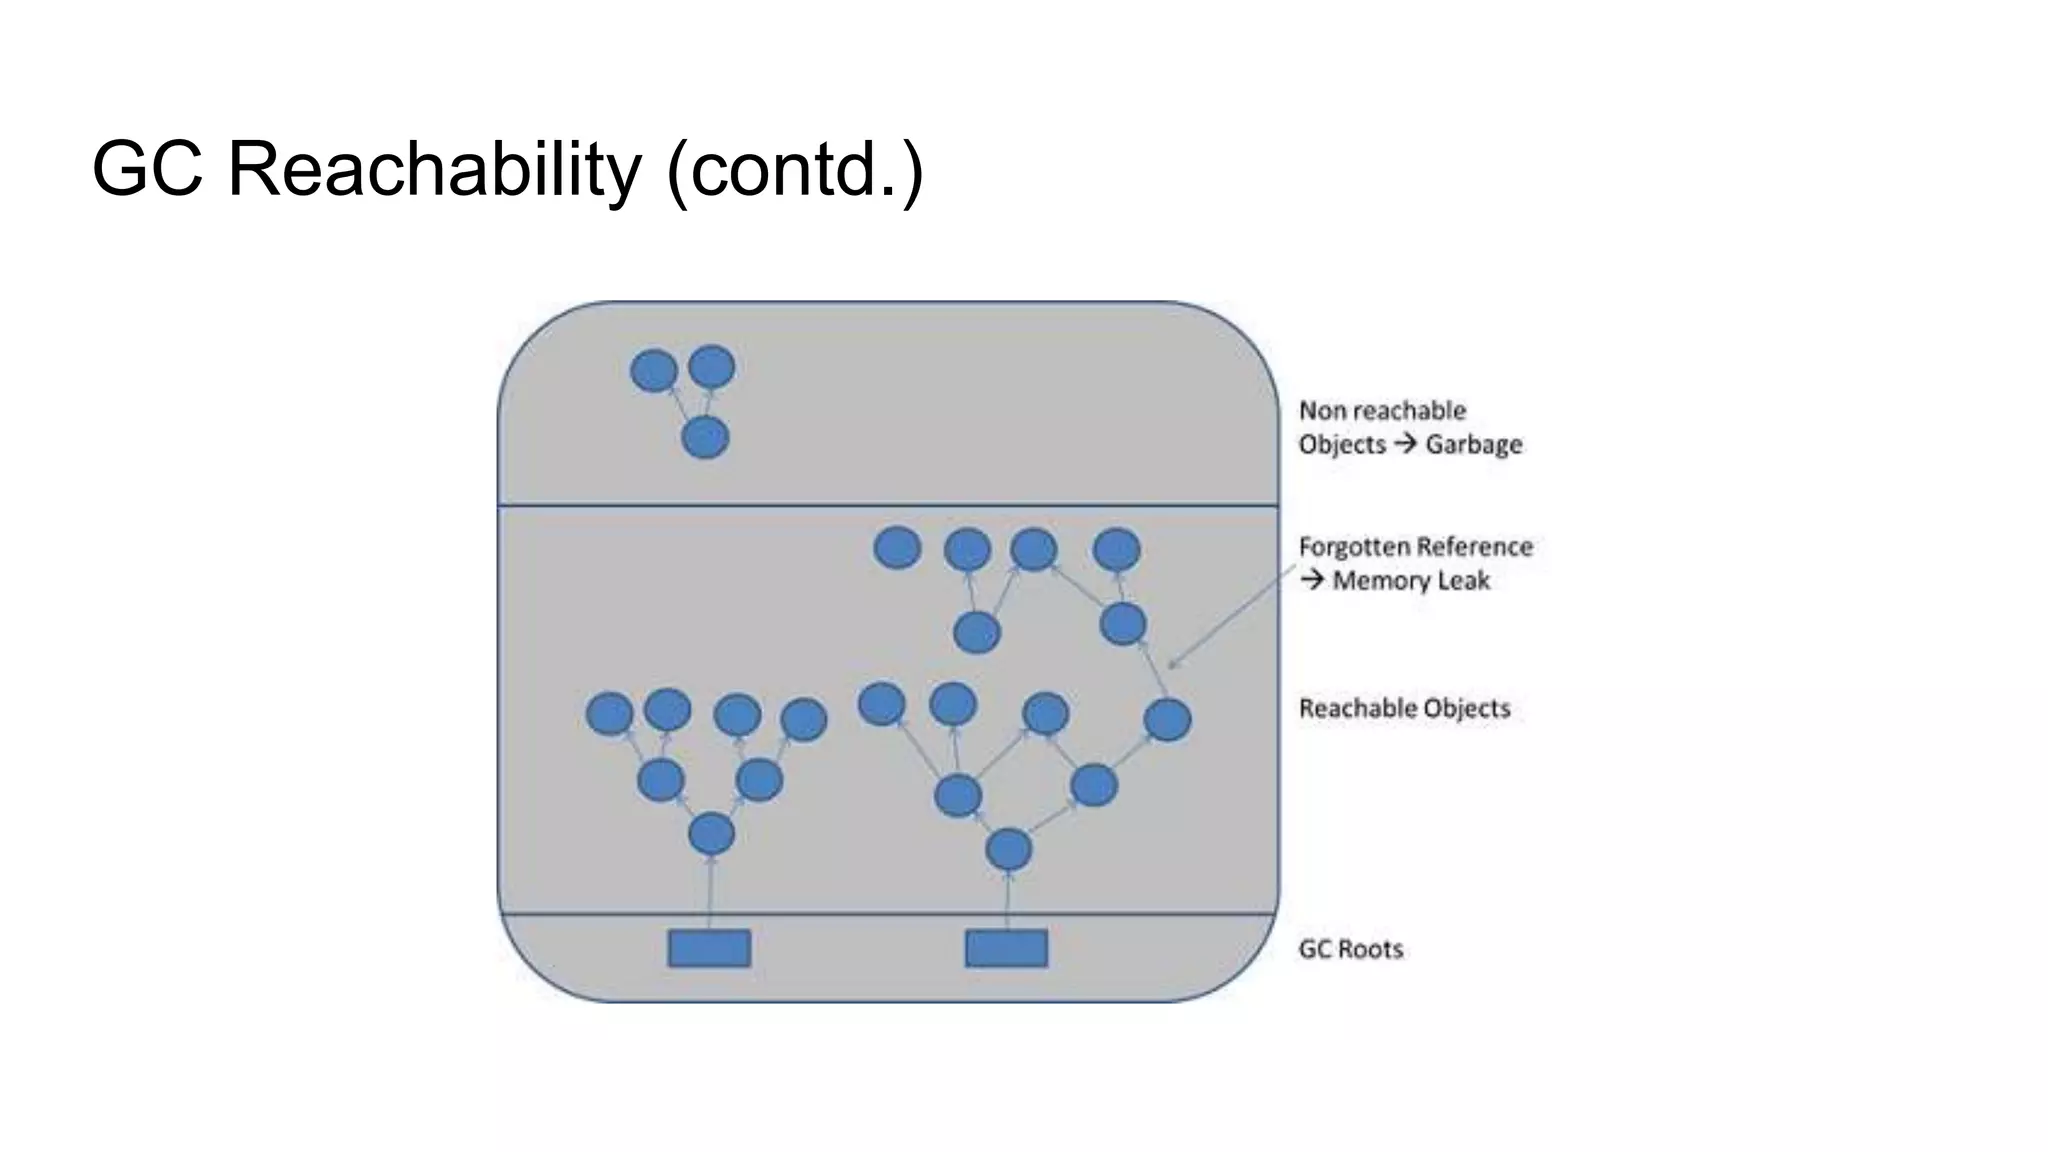

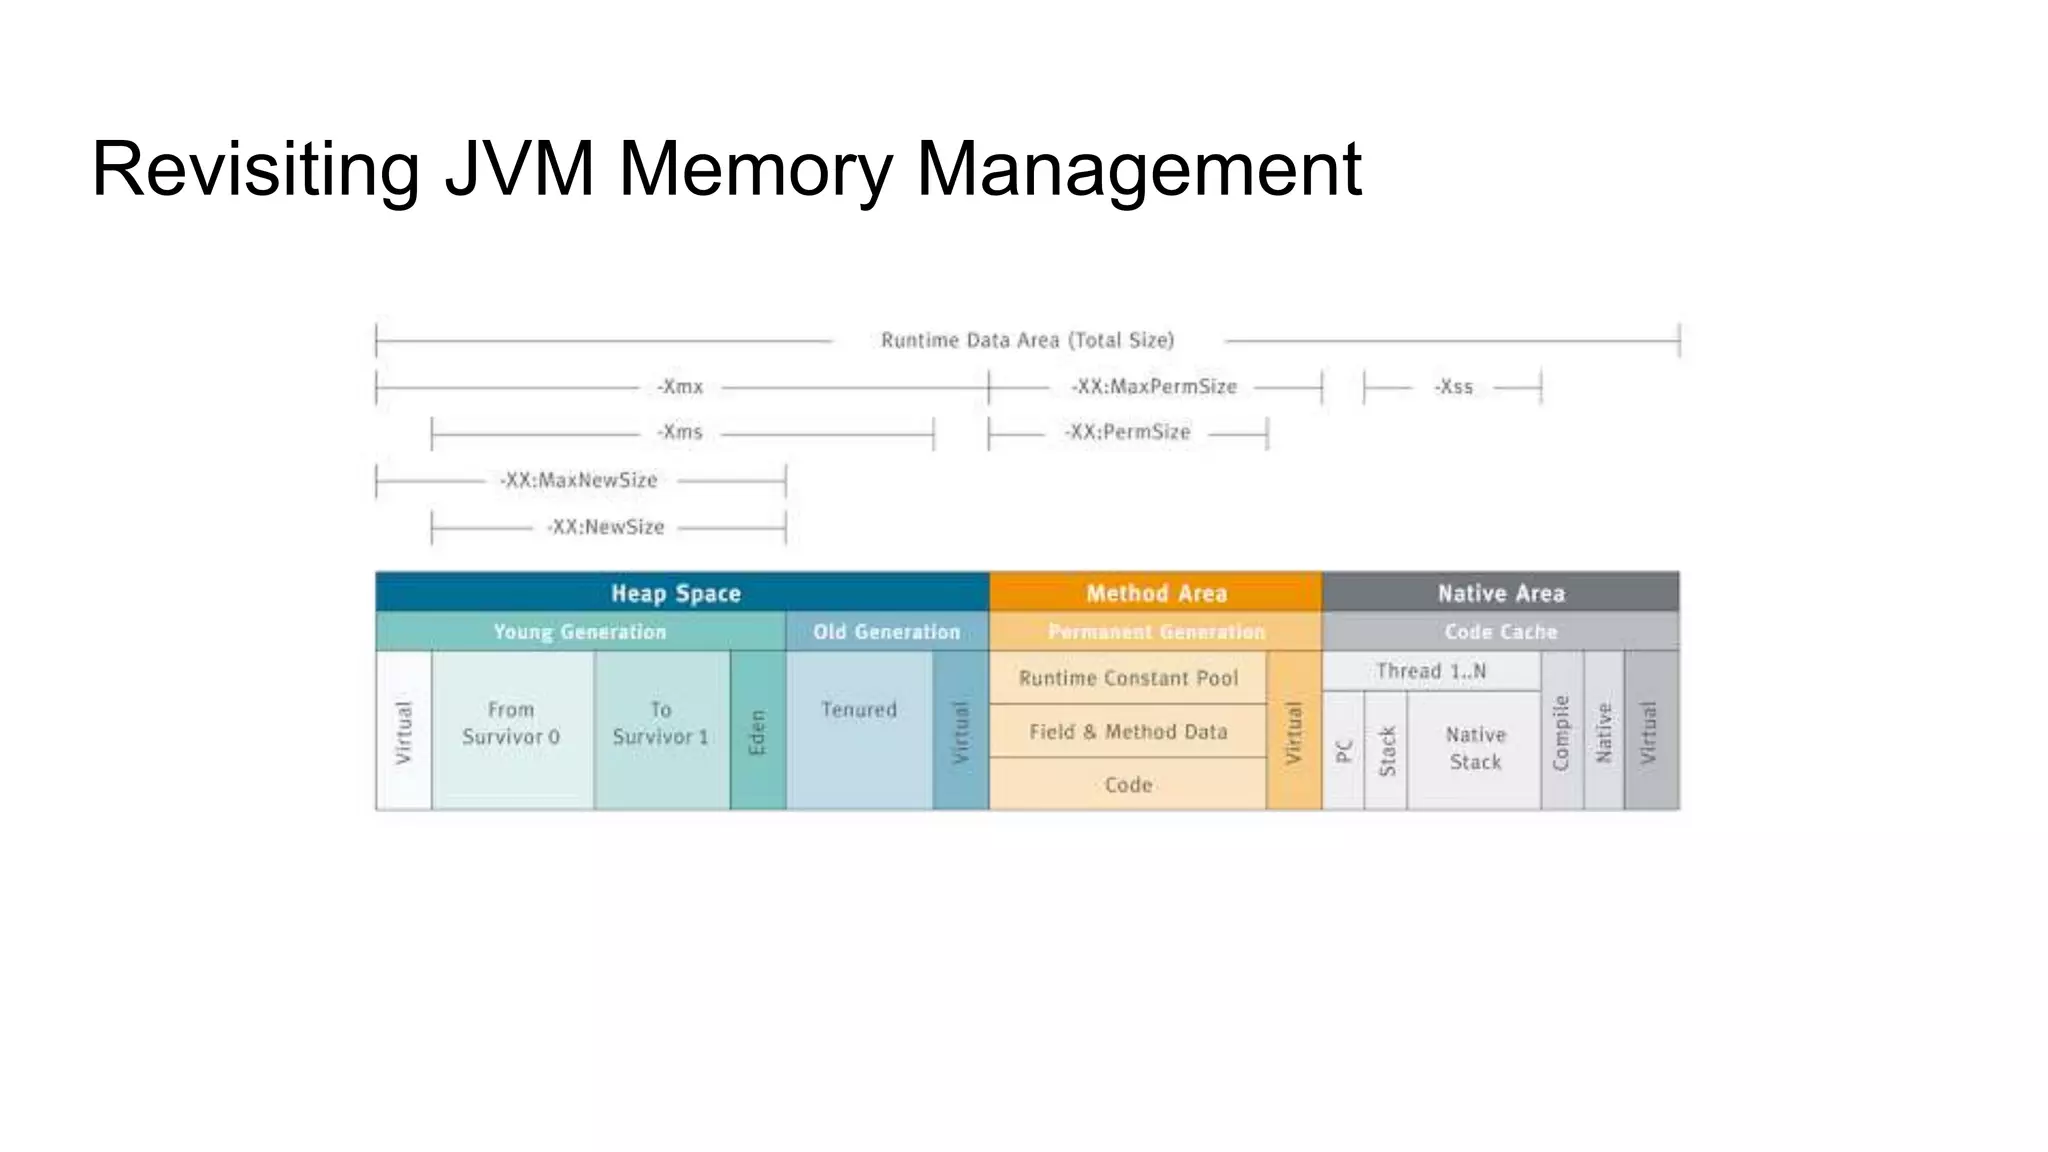


This document discusses diagnosing memory leaks in the HotSpot JVM using Java Flight Recorder (JFR) and Java Mission Control (JMC). It covers Java reference types, GC reachability, common causes of memory leaks like non-static inner classes and thread locals, and how to use JFR to record events and diagnose leaks by analyzing memory usage over time.


![[grcpp] Refactoring for testability c++](https://cdn.slidesharecdn.com/ss_thumbnails/refactoringfortestabilityc-200915192647-thumbnail.jpg?width=640&height=640&fit=bounds)