Recommended

Recommended
More Related Content
What's hot
What's hot (11)
Similar to Isme 2018
Similar to Isme 2018 (20)
Recently uploaded
Recently uploaded (20)
Isme 2018
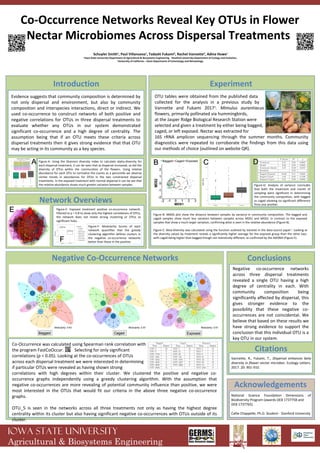
- 1. Co-Occurrence Networks Reveal Key OTUs in Flower Nectar Microbiomes Across Dispersal Treatments IOWA STATE UNIVERSITY Agricultural & Biosystems Engineering Introduction Experiment Schuyler Smith1 , Paul Villanueva1 , Tadashi Fukami2 , Rachel Vannette3 , Adina Howe1 1 Iowa State University Department of Agricultural & Biosystems Engineering, 2 Stanford University Department of Ecology and Evolution, 3 University of California – Davis Department of Entomology and Nematology Conclusions Acknowledgements Negative co-occurrence networks across three dispersal treatments revealed a single OTU having a high degree of centrality in each. With community composition being significantly affected by dispersal, this gives stronger evidence to the possibility that these negative co- occurrences are not coincidental. We believe that based on these results we have strong evidence to support the conclusion that this individual OTU is a key OTU in our system. OTU tables were obtained from the published data collected for the analysis in a previous study by Vannette and Fukami 20171 . Mimulus aurantiacus flowers, primarily pollinated via hummingbirds, at the Jasper Ridge Biological Research Station were selected and given a treatment by either being bagged, caged, or left exposed. Nectar was extracted for 16S rRNA amplicon sequencing through the summer months. Community diagnostics were repeated to corroborate the findings from this data using our methods of choice (outlined on website QR). Evidence suggests that community composition is determined by not only dispersal and environment, but also by community composition and interspecies interactions, direct or indirect. We used co-occurrence to construct networks of both positive and negative correlations for OTUs in three dispersal treatments to evaluate whether any OTUs in our system demonstrated significant co-occurrence and a high degree of centrality. The assumption being that if an OTU meets these criteria across dispersal treatments then it gives strong evidence that that OTU may be acting in its community as a key species. Figure-A: Using the Shannon diversity index to calculate alpha-diversity for each dispersal treatment, it can be seen that as dispersal increased, so did the diversity of OTUs within the communities of the flowers. Using relative abundance for each OTU to normalize the counts as a percentile we observe similar trends in abundances for OTUs in the two constrained dispersal treatments. In the exposed treatment with normal dispersal it can be see that the relative abundance shows much greater variation between samples. Figure-D: Analysis of variance concludes that both the treatment and month of sampling were significant in determining the community composition, with bagged vs caged showing no significant difference from one another. Negative Co-Occurrence Networks Co-Occurrence was calculated using Spearman rank correlation with the program FastCoOccur. Selecting for only significant correlations (p < 0.05). Looking at the co-occurrences of OTUs across each dispersal treatment we were interested in determining if particular OTUs were revealed as having shown strong correlations with high degrees within their cluster. We clustered the positive and negative co- occurrence graphs independently using a greedy clustering algorithm. With the assumption that negative co-occurrences are more revealing of potential community influence than positive, we were most interested in the OTUs that would fit our criteria in the above three negative co-occurrence graphs. OTU_5 is seen in the networks across all three treatments not only as having the highest degree centrality within its cluster but also having significant negative co-occurrences with OTUs outside of its cluster. National Science Foundation Dimensions of Biodiversity Program (awards DEB 1737758 and DEB 1737765) Callie Chappelle, Ph.D. Student - Stanford University Bagged Caged Exposed Modularity: 0.63 Modularity: 0.57 Modularity: 0.57 OTU_5 OTU_5 OTU_5 Citations Vannette, R., Fukami, T., Dispersal enhances beta diversity in flower nectar microbes. Ecology Letters. 2017. 20: 901-910. Figure-E: Exposed treatment positive co-occurrence network. Filtered to ρ = 0.8 to show only the highest correlations of OTUs, the network does not reveal strong clustering or OTUs as significant hubs. Network Overviews Figure-B: NMDS plot show the distance between samples by variance in community composition. The bagged and caged samples show much less variation between samples across MDS1 and MDS2, in contrast to the exposed samples that show a much larger variation, confirming what is seen in the relative abundance (Figure B). Figure-C: Beta-diversity was calculated using the function outlined by Vanette in the data-source paper1 . Looking at the diversity values by treatment reveals a significantly higher average for the exposed group than the other two, with caged being higher than bagged though not statistically different, as confirmed by the ADONIS (Figure E). Figure-F: Modularity Scores of each network quantifies that the greedy clustering algorithm defines clusters in the negative co-occurrence networks better than those in the positive. AA BB CC DD EE FF