population genetics of gene function (poster)
•
2 likes•457 views

Poster on "population genetics of gene function", presented a Jacobs University, Bremen, during "Ecogrids" workshop in July 2012

Recommended
More Related Content
What's hot
What's hot (16)
Viewers also liked
Similar to population genetics of gene function (poster)
Similar to population genetics of gene function (poster) (20)
Recently uploaded
Recently uploaded (20)
population genetics of gene function (poster)
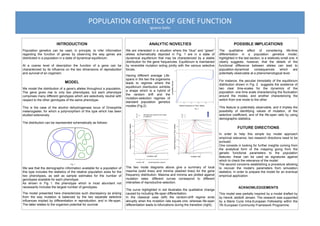
- 1. POPULATION GENETICS OF GENE FUNCTION Ignacio Gallo ANALYTIC NOVELTIES We are interested in a situation where the “blue” and “green” alleles schematically depicted in Fig. 1 are in a state of dynamical equilibrium that may be characterized by a stable distribution for the gene frequencies. Equilibrium is maintained by reversible mutation acting jointly with the various selective forces. The two mode diagrams above give a summary of local maxima (solid lines) and minima (dashed lines) for the gene frequency distribution. Maxima and minima are plotted against mutation rates: different curves correspond to different intensities of reproductive selection. The curve highlighted in red illustrates the qualitative change caused by including life-span differentiation. In the classical case (left) the random-drift regime ends abruptly when the mutation rate equals one, whereas life-span differentiation leads to bifurcations during the transition (right). POSSIBLE IMPLICATIONS The qualitative effect of considering life-time differentiation in a population genetics model, highlighted in the last section, is a relatively small one: it clearly suggests, however, that the details of the functional difference between alleles can lead to population-dynamical consequences which are potentially observable at a phenomenological level. For instance, the peculiar bimodality of the equilibrium distribution shown in Fig. 2 suggests the existence of two clear time-scales for the dynamics of the population: one time scale characterizing the fluctuation around the modes, and another characterizing the switch from one mode to the other. This feature is potentially observable, and it implies the possibility of identifying values of mutation, of the selective coefficient, and of the life-span ratio by using demographic statistics. FUTURE DIRECTIONS In order to help this simple toy model approach empirical relevance, two research directions need to be pursued. One consists in looking for further insights coming from the analytical form of the mapping going from the genetic functional parameters to the population features: these can be used as signatures against which to check the relevance of the model. The second concerns establishing a procedure allowing to recover the model’s parameters from simulation statistics, in order to prepare the model for an eventual empirical application. ACKNOWLEDGEMENTS This model was partially inspired by a model drafted by by Henrik Jeldtoft Jensen. The research was supported by a Marie Curie Intra-European Fellowship within the 7th European Community Framework Programme. INTRODUCTION Population genetics can be used, in principle, to infer information regarding the function of genes by observing the way genes are distributed in a population in a state of dynamical equilibrium. At a coarse level of description the function of a gene can be characterized by its influence on the two dimensions of reproduction and survival of an organism. MODEL We model the distribution of a gene’s alleles throughout a population. The gene gives rise to only two phenotypes, but each phenotype comprises many different genotypes which are selectively neutral with respect to the other genotypes of the same phenotype. This is the case of the alcohol dehydrogenase locus of Drosophila melanogaster, for which a polymorphism of this type which has been studied extensively. The distribution can be represented schematically as follows: We see that the demographic information available for a population of this type includes the statistics of the relative population sizes for the two phenotypes, as well as sample estimates for the number of genotypes available for each phenotype. As shown in Fig 1. the phenotype which is most abundant not necessarily includes the largest number of genotypes. The model presented here characterizes such discrepancy as arising from the way mutation is balanced by the two separate selective influences implied by differentiation in reproduction, and in life-span. The latter relates to the organism potential for survival. Fig. 1 relative frequency of “blue” alleles Fig. 2 probabilitydensity Having different average Life- spans in the two the organisms leads to regimes where the equilibrium distribution exhibits a shape which is a hybrid of the random drift and the mutation-selection regimes of standard population genetics models (Fig.2). mutation rate mutation rate relativefrequencyof“blue”alleles relativefrequencyof“blue”alleles € T1 T2 =1 € T1 T2 = 3 2 (life-spans are equal for the to types of organism) random drift mutation/selection balance