
Recommended
More Related Content
What's hot
What's hot (20)
Similar to Genotyping an invasive vine
Similar to Genotyping an invasive vine (20)
Recently uploaded
Recently uploaded (20)
Genotyping an invasive vine
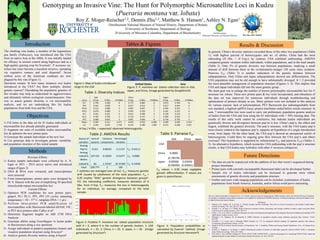
- 1. Figure 1: Map of kudzu introduced range in the USA Genotyping an Invasive Vine: The Hunt for Polymorphic Microsatellite Loci in Kudzu (Pueraria montana var. lobata) Roy Z. Moger-Reischer1,2, Dennis Zhu1,3, Matthew S. Hansen1, Ashley N. Egan1 1Smithsonian National Museum of Natural History, Department of Botany 2University of Rochester, Department of Biology 3University of Missouri-Columbia, Department of Biochemistry Acknowledgements We owe a debt of gratitude to Virginia Power, Liz Cottrell, and Gene Hunt for organizing the NHRE program, and to the National Science Foundation for funding it. Equipment and technical assistance were supplied by Smithsonian NMNH Laboratory of Analytical Biology, with special thanks owed to Matt Kweskin and Janette Madera. References 1 Webster, C.R.; Jenkins, M. A. & Jose, S. “Woody Invaders and the Challenges They Pose to Forest Ecosystems in the Eastern United States” Journal of Forestry, Vol. 104, 366-274. 2006. 2 Forseth, I. N., & Innis, A. F. (2004). Kudzu (Pueraria montana): history, physiology, and ecology combine to make a major ecosystem threat. Critical reviews in plant sciences, 23(5), 401-413. 3 Culley, T. M., et al. (2013). An efficient technique for primer development and application that integrates fluorescent labeling and multiplex PCR. Applications in plant sciences, 1(10). 4 Pritchard, J. K., Stephens, M., & Donnelly, P. (2000). Inference of population structure using multilocus genotype data. Genetics, 155(2), 945-959. 5 Excoffier, L. G. Laval, and S. Schneider (2005) Arlequin ver. 3.0: An integrated software package for population genetics data analysis. Evolutionary Bioinformatics Online 1:47-50. 6 Wright S (1978) Evolution and the Genetics of Populations. Vol. 4. Variability Within and Among Natural Populations. Univ. of Chicago Press, Chicago. 7 Evanno, G., Regnaut, S., & Goudet, J. (2005). Detecting the number of clusters of individuals using the software STRUCTURE: a simulation study. Molecular ecology, 14(8), 2611-2620. 8 Earl, Dent A. and vonHoldt, Bridgett M. (2012) STRUCTURE HARVESTER: a website and program for visualizing STRUCTURE output and implementing the Evanno method. Conservation Genetics Resources vol. 4(2), 359-361 1) Fill holes in the data set for 81 kudzu individuals at microsatellite loci already partially genotyped 2) Augment our suite of available kudzu microsatellite loci & optimize the new primer pairs 3) Genotype the sample individuals at the new loci 4) Use genotype data to investigate genetic variability and population structure of this initial sample Objectives The climbing vine kudzu, a member of the leguminous pea family (Fabaceae), was introduced into the USA from its native Asia in the 1800s. It was initially lauded for efficacy in erosion control along highways and as a high-quality grazing crop for livestock1. P. montana var. lobata has since become a truculent invasive, spreading via vegetative runners and seed dispersal2. Seven million acres of the American southeast are now plagued by this vine (Figure 1). Questions remain: In how many instances was kudzu introduced to the USA? Are there multiple, distinct genetic sources? Elucidating the population genetics of this invader may help us understand its aggressiveness and ultimately inform ecological countermeasures. One way to assess genetic diversity is via microsatellite analysis, and we are undertaking this for kudzu populations from both Asia and the USA. Introduction Methods Previous Efforts: 1) Kudzu sample individuals were collected by A. N. Egan in 2011 - 2014 across native and introduced ranges (Figure 2) 2) DNA & RNA were extracted, and transcriptomes were assessed 3) From transcriptomes, primer pairs were designed by M. S. Hansen with the aim of amplifying 30 specified trinucleotide-repeat microsatellite loci Current Efforts: 1) Optimize PCR conditions for new primer pairs: gmpc4, PL1 PL11, PP1, PP2 (35 cycles; annealing temperature = 50 – 57° C; template DNA = 1 μL) 2) Perform three-primer PCR amplification of microsatellites with fluorescent-labeled (6FAM, VIC, or PET dye) primers after Culley et al3 3) Determine fragment lengths on ABI 3730 DNA Analyzer 4) Genotype alleles using GeneMapper to locate peaks in fluorescence along a size spectrum 5) Assign individuals to putative population clusters and visualize population structure using Structure4 6) Analyze genetic diversity metrics using Arlequin5 United States Asia Figure 2: P. montana var. lobata collec?on sites in USA, Japan, and China. (Image generated by GoogleEarth) Tables & Figures Source of Sum of Variance Percentage varia?on squares components varia?on Among Pop’ns 8.221 0.06223 3.11137 FST: 0.03111 Among Individ’ls 107.555 0.19029 9.51477 FIS: 0.0982 Within Individ’ls 94 1.74747 87.37387 FIT: 0.12626 Total 209.777 2 100 USA China Japan USA China 0.0000 (0.78378) Japan 0.00000 0.03050 (0.99099) (0.00901) F sta?s?cs are averaged over all loci. FST: measures gene?c driX caused by subdivision of the total popula?on. FST < 0.05 implies “li[le” gene?c divergence between groups6. FIS: the inbreeding coefficient, measures devia?on of H Obs. from H Exp. FIT: measures the loss in heterozygosity for an individual, on average, compared to the total sample. Table 2: AMOVA Results FST values < 0.05 imply negligible gene?c differen?a?on. P values are given in parentheses. Table 3: Pairwise FST Locus USA H Exp. H Obs. # Alleles China H Exp. H Obs. # Alleles Japan H Exp. H Obs. # Alleles PL7 0.746 0.560 8 0.775 0.684 8 0.872 0.706 11 PP4 0.561 0.609 4 0.617 0.412 5 0.617 0.444 6 PP10 0.513 0.680 5 0.697 0.647 5 0.446 0.353 5 PP13 0.079 0.080 3 0.435 0.250 7 0.181 0.125 4 PL1 0.241 0.261 4 0.611 0.400 4 0.138 0.143 2 PL11 0.702 0.792 5 0.723 0.737 7 0.506 0.529 3 PP2 0.600 0.667 3 0.851 0.600 8 0.736 0.750 5 Mean 0.492 0.521 4.571 0.672 0.533 6.286 0.499 0.436 5.143 s.d. 0.245 0.255 1.718 0.135 0.180 1.604 0.272 0.248 2.911 Table 1: Diversity Indices H Exp./ H Obs. = expected/ observed heterozygosity. In general, China’s diversity statistics exceeded those of the other two populations (Table 1), with highest percent of heterozygotes and no. of alleles. China had the most inbreeding (H Obs. < H Exp.); by contrast, USA exhibited outbreeding. AMOVA compared genetic variation within individuals, within populations, and in the total sample (Table 2). Only 3% of genetic diversity was between populations, implying a small amount of drift between them in the evolutionarily-meager 150 years since isolation. Pairwise FST (Table 3) is another indication of the genetic distance between subpopulations. Only China and Japan subpopulations showed any differentiation. The USA population may not be old enough to have substantially diverged. K = 2 provided the most plausible arrangement of population structure (Figures 3, 4). This implies that USA and Japan individuals fall into the same genetic group. My main goal was to enlarge the number of known polymorphic microsatellite loci for P. montana var. lobata. Three new primer pairs & loci were incorporated, and robustness of the data set was improved for numerous individuals through troubleshooting and optimization of primers already in use. Many primers were not included in this analysis for various reasons: lack of polymorphism; PET fluorescent dye indistinguishable from size standard; a haploid cpDNA locus; project timeframe ended before results returned. In sum, 7 microsatellite loci were used to carry out preliminary population genetic analysis of kudzu from the USA and Asia using the 63 individuals with < 50% missing data. The results of this early work cannot be conclusive, but indicate kudzu individuals are genetically diverse and divergence between pop’ns is low. China’s pop’n, the oldest and largest, exhibited the greatest diversity. The pop’n structure, with the USA kudzu pop’n most closely related to the Japanese pop’n, supports an hypothesis of a single introduction event, from Japan. On the other hand, the USA pop’n showed an unexpected surfeit of heterozygosity. Could there be ongoing gene flow between the USA pop’n and others overseas? This hypothesis is supported by infinitesimal FST and pairwise FSTs (Tables 2, 3). An alternative hypothesis, which reconciles USA outbreeding with the pop’n structure results, is that USA kudzu may hybridize with other P. montana subspecies. Results & Discussion Figure 4: Popula?on probabili?es as calculated by Evanno7 method. (Image generated by Structure Harvester8) Figure 3: Puta?ve P. montana var. lobata popula?on structure with K = 2, where K is the number of gene?c clusters. 1: USA individuals, n = 25. 2: China, n = 20. 3: Japan, n = 18. (Image generated by Structure4) Future Directions u The data set can be reanalyzed with the addition of loci that weren’t sequenced during project timeframe. u Primer pairs with currently-incompatible fluorescent label can be developed further. u Sample size of kudzu individuals can be increased to generate more robust assessments of genetic diversity and population structure. u Further and more wide-ranging populations can be included; examination of kudzu populations from South America, Australia, and/or Africa could prove interesting.