Download to read offline

![International Research Journal of Engineering and Technology (IRJET) e-ISSN: 2395-0056
Volume: 06 Issue: 05 | May 2019 www.irjet.net p-ISSN: 2395-0072
© 2019, IRJET | Impact Factor value: 7.211 | ISO 9001:2008 Certified Journal | Page 6658
capillary dilatations that are typically saccular. They
seem as little red dots that area unit typically in clusters.
Here, segment the clinical image of eye and then extract
the features .Then using classification technique to identify
the occurrence of the red dots.
Comparative study of this microaneurysms detection is
mainly useful in analysis of the specific feature of the
retina .Here, we used two segmentation and two
classification techniques to evaluate accurate detection of
microaneurysms.
2.RELATED WORK
Diabetic retinopathy is affected to diabetic patients. It has
no early warning signs of the retina. The manual detection
of retinopathy useful for detect effective screening method.
In retinal blood vessels are damaged or new unwanted
blood vessels are detected, Fluorescein angiography and
optical coherence tomography useful to helping of
diagnosis and treat diabetes changes in the eye [1].
Non-proliferative diabetic retinopathy, in an initial image
processing stage isolates blood vessels, microaneurysms
and hard exudates in order to extract features that can be
used by a support vector machine to figure out the
retinopathy grade of each retinal image. Maximum
sensitivity of 95% and a predictive capacity of 94% is
obtained in [2].This work is only based on color feature.
The two methods are implemented for the detection of
exudates they are morphological method and FCM
clustering method. Contrast limited adaptive histogram
equalization (CLACHE) is used to extract the green
component in the image [4]. Overall sensitivity, specificity
and accuracy are calculated and 98%accuracy obtained.
The main problem faced in this work is the correct
localization of optic disc, in certain images with high
illumination.
PDR symptom to have poor vision and even blindness,
blood vessels eye get weak, blood and other liquid leaking
into the retina. Proliferative (PDR) is ending stage these
are also divided into two sections (Haemorrhages, hard
exudates) of retinopathy the vision will be lost. PDR
symptom to have new blood vessels grow and retina,
blood can leak into the middle part of the retina. A person
has longer diabetes the higher their risk of developing
some visual problem. Diabetic retinopathy is that
the results of injury to the tiny blood vessels and neurons
of the membrane. When diabetes causes damage to blood
vessels on the back of the eye in the retina it is called
Diabetic Retinopathy (DR) [8,10].
A person with macular edema is to have blurred vision,
making it hard to do things like reading or drive, swelling
of the central vision part of the eye [5].Image enhancement
is an important role of the image processing, adaptive
histogram and contrast stretching are use to enhance the
retinal images [6].Threshold segmentation technique and
morphological operation are used to identified the normal
and abnormal images [9].
Inverse thresholding technique is easily detecting the
exudates part of the retinal image, the region identified by
the gray scale in active contour method [5,11].Fuzzy c
means clustering algorithm detect the abnormal regions
accurately, canny edge detection and region growing to
segment the fundus (or) retinal images [7].
Circular Hough Transform method is applied in Adaptive
K-means clustering algorithm for the purpose of eliminates
the optic disc. SVM classification is supervised
classification separate the part (or) linear and nonlinear
data by kernel function, MultiSvm used to classify the
retinopathy. The Neural network is the best algorithm to
detect the abnormal blood vessels based on features, the
Probabilistic neural network used to membership
function. Feed Forward algorithm for detected the
accurate result.
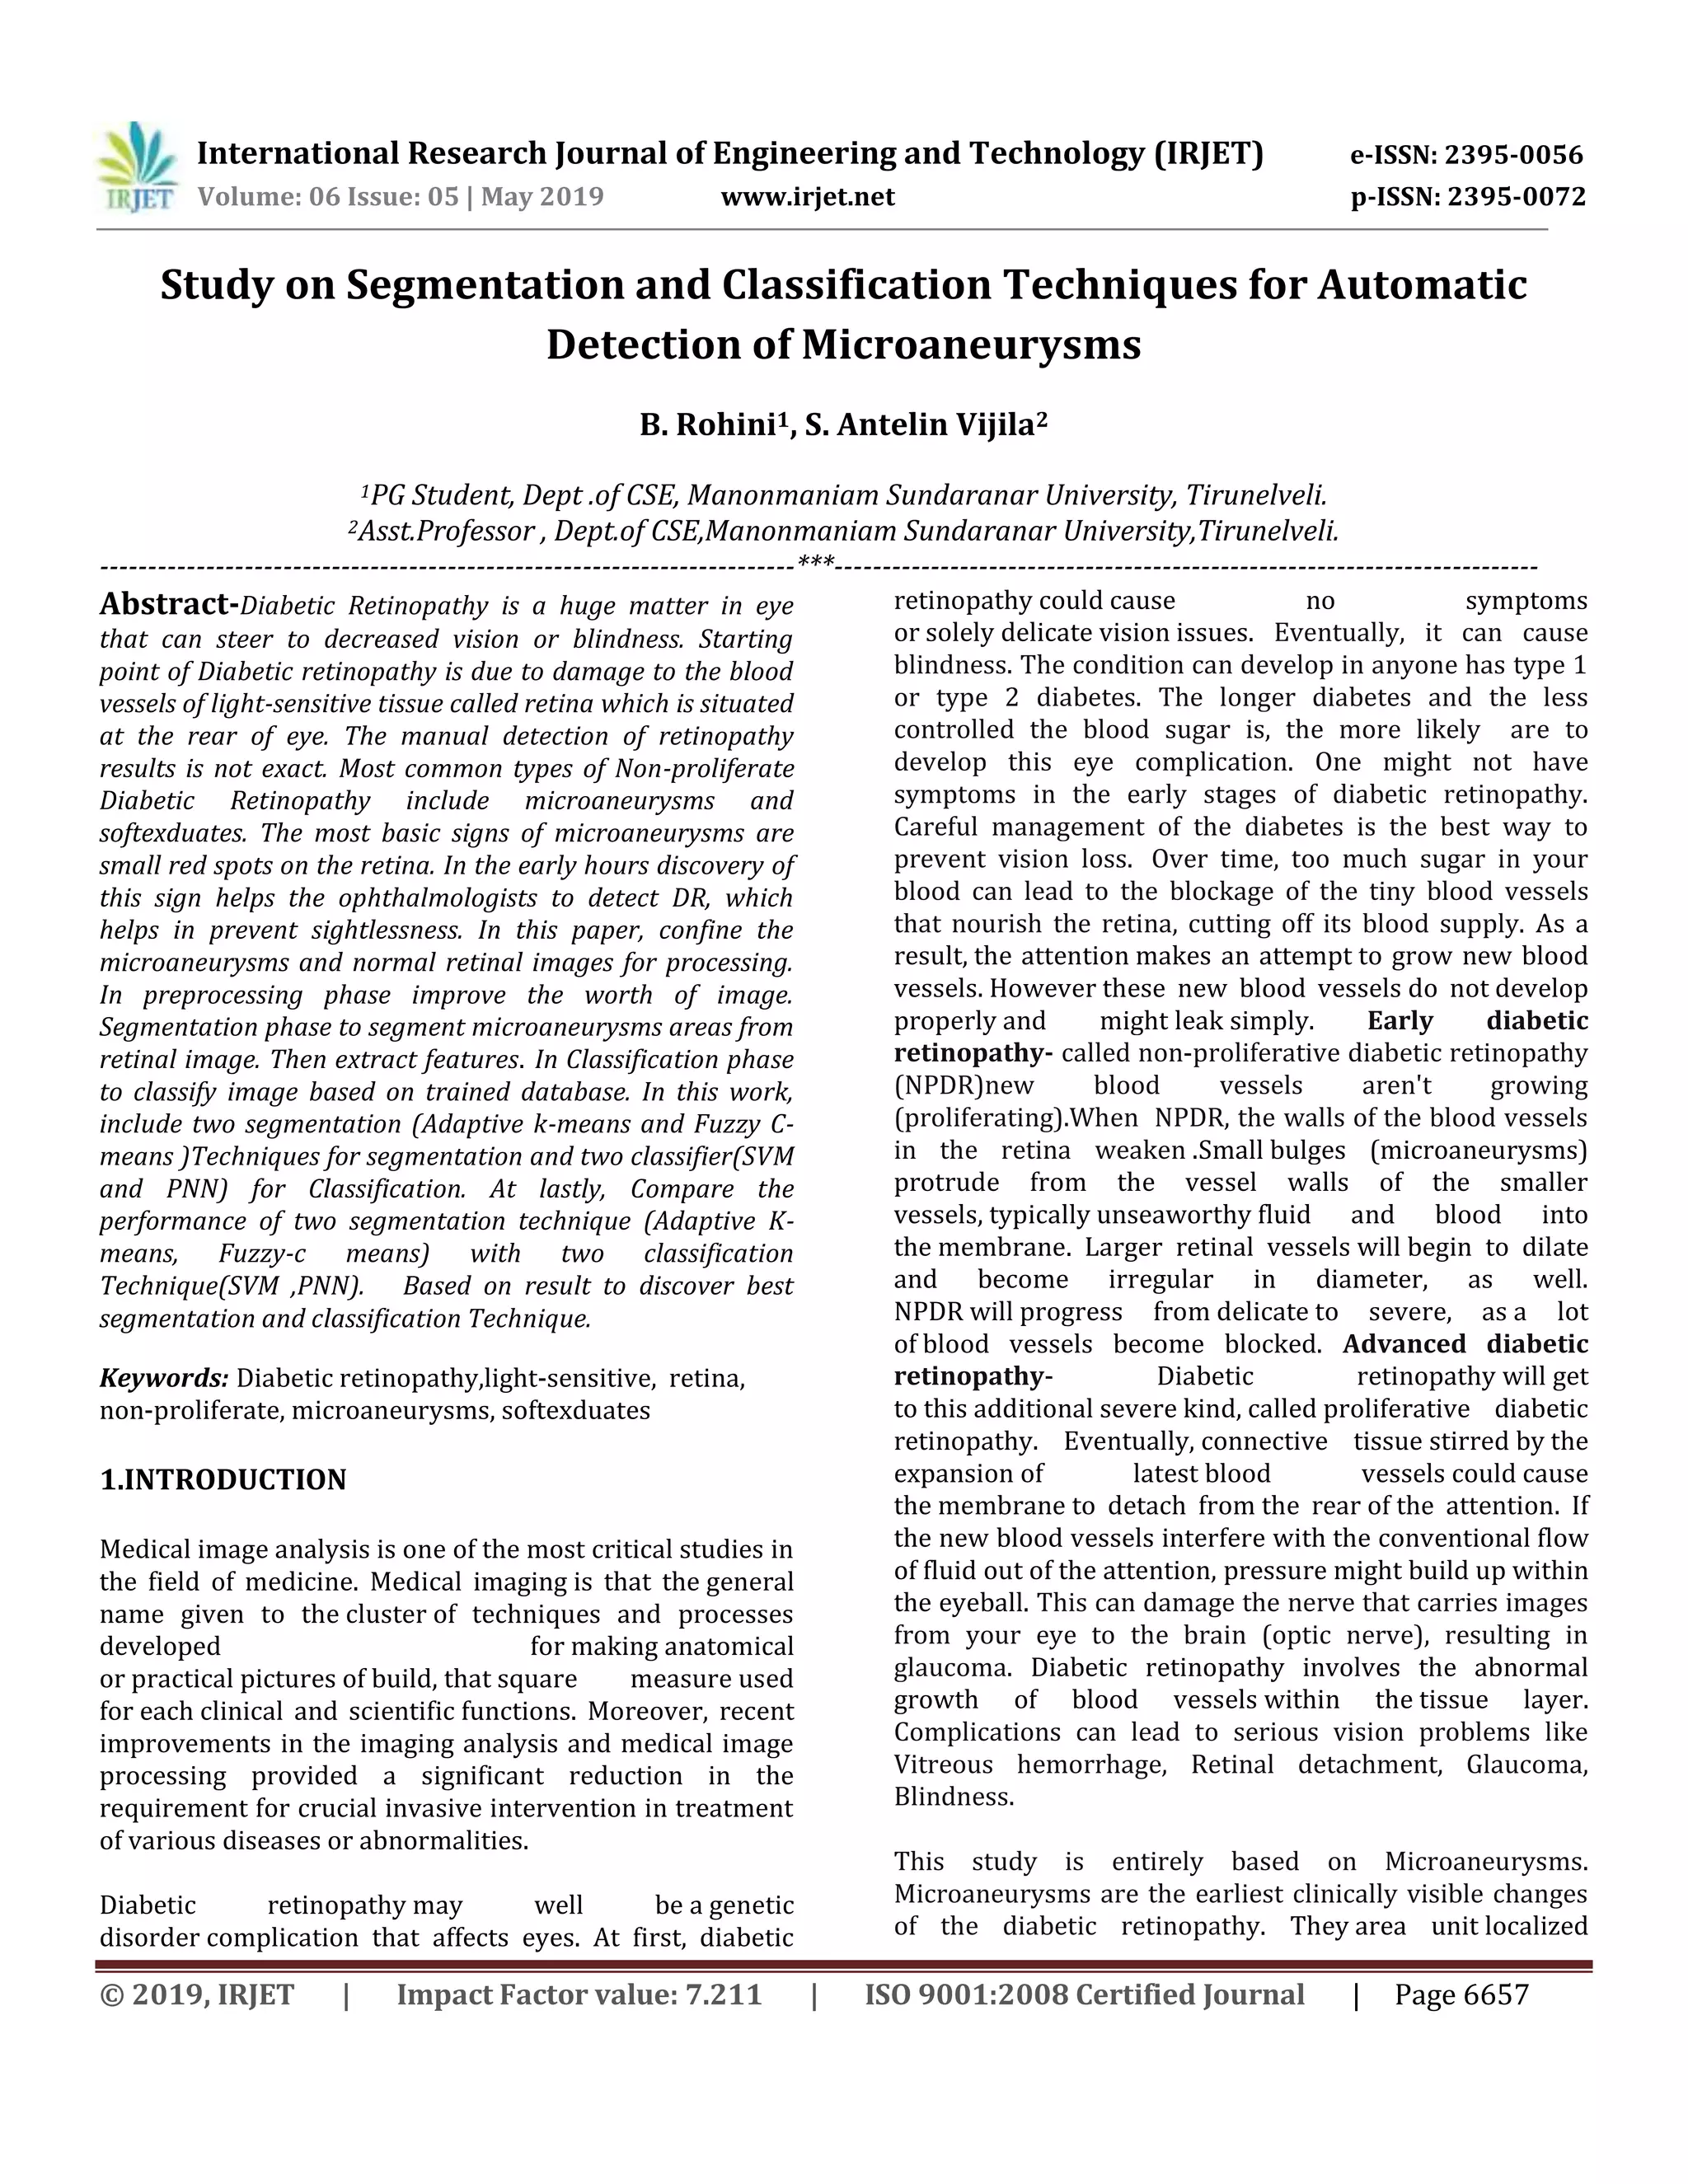
3. PROPOSED SYSTEM
Figure 1:Process flow of Diabetic Retinopathy](https://image.slidesharecdn.com/irjet-v6i5929-191014045648/85/IRJET-Study-on-Segmentation-and-Classification-Techniques-for-Automatic-Detection-of-Microaneurysms-2-320.jpg)
![International Research Journal of Engineering and Technology (IRJET) e-ISSN: 2395-0056
Volume: 06 Issue: 05 | May 2019 www.irjet.net p-ISSN: 2395-0072
© 2019, IRJET | Impact Factor value: 7.211 | ISO 9001:2008 Certified Journal | Page 6659
3.1 Image pre-processing
The Filter is used to removing unwanted things or noise
and removing reflection and masking portion of the image.
3.1.1 Median filter
The median filter is a nonlinear digital filtering technique
and also used to remove the noise (unwanted dots other
then red ). Widely used for this technique in digital image
processing. The median filter restores a pixel by the
median instead of the average of all pixels in a
neighborhood ω,
Y[m, n]=median{x( i, j ),( i ,j ) є ω} (1)
ω stand for a neighborhood defined by the user centered
around location[m, n] in the image.
3.1.2 Contrast enhancement
In Contrast enhancement phase to improve the image
quality. Adaptive histogram or contrast stretch image
function is used to enhance the image. Contrast stretching
is limited to a linear mapping of inputs to outputs values.
These two methods are best enhancement method. The
first step is to fix on the limits over which image intensity
values will be extended. These lower limit and upper limit
to be called a and b. Next, the histogram of the original
image is studied to determine the values limits (lower=c,
upper=d) in the unmodified picture. Then for each pixel,
the original value r is mapped to output values as using
the function:
S=(r-c)((b-a)/(d-c))+a (2)
3.2 Image segmentation
Image segmentation is useful in many applications as it is
divided into separate parts or sections, Adaptive K-means
and fuzzy c mean clustering techniques are used and
compare these two techniques in this paper.
Data clustering is the method that divides the data
elements into clusters such that elements in same cluster
are more similar to each other than others.. There are
basic two types of clustering .
1) Hard Clustering: Hard clustering is a simple clustering
technique that divides the image into set of clusters such
that one pixel can only belong to only one cluster.
In alternative words it will be a fore said that
every component will belong to precisely one cluster.
2)Soft clustering: The soft clump or clustering is a lot
of natural style of clustering as a result
of in reality actual division isn't doable thanks to the
presence of noise. Therefore soft clump techniques square
measure most helpful for image segmentation within
which division isn't strict.
3.2.1Adaptive k-means clustering
The Adaptive K-means is the simple algorithm of
segmenting images into k, Different clusters based on
feature, attribute or intensity value. Adaptive K-means is
computationally efficient and does not require the
specification of many parameters as compared to another
method of segmentation. Unlike local thresholding, this
can only group into two main classes while K-mean
Algorithm can group into k different classes. K-means
cluster classification is done by minimizing the sum of the
squares of distances between data and the similar to
clustering centroid. Circular Hough Transform method is
applied in K-means clustering algorithm and to detect the
optic disk. It is divided into three clusters Sqeuclidean
distance, replicates, and distance. Euclidean metric is that
the line distance between 2 points in metric space.
Squared Euclidean Distance is not a metric as it does not
satisfy the triangle inequality, it is frequently used in
optimization problems in which distances only have to be
compared.
( ) (∑ ( ) ) (3)
Sqeuclidean is faster than clustering with regular
Euclidean distance.
Algorithm for Adaptive K-means Segmentation
Step 1: Input and number of clusters
Step 2: Calculate groups (clusters) centroids based on
initial guess value
Step 3: Distance of each pixel from Class centroids are
Calculate
Step 4: The Group pixels into k clusters based on minimal
distance from centroids
Step 5: Calculate the new centroids for each cluster
Step 6: Classify into groups based on new centroids,
distance
Step 7: if any of centroids appears changes its position and
Test it.
Step 8: If there are changes repeat step 3 and 8, else step 9
Step 9: end](https://image.slidesharecdn.com/irjet-v6i5929-191014045648/85/IRJET-Study-on-Segmentation-and-Classification-Techniques-for-Automatic-Detection-of-Microaneurysms-3-320.jpg)
![International Research Journal of Engineering and Technology (IRJET) e-ISSN: 2395-0056
Volume: 06 Issue: 05 | May 2019 www.irjet.net p-ISSN: 2395-0072
© 2019, IRJET | Impact Factor value: 7.211 | ISO 9001:2008 Certified Journal | Page 6663
prediction. The best result of this project is a combination
of Adaptive k-means and fuzzy c-means clustering with
SVM classifier. Accuracy to be increased based on
enhancement technique. In Future, will select emerging
technique to detect microaneurysms in efficient manner.
REFERENCES
[1] Bresnick, H.George, Et Al. "A Screening Approach To
The Surveillance Of Patients With Diabetes For The
Presence Of Vision-Threatening Retinopathy."
Ophthalmology 107.1 (2016): 19-24.
[2] Enrique V. Carrera, Andr´Es Gonz´Alez, Ricardo
Carrera” Automated Detection Of Diabetic Retinopathy
Using SVM” ,Vol 978,5090-6363-, 2017
[3] Harangi, I. Lazar, A. Hajdu. "Automatic Exudate
Detection Using Active Contour Model And Regions Wise
Classification." Engineering In Medicine And Biology
Society (EMBC), 2012 Annual International Conference Of
The IEEE. IEEE, 2016.
[4] Hosanna Princye, Vijayakumari “Detection Of
Exudates And Feature Extraction Of RetinalImages Using
Fuzzy Clustering Method”,IET ,2016
[5] Hsu, Wynne, Et Al. "The Role Of Domain Knowledge In
The Detection Of Retinal Hard Exudates." Computer Vision
And Pattern Recognition, 2001. CVPR 2001. Proceedings Of
The 2001 IEEE Computer Society Conference On. Vol. 2.
IEEE, 2011.
[6] Narasimha-Iyer, Harihar, Et Al. "Robust Detection And
Classification Of Longitudinal Changes In Color Retinal
Fundus Images For Monitoring Diabetic Retinopathy."
IEEE Transaction On Biomedical Engineering 53.6 (2016):
1084-1098.
[7] Osareh, Alireza, Et Al. "Automatic Recognition Of
Exudative Maculopathy Using Fuzzy C-Means Clustering
And Neural Networks." Proc. Medical Image
Understanding Analysis Conf. Vol. 3. 2011.
[8] Patton, Niall, Et Al. "Retinal Image Analysis: Concepts,
Applications And Potential." Progress In Retinal And Eye
Research 25.1 (2016): 99-127
[9] Sopharak, Akara, Et Al. "Automatic Detection Of
Diabetic Retinopathy Exudates From Non-Dilated Retinal
Images Using Mathematical Morphology Methods."
Computerized Medical Imaging And Graphics 32.8 (2014):
720-727.
[10] Walter, Thomas, Et Al. "A Contribution Of Image
Processing To The Diagnosis Of Diabetic Retinopathy
Detection Of Exudates In Color Fundus Images Of The
Human Retina." IEEE Transactions On Medical Imaging
21.10 (2015): 1236-1243.
[11] Yazid, Haniza, Hamzah Arof, And Hazlita Mohd Isa.
"Automated Identification Of Exudates And Optic Disc
Based On Inverse Surface Thresholding." Journal Of
Medical Systems 36.3 (2015)](https://image.slidesharecdn.com/irjet-v6i5929-191014045648/85/IRJET-Study-on-Segmentation-and-Classification-Techniques-for-Automatic-Detection-of-Microaneurysms-7-320.jpg)

This document discusses techniques for the automatic detection of microaneurysms, which are small red spots that are early signs of diabetic retinopathy. It proposes using image segmentation and classification methods on retinal images to identify microaneurysms. Specifically, it compares the performance of adaptive k-means clustering and fuzzy c-means segmentation, as well as support vector machine (SVM) and probabilistic neural network (PNN) classification. The document provides background on diabetic retinopathy and microaneurysms. It also reviews related work on segmentation and classification methods for detecting lesions in retinal images.