Download to read offline
![International Research Journal of Engineering and Technology (IRJET) e-ISSN: 2395-0056
Volume: 06 Issue: 10 | Oct 2019 www.irjet.net p-ISSN: 2395-0072
© 2019, IRJET | Impact Factor value: 7.34 | ISO 9001:2008 Certified Journal | Page 666
Comparative Study of Radial and Ring Type Distribution System
Kavya G1, Dr Ashoka H N2
1PG Student, EEE Dept., UBDT College of Engineering Davangere, Karnataka, India.
2Associate Professor, EEE Dept., UBDT College of Engineering, Davangere, Karnataka, India.
---------------------------------------------------------------------***----------------------------------------------------------------------
Abstract - This paper presents a comparativestudyofradial
and ring type electrical power distribution system. Power
distribution systems play a significant role, since it is the
main link between the power substation andtheconsumers.
Presently power distribution system is done by the radial
type system and it has only one path for power flow from
distribution substation and to the particular load. The
another type of power distribution is ring system and it has
one or more paths between the distribution substation and
the load. This increases the reliability over the radial
distribution system by the quality supply. A five bus
distribution system is considered to compare the two
different type of systems. The module of distributionsystem
is implemented using the MATLAB/SIMULINK R2018a. The
experimental results reveal that the ring type distribution
system is more reliable compare to that of the radial
distribution system.
Key Words: Radial distribution system, Ring type
distribution system, reliability, quality supply
1. INTRODUCTION:
Power distribution systems play a significant role, since it is
the main link between distribution substations and the
consumers. This system is divided into radial, ring and
interconnected system on the scheme of operation. The
radial distribution systems (RDS) are commonly used in
power distribution. It has only onepowerflowpathbetween
distribution substation and to a particular load. A failure at
any point on the radial distribution system cause
interruption to most of the loads to ensure continuity of
supply, an alternative path for power supply should be
provided. This is made possible by converting the radial
distribution system into ring type distribution system. It
improves the power system conditions in the best possible
way by opening and closing the available switches provided
at the tie lines. The supply sources toloadsconnectedtoload
buses are adapted to reduce voltge drop VD, get better bus
voltage profile, and this increases in quality supply of the
system.
In recent years, there has been a significant growth in the
reconfiguration of radial distribution system that is A. K.
Saonerkar et al., [1], discussed optimized distribution loss
evaluation in ring main distribution system withDistributed
Generation (DG) placement, reconfiguration and capacitor
placement using Genetic Algorithm (GA). Compare results
obtained with Radial Distribution System (RDS) and Ring
Main Distribution System (RMDS) and proves that loss can
be minimized just by modifying the type of distribution
network from RDS to RMDS and can further be reduced to
high level by DG and capacitor placements at strategic
locations. R. Srinivasa Rao et al., [2], proposed a newmethod
to solve the network reconfiguration problem in the
presence of distributed generation (DG) with an objective of
minimizing real power loss and improving voltage profile in
distribution system. A meta heuristic Harmony Search
Algorithm (HSA) is used to simultaneously reconfigure and
identify the optimal allocations for installation ofDGunits in
a distribution network. Mohammad Ali Hormozi et al., [3-4],
discussed a very detailed study on a method for solving
optimal distribution network reconfiguration and optimal
placement distributed generation (DG) with the objective of
reducing power losses and improving voltage profile with
the least amount of time using a combination of various
techniques is offered. In the proposed method, first, a meta-
heuristic algorithm (MHA) is used to solve the problem of
optimal DG placement and a binary particular swarm
optimization algorithm (BPSO) is used for solving the
network reconfiguration. Pyone Lai Swe [5], proposed novel
approach for placement of Distributed Generation (DG)
units in reconfigured distribution system with the aim of
reduction of real power losses while satisfying operating
constraints. J.Z.Zhu [6], proposed an improved method to
study distribution network reconfiguration(DNRC)based on
refined genetic algorithm. A radiation distribution network
load flow (RDNLF) method used in order to get the precise
branch current and system power loss so that premature
convergence is avoided. Jizhong Zhu et al., [7], discussed a
very detailed study on “A comprehensive method for
reconfiguration of electrical distributionnetwork”.Themain
objective of this paper is to minimize the losses by using
modified heuristic solution methodology will be applied on
two different distribution network system. M. Saradarzadeh
et al., [8], discussed a very detailed study on the benefits of
looping the conventional radial distribution system by a
series power electronic system to control power flow has
been investigated. The conventional radial electrical
distribution system will change to loop or even meshed
system due to the deregulation of electrical system and
connection of Distributed Generation. Tehran electrical
distribution network is used as case study to investigate the
advantages of looped power flow controller versus
conventional radial distribution system. Javad Lavaei and
Steven H. Low [9], were proposed a linear-matrix-inequality
(LMI) optimization problem to find the “Relationship
Between Power Loss and Network Topology in Power
Systems”. This gives optimal network reconfiguration and
optimal placement/sizing of distributed generation units in
distribution networks. S.K. Salman and S.F. Tan [10], were
discussed a very detailed study on “Comparative Study of](https://image.slidesharecdn.com/irjet-v6i10118-191227085008/75/IRJET-Comparative-Study-of-Radial-and-Ring-Type-Distribution-System-1-2048.jpg)
![International Research Journal of Engineering and Technology (IRJET) e-ISSN: 2395-0056
Volume: 06 Issue: 10 | Oct 2019 www.irjet.net p-ISSN: 2395-0072
© 2019, IRJET | Impact Factor value: 7.34 | ISO 9001:2008 Certified Journal | Page 667
Protection Requirements of Active Distribution Networks
Using Radial and Ring Operations”. This the impact of
distributed generation on the setting of protectivedevicesof
distribution networks that originally operated in radial
mode and then switched to ring mode and to compare the
protection requirements for the two modes of operations.
Aman et al., [11], discussed a very detailed overview of
optimum shunt capacitor bank (SCB) placement techniques.
Six different approaches of optimum SCB placement based
on minimization of power losses, weakest voltage bus
approach and maximization of system loadability will be
applied on four different radial distribution test systems.
Prakash and Sydulu [8] implemented the particle swarm
optimization to determine the optimal allocation of
capacitor. In this method a meta heuristic parallel search
technique for estimation ofrequiredlevel ofshuntcapacitive
compensation to improve the voltage profile of the system
and reduce active power loss(12)Kannana et al., [13].
Proposed optimal sizing of capacitor using Differential
Evolution (DE) and MultiAgentParticleSwarm Optimization
(MAPSO), whereas optimal location by using fuzzy expert
system. Abul’Wafa et al.,[14] proposed a combined fuzzy
expert system for capacitor location and real coded GA for
capacitor sizing. Amir Alipour et al., [15], discussed a “Study
in the Impact of Distributed Generator (DG) Placement and
Sizing on a Ring Distribution Network”. Here Analysis of
variance (ANOVA) was used to speed up the data gathering
and statistical treatment of the study. This gives the
penetration of DGs in a system affects the fault currents
regardless where the fault occurs.Although,thefaultcurrent
contribution of the DGs depends greatlyonwherethe faultis
located
In view of this, reconfiguration of the radial distribution
system[2-5] is done by using various methods like Genetic
Algorithm (GA), meta heuristic Harmony Search Algorithm
(HSA) and binary particular swarm optimization algorithm
(BPSO) by maintain the radial nature of the system. The
main drawback of the these methods are radial distribution
system are feed at only one point, so fault close to feeding
end cause interruption to most of the loads. Hence radial
distribution system converting them to ring main
distribution system to shrink voltage drop , get better bus
voltage profile and increase the reliability of the system like
that various phenomenal advantage which will be
highlighted through results in this paper.
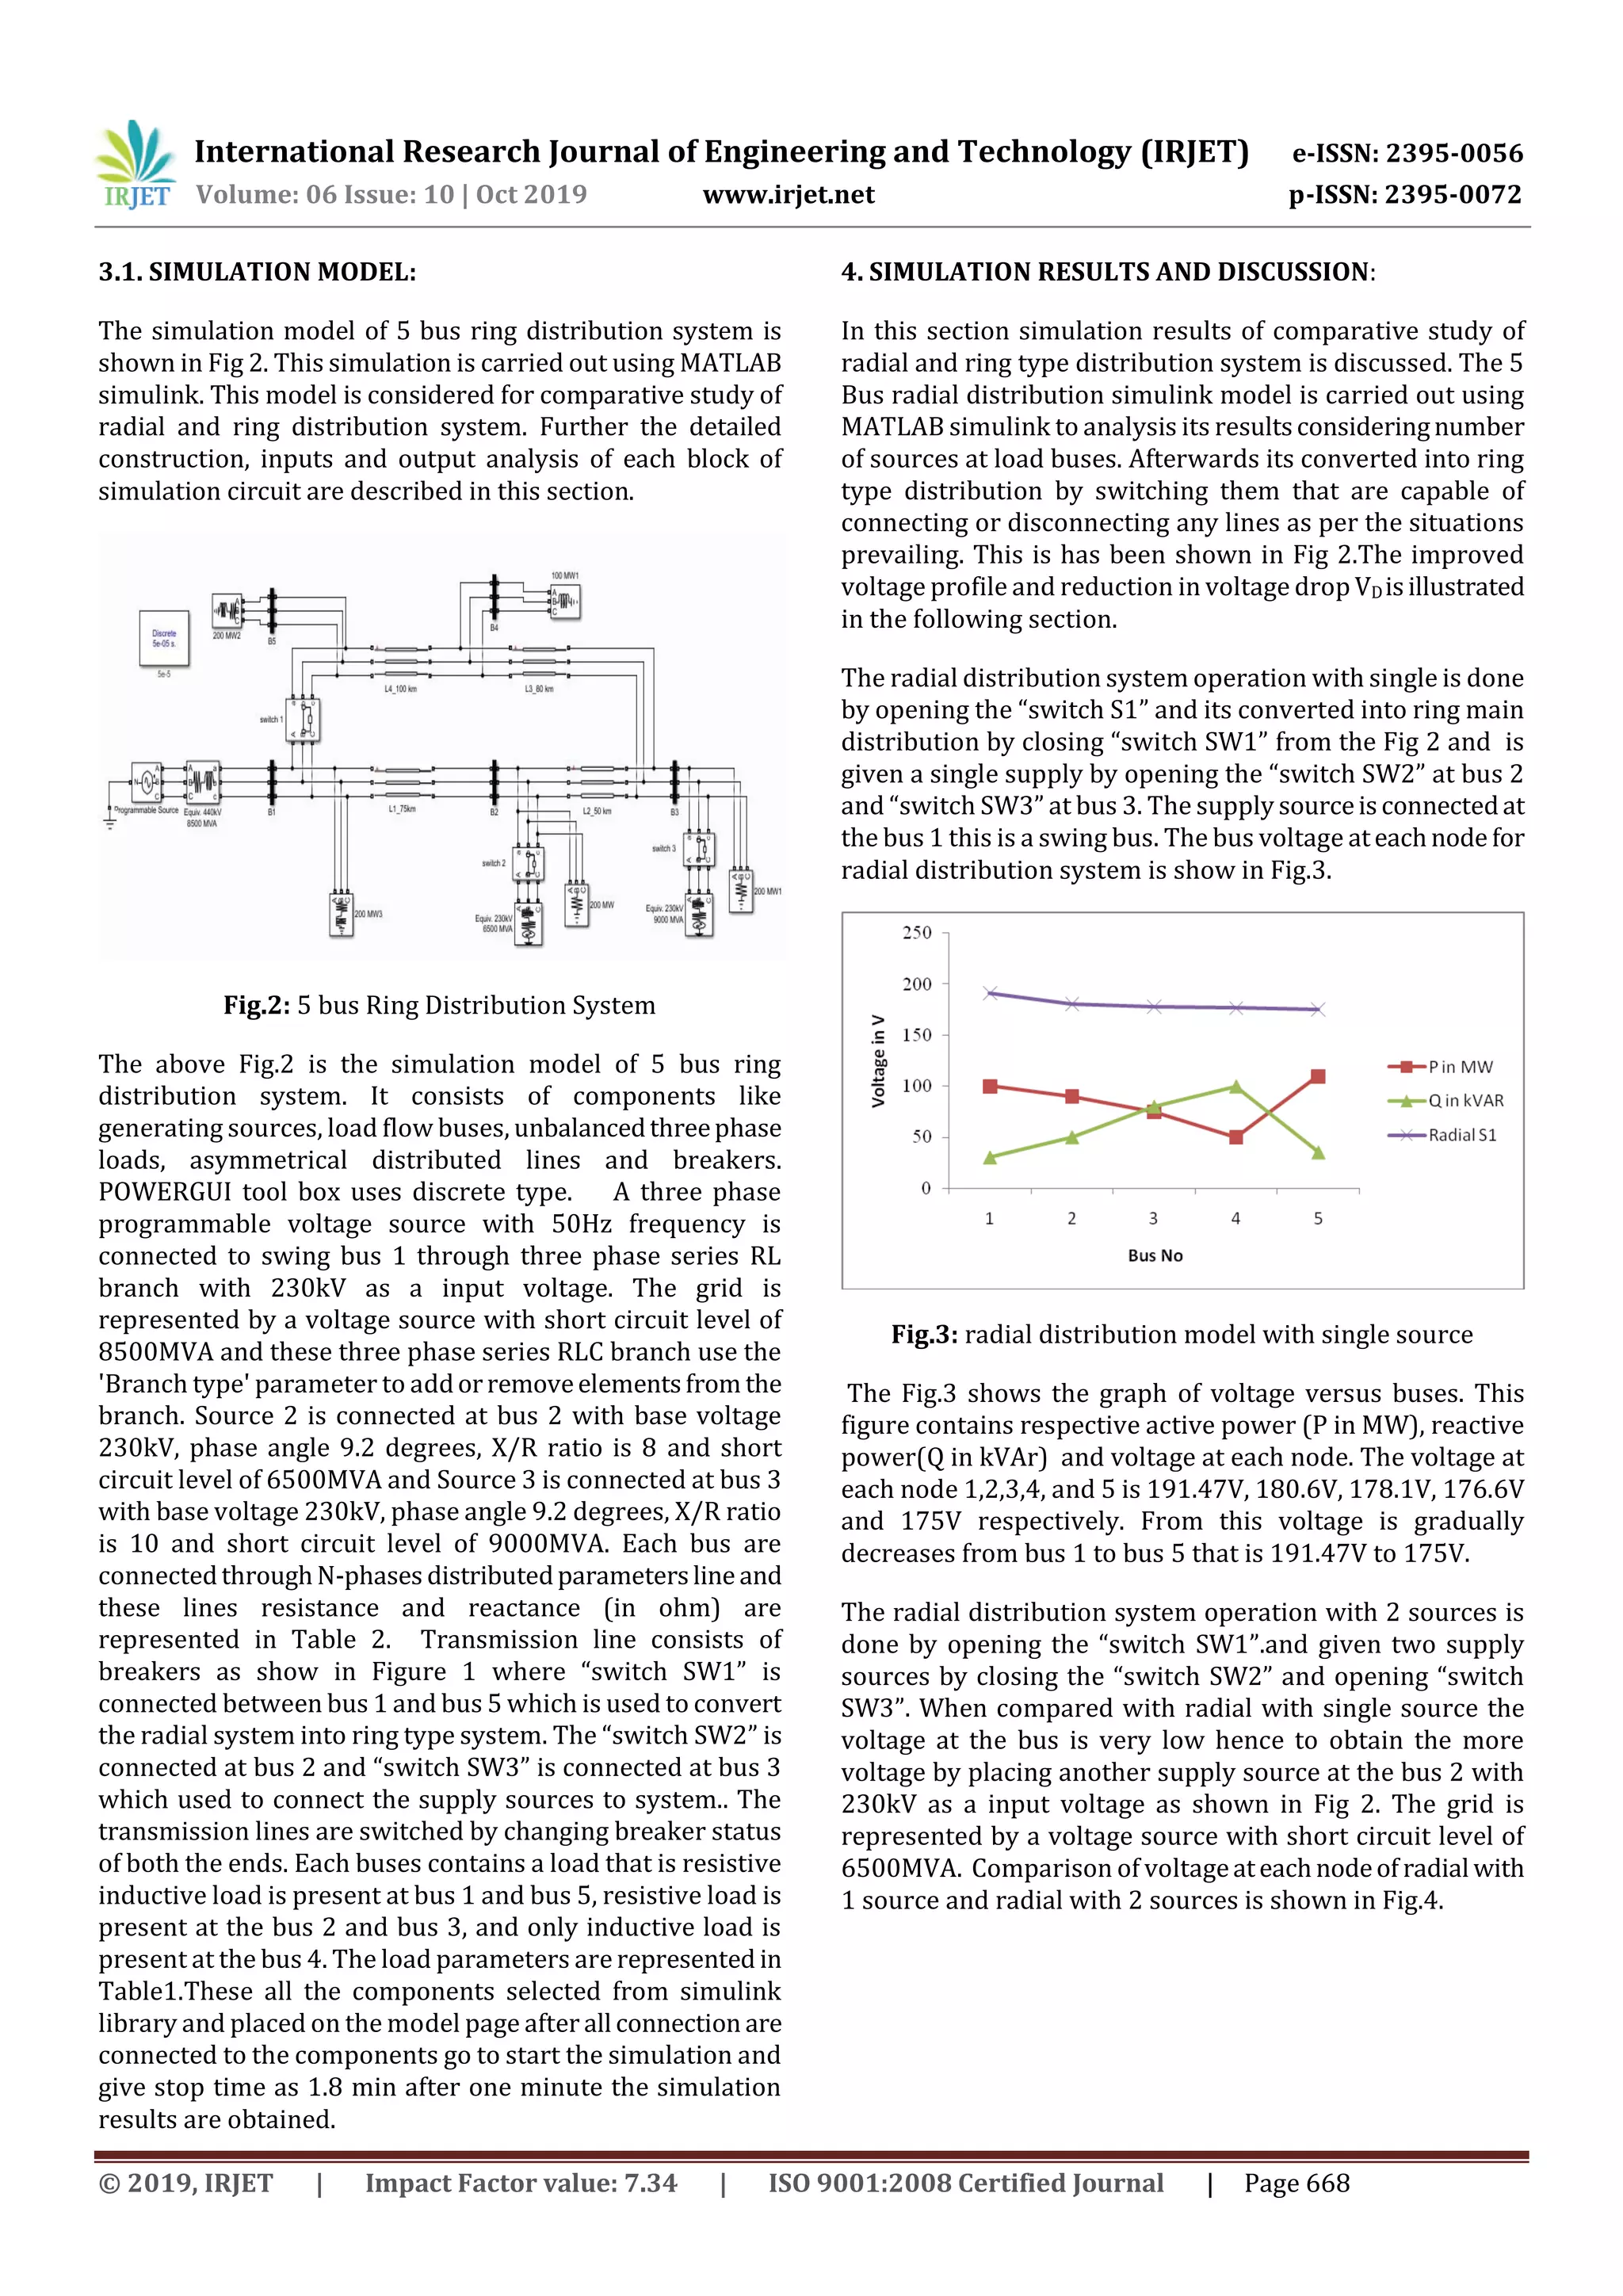
3. FIVE BUS RING DISTRIBUTION SYSTEM
The distribution system is represented by single line
diagram. The basic single line diagram of a 5 Bus ring type
distribution system is shown in Figure 1. Ithasbeenusedfor
implementation for converting radial type into ring type
distribution system to get better voltage profile at all the
load buses by adding different number of sources. The
network lines are provided with breakersbyswitchingthem
that are capable of connecting or disconnecting any lines as
per the situations prevailing.
Fig.1: Single line diagram of 5 Bus ring distribution system
The Fig.1 consists of 5 Bus distribution system in which
three supply sources are given at bus 1, 2 and3. Thesebuses
are connected each other by transmission line L1, L2, L3, L4
and L5 and there parameters are represented in Table 2.
Each buses consist of load and load parameters are
represented in Table 1.This simulink model is developed by
using electrical components from the MATLAB SIMSCAPE
power system.
Table 1: Load Parameters of 5 Bus ring distribution
systems
BUS No
LOAD
P in MW Q in MVAR
1 100 10
2 100 0
3 100 0
4 0 100
5 100 10
The above Table 1 gives details of load parameters of 5 Bus
ring distribution system. Here each buses contains a load
that is resistive inductive load is present at bus 1 and bus 5,
resistive load is present at the bus 2 and bus 3, and only
inductive load is present at the bus 4.
Table 2: Transmission line parameters for 5 Bus Ring
Distribution System
Fro
m
nod
e
To
node
Distanc
e in km
Resistanc
e in ohm
Inductive
reactanc
e in ohm
Capacitive
reactance
in ohm
1 2 0.75 0.95475 21.9997 3331.34
2 3 0.50 0.6365 14.665 4997.02
3 4 0.80 1.0184 23.4664 3123.13
4 1 1 1.273 29.3331 2498.5
The above Table 2 gives details of the transmission line
parameters for 5 bus ring distribution systemwhereline 1is
connected between bus 1 and bus 2 with line length 0.75km,
line 2 is connected between bus 2 and bus 3 with line length
0.50km, line 3 is connected between bus 3 and bus 4 with
line length 0.80km and line 4 is connected between bus 4
and bus 1 with line length 1 km. This table also contains
resistance, inductive reactance and capacitive reactance in
ohm.](https://image.slidesharecdn.com/irjet-v6i10118-191227085008/75/IRJET-Comparative-Study-of-Radial-and-Ring-Type-Distribution-System-2-2048.jpg)
![International Research Journal of Engineering and Technology (IRJET) e-ISSN: 2395-0056
Volume: 06 Issue: 10 | Oct 2019 www.irjet.net p-ISSN: 2395-0072
© 2019, IRJET | Impact Factor value: 7.34 | ISO 9001:2008 Certified Journal | Page 670
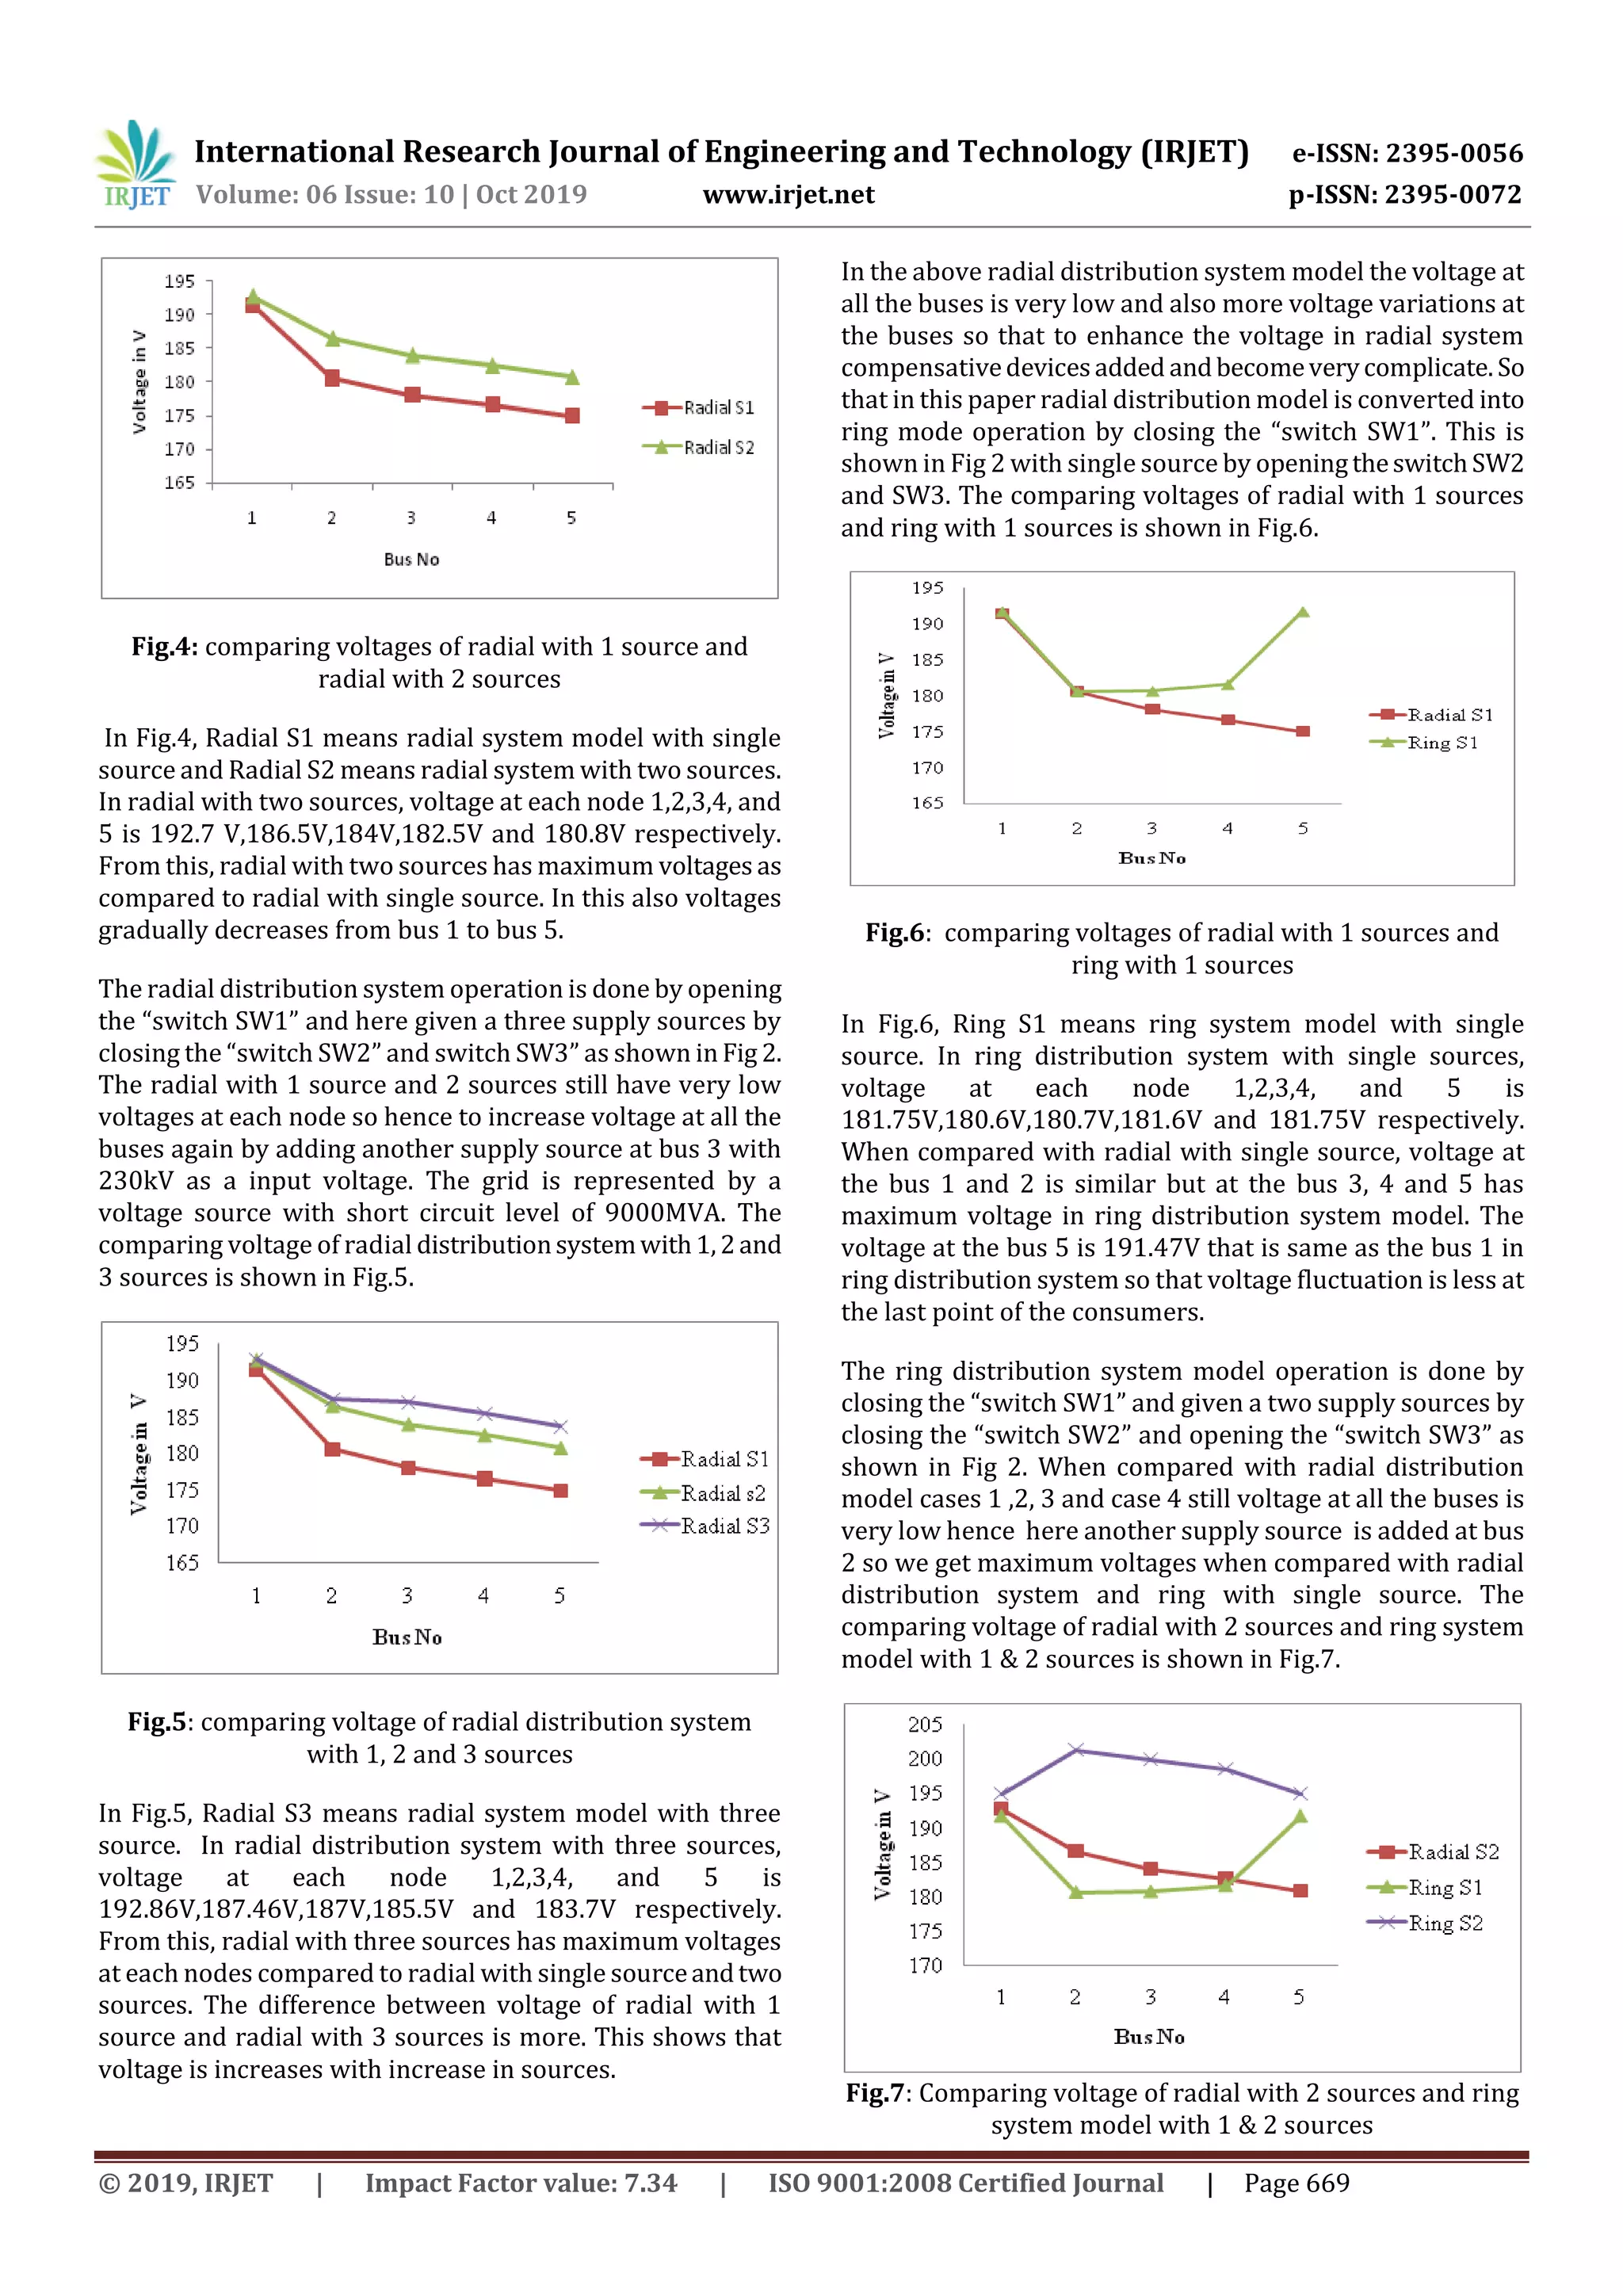
In Fig.7, Ring S2 means ring system model withtwosources.
In ring distribution system with two sources, voltageateach
node 1,2,3,4, and 5 is 195V,201.3V,200V,198.5V and 195V
respectively. The voltages of radial model with 2 sourcesare
decreases from bus 1 to bus 5. In ring distribution model
with 1 sources, bus 1 and bus 5 has same voltage which are
high compared with other bus voltages and in ring model
with 2 sources bus 1 and bus 5 has same voltage which are
low compared with other bus voltages of same model but
these all voltages are maximum when compared with radial
with 2 sources and ring with 1 sources.
The ring distribution system model operation is done by
closing the switch 1 and here given a three supply sources
by closing the switch 2 & switch 3 as shown in Fig 2.In all the
above discussion, very low voltages thatislessthan230V.So
that 3 three sources added for the ring distribution model.
Hence maximum voltageisobtainedwhencomparedwithall
the above discussion. The comparing voltages of radial
system model with 3 sources and ring distribution model
with 2 & 3 sources. The comparing voltages of radial system
model with 3 sources and ring distribution model with 2 & 3
sources is show in Fig.8.
Fig.8: comparing voltages of radial system model with 3
sources and ring distribution model with 2 & 3 sources
In Fig.8, Ring S3 means ring distribution model with three
sources. The ring distribution system with three sources,
voltage at each node 1,2,3,4, and 5 is 197.5V, 208.2V, 202V,
200V and 197.5V respectively. From this, voltage
fluctuations are less as compared with radial system model.
And also voltage is increased and maintained contingencyat
each node. This shows that voltageisincreaseswithincrease
in number of sources and also ring distribution system is
better than radial distribution system. Comparison of
Voltage drop VD at all the buses between radial and ringtype
distribution system are listed in table 3.
Table 3: Comparison of Voltage drop VD at all the buses
between radial and ring type distribution system
Cases Total Voltage
Drop VD in V
Radial with 1 sources 49.646
Radial with 2 sources 44.7
Radial with 3 sources 42.436
Ring with 1 sources 44.72
Ring with 2 sources 32.04
Ring with 3 sources 28.87
In above Table 3 gives the total voltage drop VD for the
different cases that is radial with source 1, source 2and
source 3 and ring with source 1, source 2and source 3. This
shows that voltage drop decreaseswithincreasedin number
of sources but when comparing radial and ring distribution
system voltage drop is very low in ring distribution system.
6. CONCLUSION
From the results, voltage at each node is very less in radial
distribution system as compared to ring type system. In
radial system voltage drop is more compared to ring type.
Hence by converting radial intoringtypedistributionsystem
by switching the breakers. The ringtypedistributionsystem
gives the better quality of supply, maintained the voltage
profile and voltage fluctuation will be less in the last point of
the consumers, the voltage drop is also less along the
distribution line as compared with radial system.
7. REFERENCES
[1] A. K. Saonerkar, B. Y. Bagde, “OptimizedDGPlacementin
Ring main DistributionSystemwithReconfigurationand
Capacitor Placement Using GA,” in Proc. ICACCT, IEEE
Conf., pp. 1077-1082, May 2014.
[2] R. Srinivasa Rao, K. Ravindra, K. Satish, and S. V. L.
Narasimham, “Power Loss Minimization in Distribution
System Using Network Reconfiguration in the Presence
of Distributed Generation,” IEEE Trans. Power Sys., vol.
28, no.1, pp. 317-325, Feb 2013.
[3] Mohammad Ali Hormozi, Mohammad Barghi Jahromi,
Gholamreza Nasiri. Optimal Network Reconfiguration
and Distributed Generation Placement in Distribution
System Using a Hybrid Algorithm. International Journal
of Energy and Power Engineering. Vol. 5, No. 5, 2016,
pp. 163-170. doi: 10.11648/j.ijepe.20160505.11
[4] M. E. Baran and F. Wu, “Network reconfiguration in
distribution system for loss reduction and load
balancing,” IEEE Trans. Power Del., vol. 4, no. 2, pp.
1401–1407, Apr. 1989.
[5] Pyone Lai Swe. Feeder Reconfiguration and Distributed
Generator Placement in Electric Power Distribution
Network. American Journal of Electrical and Computer
Engineering. Vol. 2, No. 2, 2018, pp. 56-63. doi:
10.11648/j.ajece.20180202.16
[6] J. Z. Zhu, “Optimal reconfiguration of electrical
distribution network using the refined genetic
algorithm,” Elect. Power Syst. Res., vol. 62, pp. 37–42,
2002.
[7] Jizhong Zhu, Xiaofu Xiong, Davis Hwang, and Ali
Sadjadpour, “A comprehensive method for
reconfiguration of electrical distribution network”IEEE
Conf., 2007.](https://image.slidesharecdn.com/irjet-v6i10118-191227085008/75/IRJET-Comparative-Study-of-Radial-and-Ring-Type-Distribution-System-5-2048.jpg)
![International Research Journal of Engineering and Technology (IRJET) e-ISSN: 2395-0056
Volume: 06 Issue: 10 | Oct 2019 www.irjet.net p-ISSN: 2395-0072
© 2019, IRJET | Impact Factor value: 7.34 | ISO 9001:2008 Certified Journal | Page 671
[8] M.Saradarzadeh, S.Farhangi, J.L.Schanen,P-O.Jeanniand
D.Frey, “The benefits of looping a radial distribution
system with a power flow controller”IEEEinternational
conference on power and energy 2010,
https://doi.org/10.1109/PECON.2010.5697674
[9] J. Lavaei, S. Low, “Relationship between power loss and
network topology in power sytems,” IEEE Conf. on
Decision and Control, pp.4004-4011, December 15-17,
2010.
[10] S.K. Salman and S.F. Tan, “Comparative Study of
Protection Requirements of Active Distribution
Networks Using Radial and Ring Operations” IEEE
PowerTech 2007
[11] Aman M.M, Jasmon G.B., Bakar A.H.A, Mokhlis H., Karimi
M. ‘Optimum shunt capacitor placementindistribution
system-A review and comparative study’. Renewable
and Sustainable Energy Reviews 2014;30: pp.429–439
[12] Prakash K., Sydulu M. ‘Particle swarm optimization
basedcapacitorplacementonradial distributionsystem’.
In Proceedings of IEEE power engineering society
general meeting; 2007. pp. 1–5.
[13] Kannana S. M., Renugab P., Kalyania S., Muthukumarana
E., ‘Optimal capacitor placement and sizingusingFuzzy-
DE and FuzzyMAPSO methods’. Applied Soft Computing
2011;11: pp.4997–5005
[14] Abul’Wafa A., R. ‘Optimal capacitor placement for
enhancing voltage stabilityin distributionsystemsusing
analytical algorithm and Fuzzy-RealCoded GA’.
International Journal of Electrical Power and Energy
System 2014; 55: pp.246–252.
[15] Amir Alipour, Christian Alexander C. Asis, Jefferson
Joseph P. Avanzado and Michael C. Pacis, “Study in the
Impact of Distributed Generator (DG) Placement and
Sizing on a Ring Distribution Network” IEEE 2016](https://image.slidesharecdn.com/irjet-v6i10118-191227085008/75/IRJET-Comparative-Study-of-Radial-and-Ring-Type-Distribution-System-6-2048.jpg)

The document presents a comparative study of radial and ring type electrical power distribution systems. It discusses how a radial distribution system has only one path of power flow, while a ring system has one or more alternate paths, improving reliability. A 5-bus distribution system is modeled in MATLAB/Simulink to compare the two system types. Simulation results show the ring type distribution system provides more reliable power supply with better voltage profile and quality compared to the radial system.