The document discusses the restoration of modern power distribution systems, focusing on the challenges of efficiently restoring service after faults. A simulation based on the IEEE 33-bus distribution system evaluates the impact of Static Var Compensators (SVC) on power loss and voltage stability, proposing a switching sequence to enhance operational efficiency. The study highlights the importance of reactive power management and presents findings on optimal SVC placement to improve system stability and minimize losses.
![ ISSN: 2088-8694
Int J Pow Elec & Dri Syst, Vol. 13, No. 4, December 2022: 2079-2085
2080
Curcic et al. [1] presents a review of the main characteristics of the key publications up to 1996. The
authors have shown that there are two fundamental objectives of the restoration problem. The first one is to
restore the maximum possible demand of the fault effected region and the second one is to implement the
restoration process at the earliest. In most of the earlier works loss minimization and load balancing between
feeders are not considered in the restoration process and that makes this work a novel attempt.
Romeno et al. [2] presented a comprehensive mathematical model has been proposed for the solution
of restoration problem in balanced radial distribution system. The authors have shown that the mixed integer
second-order conic model can be solved proficiently using commercial solved and the proposed model and
proposed solution can be used offline or online, depending upon time needed to solve the problem. But they
pointed out that the problem of verdict the sequence of switching operation is still under investigation.
A direct approach for unbalanced three phase distribution load flow solution is proposed in reference [3]. The
authors have developed two matrices from the topological characteristics of distribution system and these two
matrices are combined to form a direct approach for answering load flow problems. The authors have also
shown that the proposed method is suitable for large-scale distribution systems. Suliman [4] discussed voltage
profile enhancement in distribution network using static synchronous compensator STATCOM.
An efficient hybrid approach for volt/var control in distribution system with switching limits on tap a
shunt has been presented in reference [5]. The approach mentioned combines the strengths of a gradient
technique and a metaheuristic technique. It has been shown that the proposed method is 30-35 times faster and
is more accurate than the conventional genetic algorithm. But all distribution transformers are not provided
with tap setting facility hence in order to avoid the confusion applying SVC is a better alternative.
Arya et al. [6] present an algorithm for rescheduling reactive power control variable so as to have an
adequate load capability margin for current operating point has been described. The coordinated aggregation-
based particle swarm optimization technique has been used to minimize the total reactive power loss. The
control variables are similar as in the reference [5] therefore this paper helps in understanding the loss
minimization issue. But a mathematical approach is always more consistent than a soft computing. Hence in
the projected work a mathematical approach is adopted for SVC placement. Zabaiou et al. [7] given the idea
of preventive control approach for voltage stability improvement using voltage stability constrained optimal
power flow based on static line voltage stability indices. Patil and Karajgi [8] developed a technique for an
optimal placement of multiple FACTS devices using PSO and CSA algorithms. Abdullah et al. [9] enhanced
the stability of power system using optimal location of FACTS devices. Gupta et al. [10] presented mitigation
of congestion in a power system and role of FACTS devices, in [11] application of voltage stability index for
congestion management is discussed whereas [12] presents a comparative analysis of different power delivery
systems using voltage stability index.
Dolatabadi [13] presented an enhanced IEEE 33 bus benchmark test system for distribution system
studies where presence of electrical vehicle is taken into consideration. Distributed coordination of electric
vehicle providing v2g regulation services [14], [15]. Hatziargyriou [16] presented a guest editorial special
section on microgrids for sustainable energy system. A multiagent system for controlled charging of a large
population of electric [17], Dilek et al. [18] presented a simultaneous phase balancing at substations and
switches with time varying load patterns. Lin et al. [19], reported an expert system for three phase balancing
of distribution feeder, Tewari et al. [20] gave the concepts of coordinated control of OLTC and energy storage
for voltage regulation in distribution network with high PV penetration, Lotfi et al. [21] studied the impact of
feeder reconfiguration on automated distribution network with respect to resilience concept, Ansari et al. [22]
discussed the planning for distribution system with grey wolf optimization method, Bhatt and Chandel [23]
presented an intelligent water drop approach for simultaneous reconfiguration and DG integration in
distribution system, Kim et al. [24] presented an advanced power distribution system configuration for smart
grid. Ghadban et al. [25] purposed an assessment of voltage stability based on power transfer stability index
using computational intelligence models. Hinda and Khiat [26] gave the idea of real-time simulation of static
synchronous condenser (STATCOM) for compensation of reactive power, whereas a study of reconfiguration
of power distribution systems considering reliability and power loss was discussed by Amanulla et al. [27].
After reviewing the relevant literature, it is observed that there is no proposal for switching sequence for
restoration. Solving it using static var compensator (SVC) is a noble attempt. It can be easily adopted to the
restoration problem.
2. POWER FLOW WITH SVC
Reactance of SVC can be adjusted either by using firing angle limits or reactance limits. With the help
of SVC non-linear power equations and the linearized equations, used in Teng’s method is derived. The current
drawn by SVC can be written as (1).](https://image.slidesharecdn.com/1321953-240910084103-1713b226/75/Restoration-of-a-new-age-power-distribution-system-2-2048.jpg)
![Int J Pow Elec & Dri Syst ISSN: 2088-8694
Restoration of a new age power distribution system (Moazzam Haidari)
2081
𝐼𝑆𝑉𝐶 = j𝐵𝑆𝑉𝐶𝑉𝐾 (1)
The reactive power drawn and injected at the bus is (2).
𝑄𝑆𝑉𝐶 = 𝑄𝐾 = −𝑉𝐾
2
𝐵𝑆𝑉𝐶 (2)
The linearized equation is given as (3).
[
∆𝑃𝐾
∆𝑄𝐾
]
(𝑖)
= [
0 0
0 𝑄𝐾
]
(𝑖)
[
∆𝑄𝐾
∆ 𝐵𝑆𝑉𝐶 𝐵𝑆𝑉𝐶
⁄
]
(𝑖)
(3)
Where the equivalent susceptanceB_SVC is susceptance and is taken to be state variable. The variable shunt
susceptanceB_SVC is updated accordingly, at the end of (1) iteration.
𝐵𝑆𝑉𝐶
(𝑖)
= 𝐵𝑆𝑉𝑐
(𝑖−1)
+ (
∆𝐵𝑆𝑉𝐶
𝐵𝑆𝑉𝐶
)
(𝑖)
𝐵𝑆𝑉𝐶
(𝑖−1)
(4)
It is compulsory to maintain the magnitude of nodal voltage at the specified value. Here, the changing
susceptance represents the total SVC susceptance. When the level of compensation has been determined, the
firing angle of the thyristor can be calculated. The SVC susceptance and thyristor firing angle are non-linearly
related. Hence, the additional calculation requires an iterative solution.
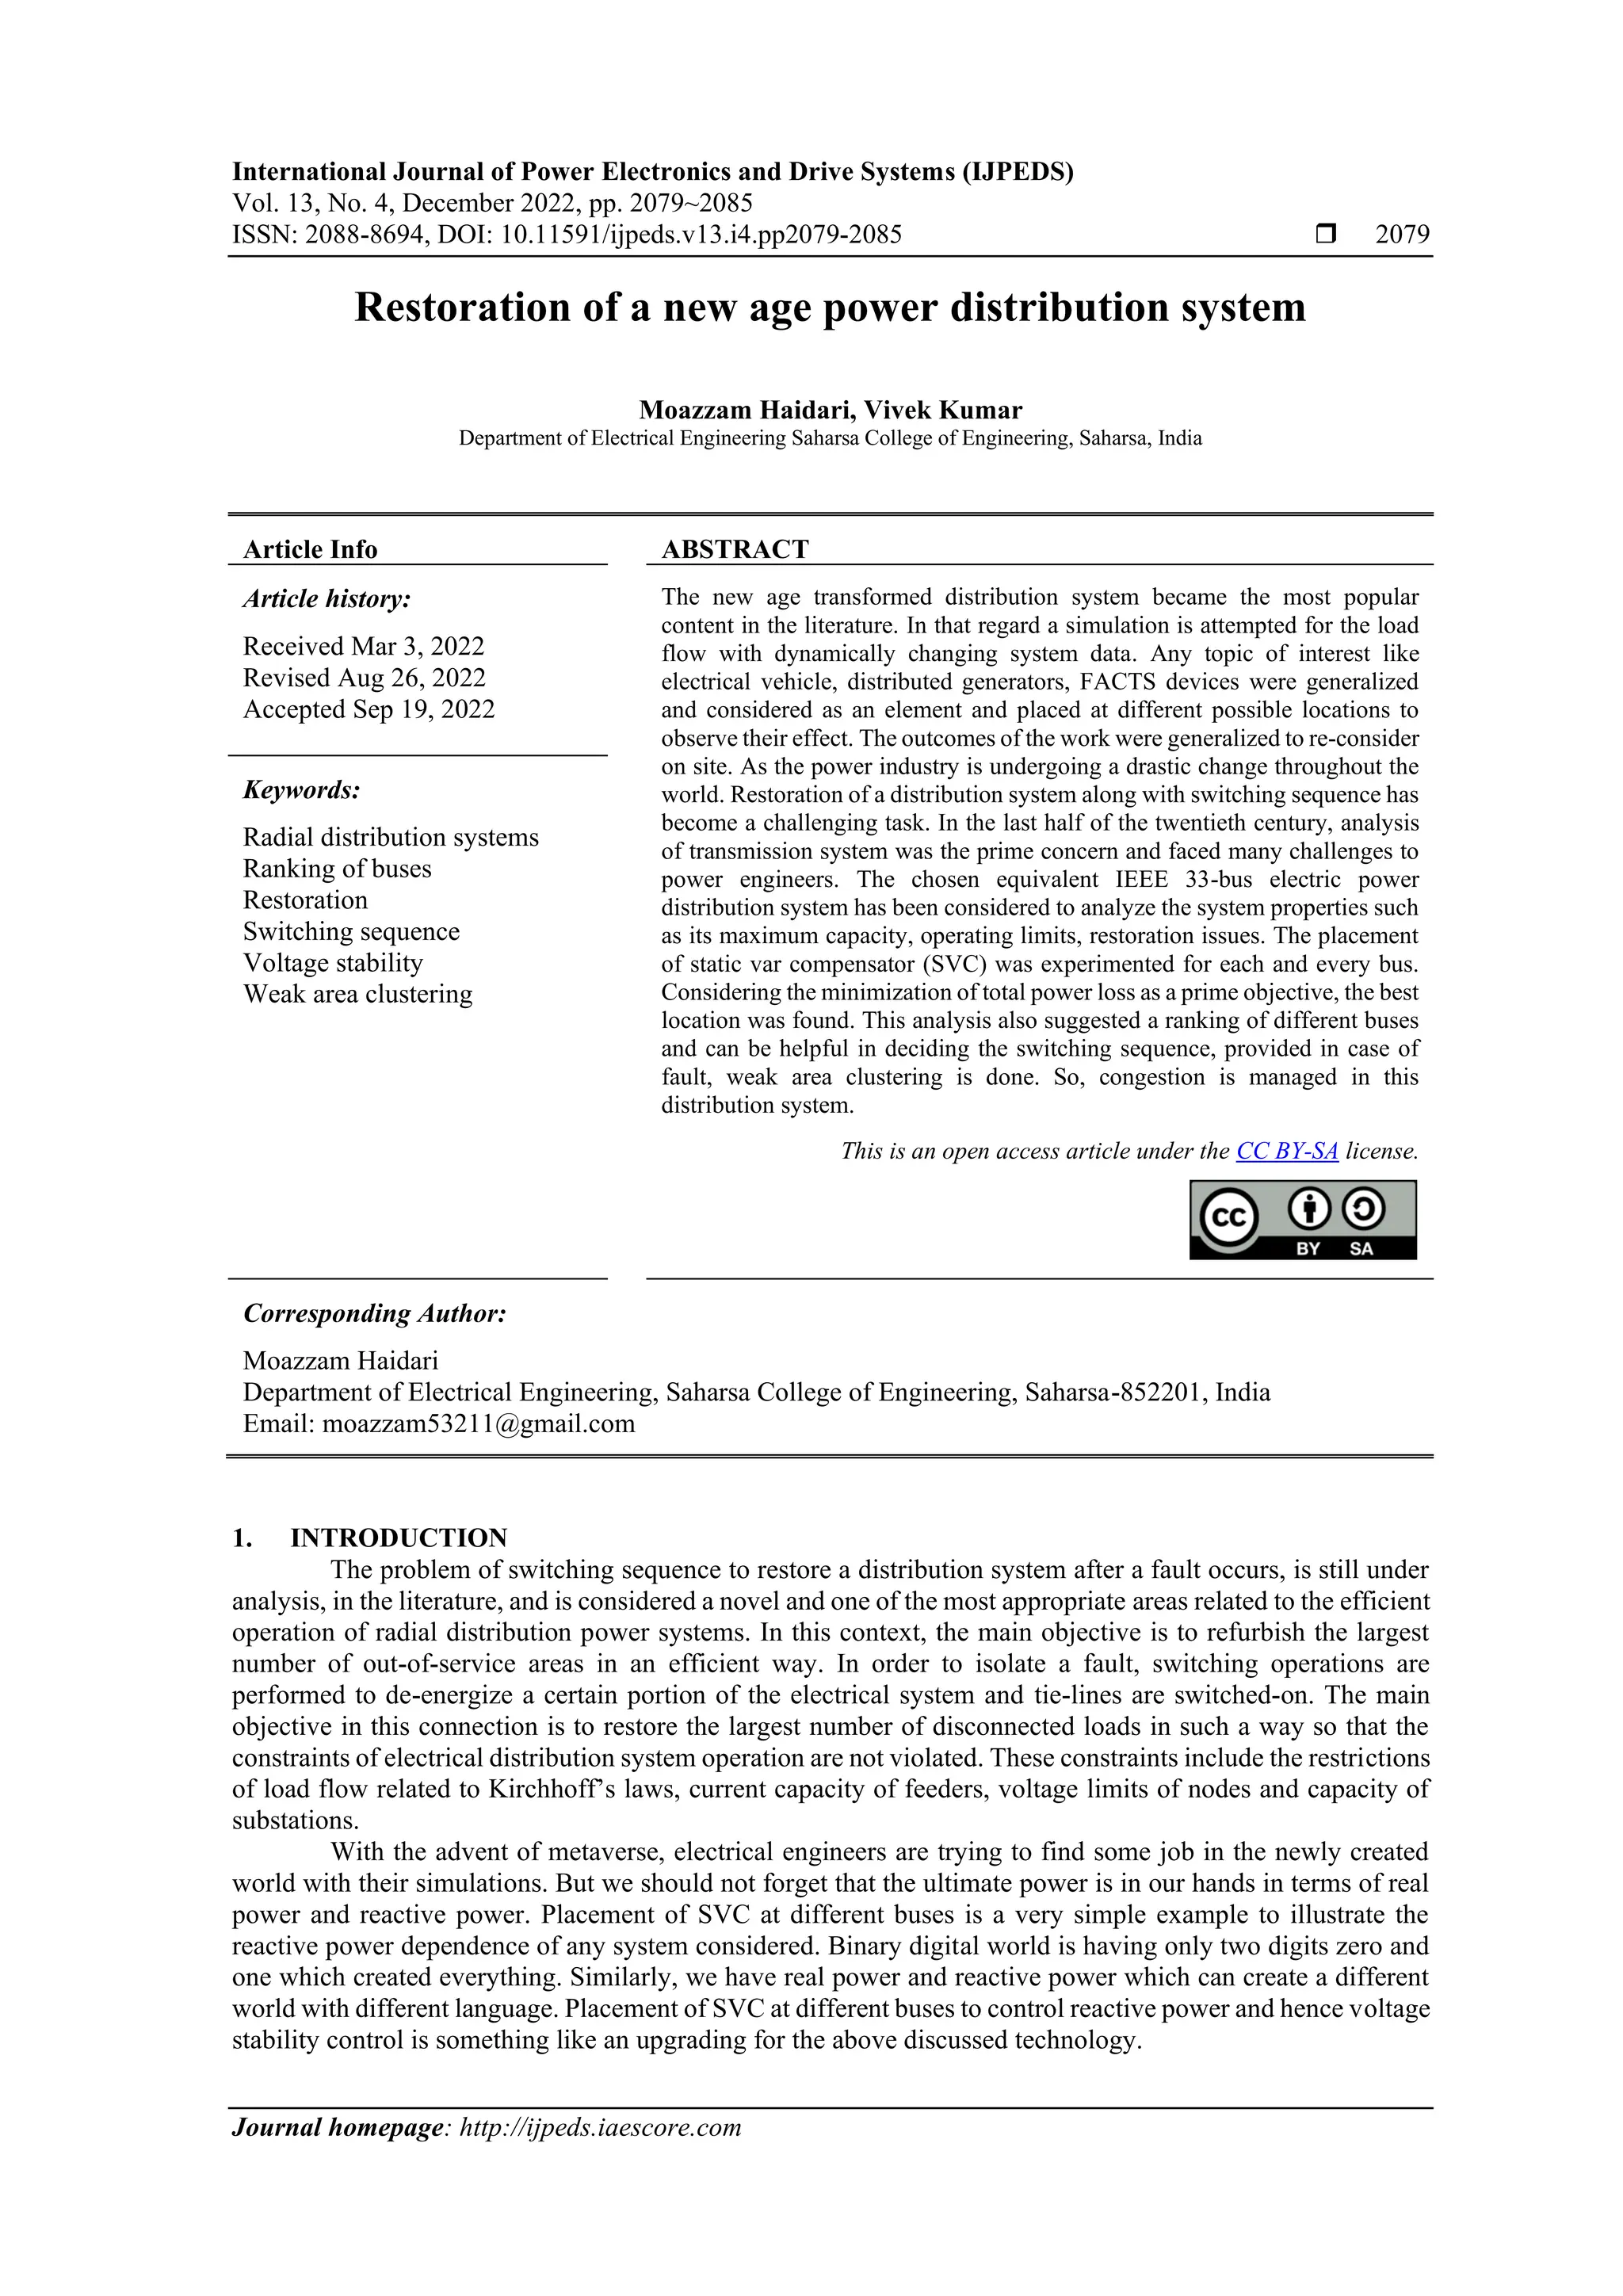
Standard IEEE 33-bus radial distribution system is considered for the analysis. Figure 1. Shows the
single line diagram of the system chosen. This system is radial type distribution feeder having the base voltage
12 kV-66 kV and base apparent power 100 MVA. It consists of 32 distribution lines and one slack bus. Figure 2
shows the same IEEE 33-busradial distribution system without all tie-lines provided and Figure 3 shows the
same IEEE 33-busradial distribution system with all tie-lines provided. Five different tie lines provided are 22-
12, 21-8, 9-15, 25-29 and 33-18. These tie-lines can be connected in case of fault according to the type and
condition of the fault. Representation of simulation of two buses is shown below in Figure 1 for illustration
purpose, which can be integrated up to 33 bus system as shown in Figure 2 and Figure 3. A direct approach for
distribution system load flow proposed by Teng [3] is used in this work. This power flow method is robust for
distribution system because of its fast convergence.
Figure 1. Simulation of radial distribution system with two buses](https://image.slidesharecdn.com/1321953-240910084103-1713b226/75/Restoration-of-a-new-age-power-distribution-system-3-2048.jpg)

![ ISSN: 2088-8694
Int J Pow Elec & Dri Syst, Vol. 13, No. 4, December 2022: 2079-2085
2084
Figure 6. Total real power loss when SVC is placed
at different buses
Figure 7. Total reactive power loss when SVC is
placed at different buses
4. CONCLUSION
In this paper, a comprehensive analysis of different locations for SVC placement is analyzed to rank
the buses which in turn suggested the switching sequence for any restoration problem. Test results show
excellent performance with regard to the voltage stability issue. The proposed solution can be developed for
offline or online applications. Finally, we consider this work to be an initial proposal that can lead to further
research in related objectives such as switching sequence based on: i) transient stability and ii) economic
aspects.
The classical thirty-three bus system has been enhanced by several extensions such as distribution of
generators, FACTS devices, branches with switches and systems with energy storage capacities. It provides a
resolution for online testing and analysis of voltage profile. Numerous data for reconfiguration have been
tabulated for this work which helps in compensation of reactive power and switching of branch provides many
opportunities a modern power distribution system. Appropriate simulations tried their best to generate a good
database for further studies.
REFERENCES
[1] S. S Curcic, C. S. Ozveren, L. Crowe, and P. K. L. Lo, “Electric power distribution network restortation: A Survey of papers and a
review of the restoration problem,” Electrical Power System Restoration, vol. 35, pp. 73-86, 1996, doi: 10.1016/0378-
7796(95)00991-4.
[2] R. Romeno, J. F. Franco, F. B. Leao, M. J. Rider, and E. S. de Souza, “A New mathematical model for the restoration problem in
balanced radial distribution systems,” IEEE Transaction Power Systems, vol. 31, no. 2, 2016, doi: 10.1109/TPWRS.2015.2418160.
[3] J.-H. Teng, “A direct approach for distribution system load flow solutions,” IEEE Transactions on Power Delivery, vol. 18. no. 3,
pp. 882−887, July 2003, doi: 10.1109/TPWRD.2003.813818.
[4] M. Y. Suliman, “Voltage profile enhancement in distribution network using static synchronous compensator STATCOM,”
International Journal of Electrical and Computer Engineering (IJECE), vol. 10, no. 4, pp. 3367−3374, August 2020, doi:
10.11591/ijece.v10i4.pp3367-3374.
[5] A. Mohapatra, P. R. Bijwe, and B. K. Panigrahi, “An efficient hybrid approach for volt/var control in distribution systems,” IEEE
Transactions on Power Delivery, vol. 29, no. 4, 2014, doi: 10.1109/TPWRD.2014.2306845.
[6] L. D. Arya, S. C. Choube, M. Shrivastav, D. P. Kothari, “Loadability margin enhancement using co-ordinated aggregation based
Particle Swarm Optimization (PSO),” Electric Power and Energy systems, vol. 32, pp. 975-984, 2010, doi:
10.1016/j.ijepes.2010.02.007.
[7] T. Zabaiou, L. A. Dessaint, and I. Kamwa, “Preventive control approach for voltage stability improvement using voltage stability
constrained optimal power flow based on static line voltage stability indices,” IET Generation, Transmission & Distribution, vol.
8, Iss. 5, pp. 924-934, 2014, doi: 10.1049/iet-gtd.2013.0724.
[8] B. Patil and S. B. Karajgi, “Optimized placement of multiple FACTS devices using PSO and CSA algorithms,” International
Journal of Electrical and Computer Engineering (IJECE), vol. 10, no. 4, pp. 3350−3357, August 2020, doi:
10.11591/ijece.v10i4.pp3350-3357.
[9] A. N. Abdullah, A. M. Ghadhban, H. S. Hameed, and H. I. Hussein, “Enhancement the stability of power system using optimal
location of FACTS devices,” Indonesian Journal of Electrical Engineering and Computer Science (IJEECS), vol. 18, no. 2,
pp. 648−65, May 2020, doi: 10.11591/ijeecs.v18.i2.pp648-655.
[10] M. Gupta, V. Kumar, G. K. Banerjee, and N. K. Sharma, “Mitigating congestion in a power system and role of FACTS devices,”
Hindawi Publishing Corporation, vol. 2017, 2017, doi: 10.1155/2017/4862428.
[11] M. Gupta, V. Kumar, N. K. Sharma, and G. K. Banerjee, “Application of voltage stability index for congestion management,” in
Proceedings of 2nd International Conference on Intelligent Computing and Applications, 2017, pp. 253−264, doi: 10.1007/978-
981-10-1645-5_22.](https://image.slidesharecdn.com/1321953-240910084103-1713b226/75/Restoration-of-a-new-age-power-distribution-system-6-2048.jpg)
![Int J Pow Elec & Dri Syst ISSN: 2088-8694
Restoration of a new age power distribution system (Moazzam Haidari)
2085
[12] V. Kumar, M. Gupta, N. K. Sharma, and G. K. Banerjee, “Comparative analysis of different power delivery systems using voltage
stability index,” in 2nd IEEE International Conference on Innovative Applications of Computational Intelligence on Power, Energy
and Controls with their Impact on Humanity (CIPECH-16), 18th-19th November, 2016, pp. 166−169, doi:
10.1109/CIPECH.2016.7918757.
[13] S. H. Dolatabadi, M. Ghorbanian, and P. Siano, “An enhanced IEEE 33 bus benchmark test system for distribution system studies,”
Submitted to IEEE Transaction Power Systems, vol. 33, no. 03, November 2020, doi: 10.1109/TPWRS.2020.3038030.
[14] E. L. Karfopoulos, K. A. Panourgias, and N. D. Hatziargyriou, “Distributed coordination of electric vehicles providing v2g
regulation services,” IEEE Trans. Power Syst., vol. 31, no. 4, pp. 2834–2846, July 2016, doi: 10.1109/TPWRS.2015.2472957.
[15] E. L. Karfopoulos and N. D. Hatziargyriou, “Distributed coordination of electric vehicles providing v2g services,” IEEE Trans.
Power Syst., vol. 31, no. 1, pp. 329–338, Jan 2016, doi: 10.1109/TPWRS.2015.2395723.
[16] N. Hatziargyriou, “Guest editorial special section on microgrids for sustainable energy systems,” IEEE Trans. Sustain. Energy,
vol. 5, no. 4, pp. 1309–1309, Oct 2014, doi: 10.1109/TSTE.2014.2351891.
[17] E. L. Karfopoulos, and N. D. Hatziargyriou, “A multi-agent system for controlled charging of a large population of electric
vehicles,” IEEE Trans. Power Syst., vol. 28, no. 2, pp. 1196–1204, May 2013, doi: 10.1109/TPWRS.2012.2211624.
[18] M. Dilek, R. P. Broadwater, J. C. Thompson, and R. Seqiun, “Simultaneous phase balancing at substations and switches with time-
varying load patterns,” IEEE Trans. Power Syst., vol. 16, no. 4, pp. 922–928, 2001, doi: 10.1109/59.962447.
[19] C. Lin, C. Chen, H. Chuang, M. Huang, and C. Huang, “An expert system for three-phase balancing of distribution feeders,” IEEE
Trans. Power Syst., vol. 23, no. 3, pp. 1488–1496, 2008, doi: 10.1109/TPWRS.2008.926472.
[20] T. Tewari, A. Mohapatra and S. Anand, “Coordinated control of oltc and energy storage for voltage regulation in distribution
network with high PV penetration,” IEEE Trans. Sustain. Energy, vol. 12, no. 1, pp. 262-272, Jan. 2021, doi:
10.1109/TSTE.2020.2991017.
[21] H. Lotfi, A. A. Shojaei, V. Kouhdaragh, and I. S. Amiri, “The impact of feeder reconfiguration on automated distribution network
with respect to resilience concept,” SN Appl. Sci. 2, Article No. 1590, 2020, DOI: 10.1007/s42452-020-03429-z.
[22] M. M. Ansari et al., “Planning for distribution system with grey wolf optimization method,” J. Electr. Eng. Technol, vol. 15,
pp.1485–1499, 2020, doi: 10.1007/s42835-020-00419-4.
[23] Bhatt, N., Chandel, A.K, “An intelligent water drop approach for simultaneous reconfiguration and DG integration in distribution
system,” Energy Syst, 2022, doi: 10.1007/s12667-022-00521-8.
[24] J. Kim, S. Cho, and H. Shin, “Advanced power distribution system configuration for smart grid,” IEEE Trans. Smart Grid, vol. 4,
no. 1, pp. 353–358, 2013, doi: 10.1109/TSG.2012.2233771.
[25] A. M. Ghadban, G. A. Salman, and H. I. Hussein, “Assessment of voltage stability based on power transfer stability index using
computational intelligence models,” International Journal of Electrical and Computer Engineering (IJECE), vol. 11, no. 4, pp.
2790−2797, August 2021, doi: 10.11591/ijece.v11i4.pp2790-2797.
[26] A. Hinda and M. Khiat, “Real-time simulation of static synchronous condenser (STATCOM) for compensation of reactive power,”
International Journal of Electrical and Computer Engineering (IJECE), vol. 10, no .6, pp. 5599−5608, December 2020, doi:
10.11591/ijece.v10i6.pp5599-5608.
[27] B. Amanulla, S. Chakrabarti and S. N. Singh, “Reconfiguration of power distribution systems considering reliability and power
loss,” in IEEE Transactions on Power Delivery, vol. 27, no. 2, pp. 918−926, April 2012, doi: 10.1109/TPWRD.2011.2179950.
BIOGRAPHIES OF AUTHORS
Moazzam Haidari received his M Tech and B Tech from Aligarh Muslim
University, Aligarh India in the year 2014 and 2012 respectively and is presently working as
an assistant Professor in the department of Electrical Engineering at Saharsa College of
Engineering, Saharsa under the Department of Science and Technology government of Bihar.
M Haidari has about 6 years of academic and industries experience. He has also worked with
Indian railway in 2016 and Bihar State Power Holding in 2017. His area of interest includes
Modern control systems, recent trends in Power systems Optimizations & Control. He can be
contacted at email: moazzam53211@gmail.com.
Vivek Kumar is an assistant professor at Saharsa College of Engineering,
Saharsa, in Electrical Engineering Department. Currently he is pursuing another Master’s
degree from IIT Kanpur in a different area Derivative and Risk Management in online mode.
He earned a B.Tech degree in Electrical Engineering from Dr. MGR Educational and
Research Institute, Chennai, an M.Tech degree in Power System from SRM University,
Chennai and a Ph.D in Electrical Engineering from IFTM University, Moradabad. Earlier he
worked as an Assistant Professor at IFTM University, Moradabad, Naraina Vidyapeeth,
Kanpur and ACT College of Engineering, Kanchipuram, India. His areas of interest include
Voltage stability, Optimization Techniques and Power System Control. He can be contacted
at email: electricalvivek@gmail.com.](https://image.slidesharecdn.com/1321953-240910084103-1713b226/75/Restoration-of-a-new-age-power-distribution-system-7-2048.jpg)