Download as PDF, PPTX
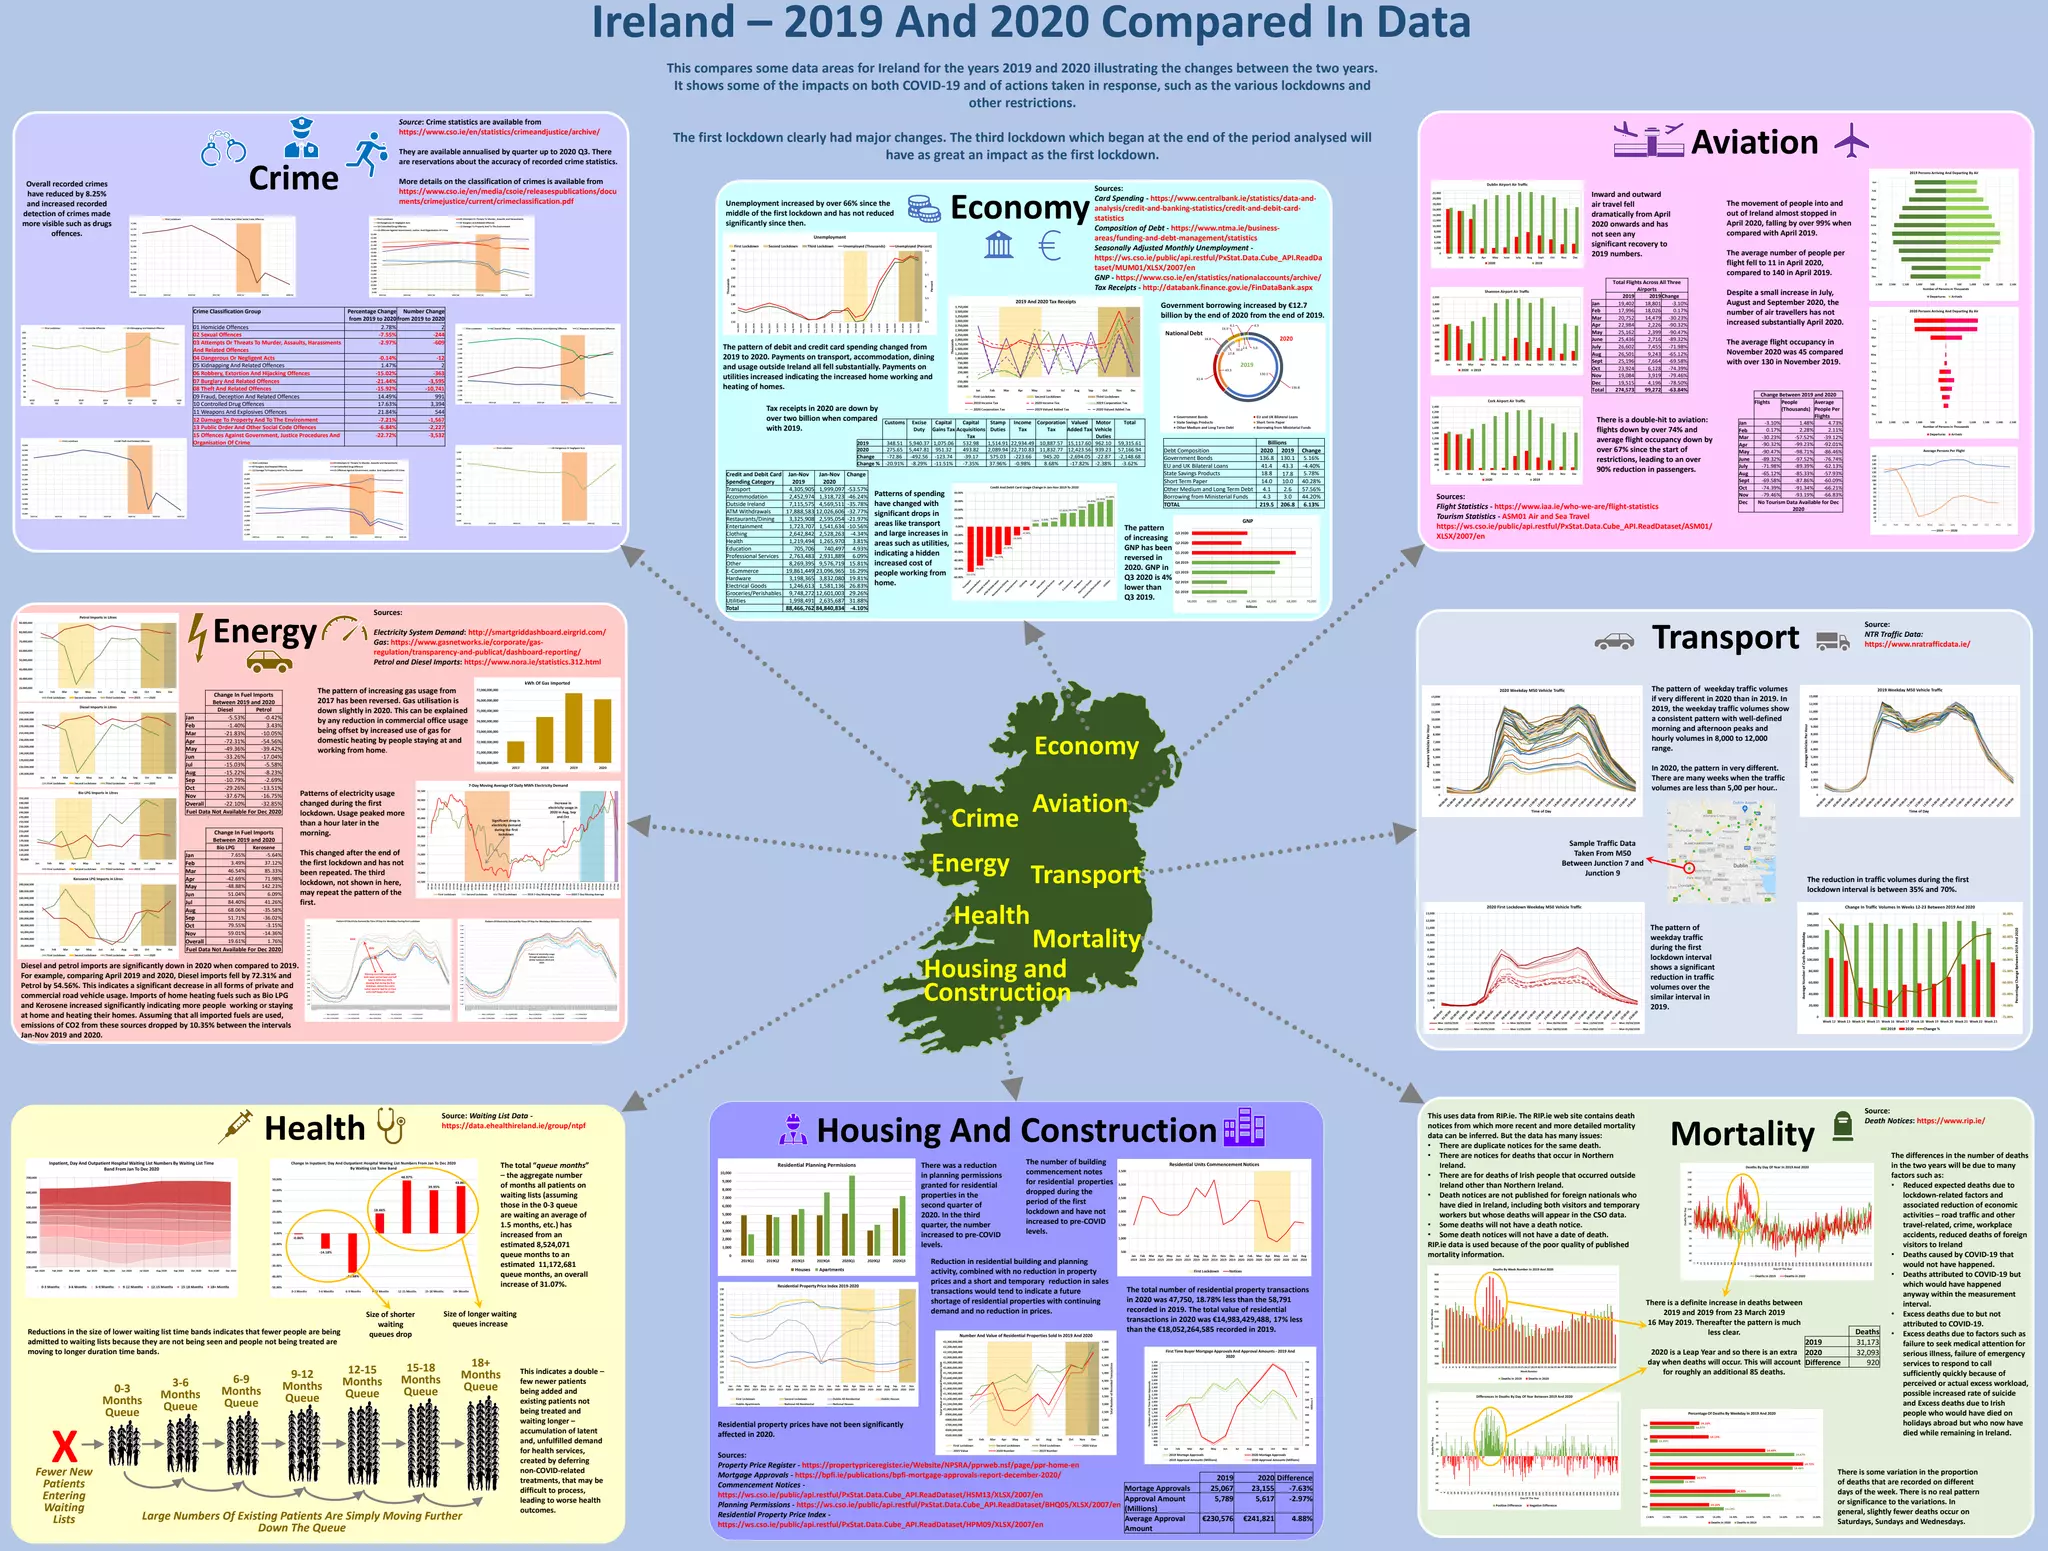

The document provides a comprehensive analysis of crime statistics, fuel imports, flight activity, public health, and economic data from 2019 to 2020, highlighting significant declines in various sectors due to the COVID-19 pandemic. Recorded crimes decreased overall by 8.25%, while fuel imports showed a dramatic drop in diesel and petrol usage, paralleling decreased air travel and an increased reliance on home heating fuels. Economic indicators, including a rise in unemployment and government borrowing, reveal a substantial impact on Ireland's economy during this period.