Download to read offline
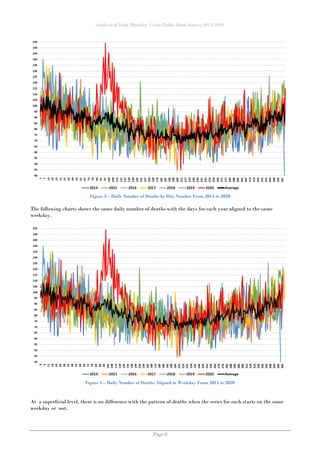
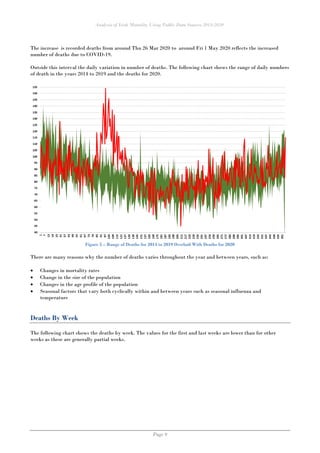
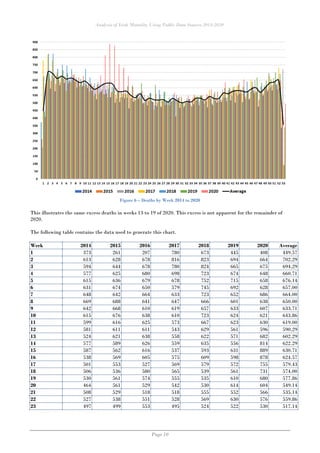
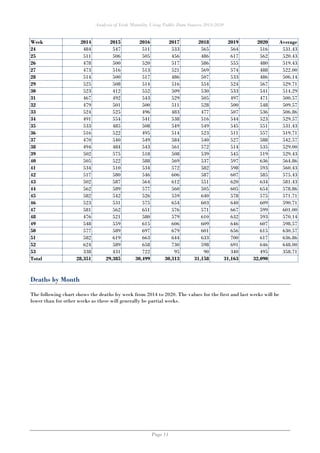
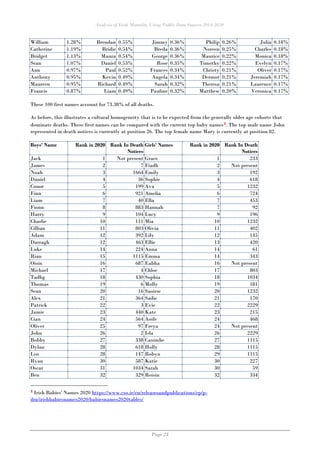

This document provides an analysis of mortality trends in Ireland from 2014 to 2020 using data sourced from the rip.ie website. It highlights discrepancies between the more detailed, informal death notice data from rip.ie and the official mortality statistics from the CSO, addressing issues such as data availability, accuracy, and demographic details. The analysis tracks deaths by various metrics including day of the week, month, and county while emphasizing the impact of COVID-19 on mortality patterns in 2020.