
Recommended
Recommended
More Related Content
What's hot
What's hot (20)
Similar to Prévisions économiques du printemps 2019 pour le Luxembourg
Similar to Prévisions économiques du printemps 2019 pour le Luxembourg (20)
More from Paperjam_redaction
More from Paperjam_redaction (20)
Recently uploaded
Recently uploaded (20)
Prévisions économiques du printemps 2019 pour le Luxembourg
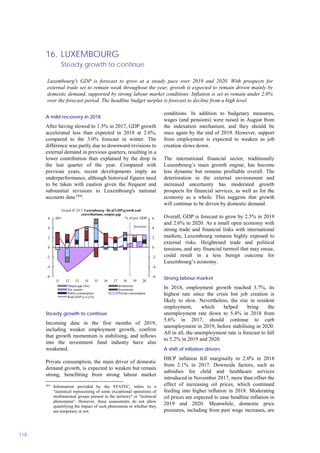
- 1. 16. LUXEMBOURG Steady growth to continue 118 A mild recovery in 2018 After having slowed to 1.5% in 2017, GDP growth accelerated less than expected in 2018 at 2.6%, compared to the 3.0% forecast in winter. The difference was partly due to downward revisions to external demand in previous quarters, resulting in a lower contribution than explained by the drop in the last quarter of the year. Compared with previous years, recent developments imply an underperformance, although historical figures need to be taken with caution given the frequent and substantial revisions to Luxembourg's national accounts data (84) . Steady growth to continue Incoming data in the first months of 2019, including weaker employment growth, confirm that growth momentum is stabilising, and inflows into the investment fund industry have also weakened. Private consumption, the main driver of domestic demand growth, is expected to weaken but remain strong, benefitting from strong labour market (84) Information provided by the STATEC, refers to a "statistical reprocessing of some exceptional operations of multinational groups present in the territory" or "technical phenomena". However, these assessments do not allow quantifying the impact of such phenomena or whether they are temporary or not. conditions. In addition to budgetary measures, wages (and pensions) were raised in August from the indexation mechanism, and they should be once again by the end of 2019. However, support from employment is expected to weaken as job creation slows down. The international financial sector, traditionally Luxembourg’s main growth engine, has become less dynamic but remains profitable overall. The deterioration in the external environment and increased uncertainty has moderated growth prospects for financial services, as well as for the economy as a whole. This suggests that growth will continue to be driven by domestic demand. Overall, GDP is forecast to grow by 2.5% in 2019 and 2.6% in 2020. As a small open economy with strong trade and financial links with international markets, Luxembourg remains highly exposed to external risks. Heightened trade and political tensions, and any financial turmoil that may ensue, could result in a less benign outcome for Luxembourg’s economy. Strong labour market In 2018, employment growth reached 3.7%, its highest rate since the crisis but job creation is likely to slow. Nevertheless, the rise in resident employment, which helped bring the unemployment rate down to 5.4% in 2018 from 5.6% in 2017, should continue to curb unemployment in 2019, before stabilising in 2020. All in all, the unemployment rate is forecast to fall to 5.2% in 2019 and 2020. A shift of inflation drivers HICP inflation fell marginally to 2.0% in 2018 from 2.1% in 2017. Downside factors, such as subsidies for child and healthcare services introduced in November 2017, more than offset the effect of increasing oil prices, which continued feeding into higher inflation in 2018. Moderating oil prices are expected to ease headline inflation in 2019 and 2020. Meanwhile, domestic price pressures, including from past wage increases, are -6 -4 -2 0 2 4 6 -6 -4 -2 0 2 4 6 11 12 13 14 15 16 17 18 19 20 pps. Output gap (rhs) Inventories Net exports Investment Public consumption Private consumption Real GDP(y-o-y%) forecast % of pot.GDP Graph II.16.1: Luxembourg- Real GDPgrowth and contributions, output gap Luxembourg's GDP is forecast to grow at a steady pace over 2019 and 2020. With prospects for external trade set to remain weak throughout the year, growth is expected to remain driven mainly by domestic demand, supported by strong labour market conditions. Inflation is set to remain under 2.0% over the forecast period. The headline budget surplus is forecast to decline from a high level.
- 2. Member States, Luxembourg 119 set to reassert their influence, although those will be offset by new measures to be implemented in 2020, including free public transport on the national network. All in all, headline inflation should fall to 1.8% in 2019 and 1.7% in 2020. The general government surplus will decline from a high level The general government surplus rose to 2.4% of GDP in 2018, from 1.4% in 2017. Total revenues were buoyant and increased by 9.1% underpinned by both direct and indirect taxes. Revenues from current income and wealth taxes rose by 15.2%, in particular revenues from direct corporate taxes increased substantially, partially due to an accelerated collection of revenues linked to the introduction of the automatic tax declaration. The sharp increase in corporate income tax revenues was accompanied by a sharp increase in payroll taxes. VAT revenues also showed strong growth in line with the acceleration of private consumption. In 2019, planned expenditure increases mean that government expenditure growth is expected to outpace revenue growth. Recent measures announced by the government, such as the compensation of employees and current transfers, are expected to boost expenditure by 0.4 pps. of GDP. Revenue growth is expected to slow down compared to the previous year as the impact of the introduction of the automatic tax declaration will fade away. In 2019, the general government surplus is expected to decline to 1.4% of GDP. The general government surplus is projected to decline further in 2020 when revenues will be impacted by the recent government measures such as the free public transport, the increase in minimum social wages through tax credits and the reduction in the corporate tax rate from 18% to 17%. The surplus is projected then to fall to 1.1% of GDP. The structural surplus is expected to decline over the forecast horizon, but remain comfortably positive. Luxembourg’s debt-to-GDP ratio declined to 21.4% in 2018 from 23% in 2017. It is expected to decline further over the forecast horizon, as the buffer accumulated by the central government will be used to limit the need for debt issuance to finance its projected deficits. mio EUR Curr. prices % GDP 99-14 2015 2016 2017 2018 2019 2020 55299.4 100.0 3.3 3.9 2.4 1.5 2.6 2.5 2.6 16964.7 30.7 2.5 3.2 1.7 3.0 4.2 3.6 2.5 9421.8 17.0 3.5 2.8 2.5 3.1 4.0 2.7 3.0 10459.6 18.9 4.5 -9.9 10.4 4.0 -2.7 2.5 1.6 4206.4 7.6 6.9 -19.1 15.8 14.8 -15.6 3.8 1.6 123361.5 223.1 6.6 5.3 3.8 -1.9 4.5 1.8 2.4 104952.4 189.8 7.1 4.3 4.5 -2.2 5.1 1.8 2.4 39199.4 70.9 1.3 5.7 2.9 6.0 1.6 3.0 3.0 2.4 -0.5 2.8 2.2 1.5 2.0 1.6 0.0 1.0 -0.4 -0.5 0.6 0.0 0.0 1.0 3.4 0.0 -0.1 0.5 0.5 1.0 3.2 2.6 3.0 3.4 3.7 3.1 2.8 4.2 6.5 6.3 5.6 5.4 5.2 5.2 3.1 1.6 0.9 3.3 2.1 3.0 2.1 3.0 0.3 1.5 5.2 3.3 3.5 2.3 0.0 0.7 0.6 3.0 -0.5 1.7 0.6 - - - - - - - 3.1 -0.4 0.9 2.2 3.8 1.8 1.7 2.5 0.1 0.0 2.1 2.0 1.8 1.7 0.4 -3.1 5.0 0.4 0.9 0.1 0.0 -5.5 0.1 1.2 1.2 1.4 1.3 1.6 4.0 2.0 2.6 4.8 4.8 4.6 4.7 3.3 1.0 2.0 4.0 3.9 3.5 3.6 1.7 1.4 1.9 1.4 2.4 1.4 1.1 1.9 1.5 1.8 1.5 2.1 0.9 0.5 - 1.3 1.7 1.5 2.1 0.9 0.5 12.8 22.2 20.7 23.0 21.4 20.7 20.3 Net lending (+) or borrowing (-) vis-a-vis ROW (c) (a) as % of total labour force. (b) gross saving divided by adjusted gross disposable income. (c) as a % of GDP. (d) as a % of potential GDP. Cyclically-adjusted budget balance (d) Real unit labour cost Imports (goods and services) General government balance (c) Unit labour costs whole economy Inventories Terms of trade of goods Table II.16.1: Net exports Public Consumption Trade balance (goods) (c) Employment Annual percentage change2017 GDP Private Consumption Exports (goods and services) GNI (GDP deflator) Structural budget balance (d) Saving rate of households (b) Main features of country forecast - LUXEMBOURG Unemployment rate (a) Gross fixed capital formation Current-account balance (c) Contribution to GDP growth: General government gross debt (c) GDP deflator Compensation of employees / head of which: equipment Domestic demand Harmonised index of consumer prices