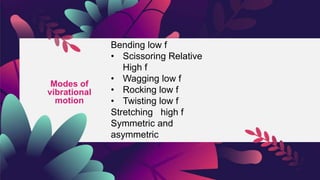
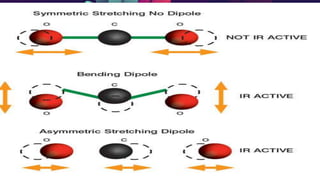
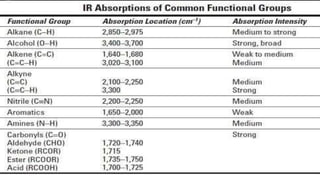
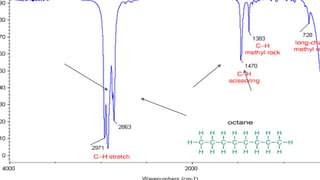
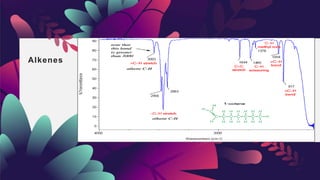
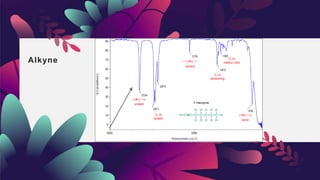
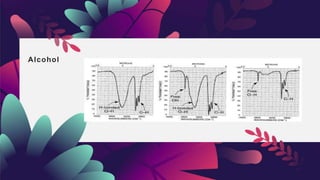
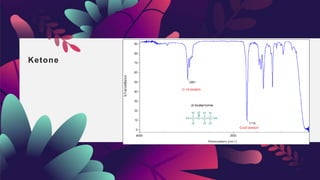
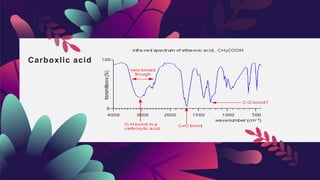
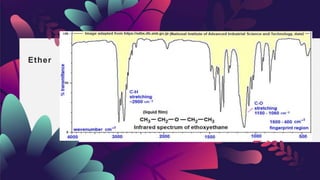
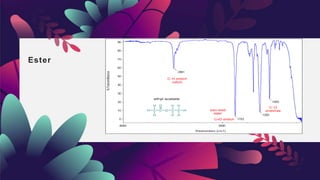
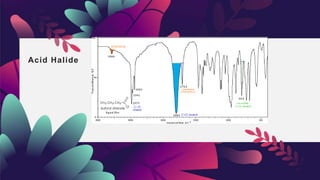
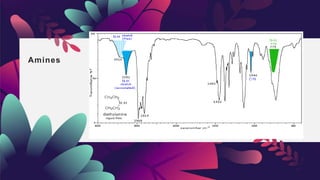
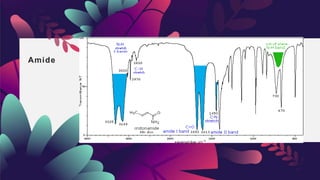
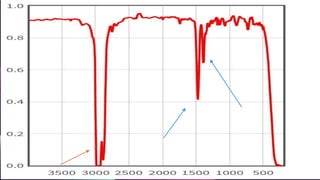
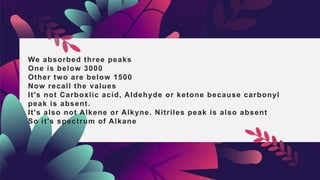
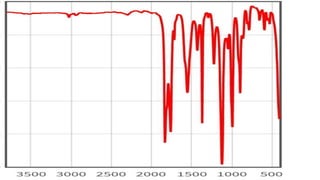
IR SPECTROSCOPY
Muhammad Naveed
MS Chemistry
Definitio
n
Infrared Spectroscopy is the analysis of
infrared light interacting with a molecule. This
can be analyzed in three ways by measuring
absorption, emission and reflection.
Main
concern
It's main function for the determination of
Functional group.
It give structural information.
Wavenumber. It is the number of waves per
unit distance. Typically, it is measured using
cm-1 and is given by- ν ¯ = 1/ λ
Which
molecules
show response
to IR
That have dipole movement
That are Asymmetric
No response from symmetric.
Every bond have different IR spectrum
Modes of
vibrational
motion
Bending low f
• Scissoring Relative
High f
• Wagging low f
• Rocking low f
• Twisting low f
Stretching high f
Symmetric and
asymmetric
Bending vibration
A change in the angle occurring between two bonds is
known as a bending vibration.
Stretching vibration
When there is a continuous change in the interatomic
distance along the axis of the bond between two atoms,
In symmetric stretching, two or more bonds vibrate in and
out together. In asymmetric stretching, some bonds are
getting shorter at the same time as others are getting longer
When there is a continuous change in the interatomic distance along
the axis of the bond between two atoms, this process is known as a
stretching vibration. A change in the angle occurring between two
bonds is known as a bending vibration. Four bending vibrations exist
namely, wagging, twisting, rocking and scissoring.
Combination band and Difference bands
When two vibrational frequencies in a
molecules couple to give rise to a
vibration of a new frequency within the
molecule and when such a vibration is
IR active..
Not all possible combination occurs.
When fundamental vibration couple
with overtone or combination band is
called Fermi resonance.
• The observed frequency is from
the difference between the two
interacting bands
• It's similar to combination band
IR SPECTRA COMPLICATIONS
IR spectra become complicated because of
Weak overtone
Combination
Difference band
Any type of physical vibration cause overtone.
Why IR band is broad
The reason behind this is that infrared spectrum is rotational
coupling
Weak bond vibration at low f
Strong bond vibration at high f
Hybridization effect SP>SP²>SP³
Resonance effect. Infrared absorption at low frequency
As ring size decrease absorption frequency increase because it
remove the p character
IR spectrometer
The instrument that determine the absorption spectrum for a
compound
Dispersive
Fourier transform
FT IR Spectrometer is faster than Dispersive instrument
Dispersive IR spectrometer
Beam of IR produce from hot wire.
Then decided two beams of equal intensity using mirrors. Sample
placed in one beam other beam as reference beam. Then passed
through monochromator.which disperses into a continuous
spectrum. Monochromator has beam chopper that pass beam to a
diffraction grating. It varies the frequencies of radiation reaching
the thermocouple detector. The detector sence the ratio between
the intensities of the reference and sample beam.Dispersive
instrument record a spectrum in the frequency domain.
Preparation of sample
Sample placed in cell. Cells made up of ionic substance. Sodium
chloride plates mostly used due to low cast. Pottasium bromide
plates are expensive.
For liquid Drop of liquid OC is placed on plates, these plates
squeezed gently a thin liquid film forms between them. The
spectrum obtained is neat spectrum because no solvent used..
Organic compound must be free of water
For solid
Make pellets with pottasium bromide
Or Nujol mull. Grinding the compound with mineral oil.
Disadvantage is that mineral oil bands present in analyzing
compound.
Because each functional group absorb specific radiation. We can
determine easily which functional group are present in given
compound.
For understanding that we need to remember all these values
given in table.
Some key points keep in mind
IR sort start from 4000-400cm
Different functional groups are Aklane, Alkene, Alkyne, Alchol,
Carboxlic acid, Aldehyde, Ketone, Amines, Amide, Imines, Oxime,
Nitriles, Sulfoxide, Alleged, Ketenes, Isocyantes Aryl Halide
Ester, Ether, and acid anhydried.
IR spectra obtained for
different groups .
Alkane
C-C not useful
C-H 3000-2840 CH2 1465 CH3 1375 CH2 more than 4
720
Alkenes
Alkyne
Alcohol
Aldehyde
Ketone
Carboxlic acid
Ether
Ester
Acid Halide
Amines
Amide
From the following given spectra we see that
If peaks above 3000 it's may be Alkene , Alkyne, Alchol, Anime,
Amide,, carboxlic acid.
If it's below 3000 it may be Alkane, Aldehyde
If it's below 2500 it may be Thiols, Phosphine, Nitriles, Alkyne
Ether don't have O-H peak
Carbonyl group detection
Carbonyl group peaks present between 1675-1810
Amide 1675 Carboxlic acid 1710 Ketone 1715
Aldehyde 1725 Ester 1735
Acid chloride 1800 Anhydride have two peaks At 1760 and
1810
Why Anhydride have two
peaks?
Now we are moving to solve some
spectra
Remember peak values is always
important but it's not necessary to
see all peaks.
What you understand from this
given spectra
Is it Alkane, Alkene, Ether Aldehyde
, or carboxlic acid or amines?
We absorbed three peaks
One is below 3000
Other two are below 1500
Now recall the values
It's not Carboxlic acid, Aldehyde or ketone because carbonyl
peak is absent.
It's also not Alkene or Alkyne. Nitriles peak is also absent
So it's spectrum of Alkane
Is it
Aldehyde, Ketone, Alken,
Alkane, Alchole, Nitriles Ester
or Ether
Peaks shown are at below 3000
Below 1500
Above 1000
Alkenes Alkynes peaks absent
Carbonyl group peakis also absent
Ester peak is also absent
Nitriles peak is also absent
So the given compound is ethers
What you say about this spectra. Is it Ketone, Ether, Amide,
Nitriles acid Anhydried, or Sulphide .
Best of luck................
Thank you
Email: mehakfatima927@yahoo.com
For Questions email us

IR Spectroscopy.pptx

  • 1.
  • 2.
    Definitio n Infrared Spectroscopy isthe analysis of infrared light interacting with a molecule. This can be analyzed in three ways by measuring absorption, emission and reflection.
  • 3.
    Main concern It's main functionfor the determination of Functional group. It give structural information. Wavenumber. It is the number of waves per unit distance. Typically, it is measured using cm-1 and is given by- ν ¯ = 1/ λ
  • 4.
    Which molecules show response to IR Thathave dipole movement That are Asymmetric No response from symmetric. Every bond have different IR spectrum
  • 5.
    Modes of vibrational motion Bending lowf • Scissoring Relative High f • Wagging low f • Rocking low f • Twisting low f Stretching high f Symmetric and asymmetric
  • 6.
    Bending vibration A changein the angle occurring between two bonds is known as a bending vibration. Stretching vibration When there is a continuous change in the interatomic distance along the axis of the bond between two atoms,
  • 7.
    In symmetric stretching,two or more bonds vibrate in and out together. In asymmetric stretching, some bonds are getting shorter at the same time as others are getting longer When there is a continuous change in the interatomic distance along the axis of the bond between two atoms, this process is known as a stretching vibration. A change in the angle occurring between two bonds is known as a bending vibration. Four bending vibrations exist namely, wagging, twisting, rocking and scissoring.
  • 9.
    Combination band andDifference bands When two vibrational frequencies in a molecules couple to give rise to a vibration of a new frequency within the molecule and when such a vibration is IR active.. Not all possible combination occurs. When fundamental vibration couple with overtone or combination band is called Fermi resonance. • The observed frequency is from the difference between the two interacting bands • It's similar to combination band
  • 11.
    IR SPECTRA COMPLICATIONS IRspectra become complicated because of Weak overtone Combination Difference band Any type of physical vibration cause overtone.
  • 12.
    Why IR bandis broad The reason behind this is that infrared spectrum is rotational coupling Weak bond vibration at low f Strong bond vibration at high f Hybridization effect SP>SP²>SP³ Resonance effect. Infrared absorption at low frequency As ring size decrease absorption frequency increase because it remove the p character
  • 13.
    IR spectrometer The instrumentthat determine the absorption spectrum for a compound Dispersive Fourier transform FT IR Spectrometer is faster than Dispersive instrument
  • 14.
    Dispersive IR spectrometer Beamof IR produce from hot wire. Then decided two beams of equal intensity using mirrors. Sample placed in one beam other beam as reference beam. Then passed through monochromator.which disperses into a continuous spectrum. Monochromator has beam chopper that pass beam to a diffraction grating. It varies the frequencies of radiation reaching the thermocouple detector. The detector sence the ratio between the intensities of the reference and sample beam.Dispersive instrument record a spectrum in the frequency domain.
  • 15.
    Preparation of sample Sampleplaced in cell. Cells made up of ionic substance. Sodium chloride plates mostly used due to low cast. Pottasium bromide plates are expensive. For liquid Drop of liquid OC is placed on plates, these plates squeezed gently a thin liquid film forms between them. The spectrum obtained is neat spectrum because no solvent used.. Organic compound must be free of water
  • 16.
    For solid Make pelletswith pottasium bromide Or Nujol mull. Grinding the compound with mineral oil. Disadvantage is that mineral oil bands present in analyzing compound.
  • 17.
    Because each functionalgroup absorb specific radiation. We can determine easily which functional group are present in given compound. For understanding that we need to remember all these values given in table.
  • 19.
    Some key pointskeep in mind IR sort start from 4000-400cm Different functional groups are Aklane, Alkene, Alkyne, Alchol, Carboxlic acid, Aldehyde, Ketone, Amines, Amide, Imines, Oxime, Nitriles, Sulfoxide, Alleged, Ketenes, Isocyantes Aryl Halide Ester, Ether, and acid anhydried. IR spectra obtained for different groups .
  • 20.
    Alkane C-C not useful C-H3000-2840 CH2 1465 CH3 1375 CH2 more than 4 720
  • 22.
  • 23.
  • 24.
  • 25.
  • 26.
  • 27.
  • 28.
  • 29.
  • 30.
  • 31.
  • 32.
  • 33.
    From the followinggiven spectra we see that If peaks above 3000 it's may be Alkene , Alkyne, Alchol, Anime, Amide,, carboxlic acid. If it's below 3000 it may be Alkane, Aldehyde If it's below 2500 it may be Thiols, Phosphine, Nitriles, Alkyne Ether don't have O-H peak
  • 34.
    Carbonyl group detection Carbonylgroup peaks present between 1675-1810 Amide 1675 Carboxlic acid 1710 Ketone 1715 Aldehyde 1725 Ester 1735 Acid chloride 1800 Anhydride have two peaks At 1760 and 1810 Why Anhydride have two peaks?
  • 35.
    Now we aremoving to solve some spectra Remember peak values is always important but it's not necessary to see all peaks.
  • 37.
    What you understandfrom this given spectra Is it Alkane, Alkene, Ether Aldehyde , or carboxlic acid or amines?
  • 39.
    We absorbed threepeaks One is below 3000 Other two are below 1500 Now recall the values It's not Carboxlic acid, Aldehyde or ketone because carbonyl peak is absent. It's also not Alkene or Alkyne. Nitriles peak is also absent So it's spectrum of Alkane
  • 41.
    Is it Aldehyde, Ketone,Alken, Alkane, Alchole, Nitriles Ester or Ether
  • 43.
    Peaks shown areat below 3000 Below 1500 Above 1000 Alkenes Alkynes peaks absent Carbonyl group peakis also absent Ester peak is also absent Nitriles peak is also absent So the given compound is ethers
  • 45.
    What you sayabout this spectra. Is it Ketone, Ether, Amide, Nitriles acid Anhydried, or Sulphide .
  • 46.
  • 47.
  • 48.