This document discusses initial public offerings (IPOs) and the phenomenon of IPO underpricing. It provides three key points:
1) IPOs are commonly underpriced, meaning the first day closing stock price is higher than the offer price, with underpricing seen globally. Underpricing benefits initial shareholders and underwriters.
2) Theoretical explanations for underpricing include signaling quality to attract future financing, compensating underwriters for information, and avoiding adverse selection by attracting uninformed investors.
3) The Rock model shows that rationing favors informed over uninformed investors for underpriced IPOs, so underpricing is needed to keep uninformed investors participating in the market.
The document discusses the proposed merger between Hewlett-Packard (HP) and Compaq. It provides market share data for HP and Compaq in various product segments like servers, PCs, and laptops to show the combined company would have leadership in most areas. Both supporters and opponents of the merger are mentioned. Supporters argue it will create synergies and cost savings, while opponents believe there are limited technology benefits and increased risk. The valuation process included comparing stock price performance and multiples, as well as analyzing premiums paid in similar tech mergers.
International portfolio investments differ from domestic investments in that they face uneven economic growth across countries, high exchange rate risk due to currency fluctuations, and high political risk from instability in foreign markets. They also lack effective regulations and legal protections compared to domestic markets. Investing internationally provides good diversification benefits by reducing overall portfolio risk through investing in a larger number of securities across different economies and markets. However, international investments also carry additional risks from changes in currency rates, political and social events in foreign countries, lower liquidity, and less information availability than domestic markets.
Global Telecom Industry Overview - 2023 Vishal Sharma
The document provides an overview of the global telecom industry in 2023, including:
- Challenges like geopolitical tensions, inflation, and economic uncertainty.
- The industry is recovering from stagnation through vertical plays like data centers and horizontal plays like utilities. Organic growth strategies include 5G, IoT, and edge computing.
- In Australia, the industry follows a four pillar model of Telstra, Optus, TPG, and NBN. Key players are decentralizing assets and spending is shifting to cloud, software, and digital transformation to enable new services and revenue streams in areas like IT.
This document discusses capital budgeting and capital expenditure. It defines capital budgeting as long-term planning for capital outlays whose returns will be realized in future periods. Capital expenditure involves acquiring or improving fixed assets that provide benefits over many years. The document outlines the objectives, importance, difficulties and process of capital budgeting. It also discusses factors influencing investment decisions and different types of capital budgeting decisions.
Nvidia is a leading designer of graphics processing units (GPUs) and was a pioneer in the development of GPU technology. It was founded in 1993 by three computer industry veterans to focus on visual computing. Nvidia developed its first graphics chip with the help of ST Microelectronics and rose to the top of the graphics industry through aggressive product development and execution. Today Nvidia owns intellectual property from companies it acquired and has partnerships with major technology companies to supply GPUs.
The document discusses various methods of financing for businesses. It describes capital structure as the combination of debt and equity used to finance a company's assets. It then discusses three main methods of financing - equity financing, debt financing, and lease financing. Equity financing involves selling ownership stakes, debt financing involves taking loans that must be repaid with interest, and lease financing allows using assets without ownership through rental agreements.
The document discusses risk and return in investments. It defines key concepts such as realized and expected return, ex-ante and ex-post returns, sources and measurements of risk including standard deviation and coefficient of variation. It also discusses the risk-return tradeoff and how higher risk investments require higher potential returns to compensate for additional risk.
Valuation methods used in mergers & acquisitionsRS P
The document discusses various valuation methods used in mergers and acquisitions, including:
1) Asset-based valuation which values a company based on the book value of its assets and liabilities.
2) Earnings-based valuation which values a company based on capitalizing its earnings or using its price-earnings ratio.
3) Discounted cash flow valuation which values a company based on the present value of its future free cash flows.
The document recommends using multiple valuation methods and averaging the results to determine a company's fair value for an acquisition.
The document discusses the cost of capital, which is the rate of return a firm must earn on its investments to maintain its market value and attract funds. It defines the key components that make up the cost of capital, including the cost of long-term debt, preferred stock, common stock equity, and retained earnings. It also discusses how to calculate the weighted average cost of capital (WACC) by weighting the cost of each capital component by its proportion in the firm's target capital structure. The document provides examples to demonstrate how to calculate the various costs and the WACC.
Silverwood Capital Fund I LLC formed to take advantage of a narrow niche in the mortgage note industry. The Company will seek to acquire, workout, and manage nonperforming real estate notes secured by residential 1-4 unit properties. While the primary emphasis will be focusing on nonperforming junior and Home Equity Line Of Credit (“HELOC”) notes, we will purchase select senior liens and REOs.
Using our network of banking and equity fund contacts, and advanced marketing techniques, the Fund will purchase mortgages and real estate at significant discounts to its underlying value. By focusing on distressed mortgages and properties, we know the potential for above average returns exist.
These securities are being offered under an exemption provided by SEC Regulation D Rule 506(c). Only accredited investors who meet the SEC Regulation D 501 “accredited investor” accreditation standards and who provide suitable verification of accredited status may invest into this Offering.
• Any historical performance data represents past performance. Past performance does not guarantee future results;
• Current performance may be different than the performance data presented;
• The Company is not required by law to follow any standard methodology when calculating and representing performance data;
• The performance of the Company may not be directly comparable to the performance of other private or registered funds or companies;
• The securities are being offered in reliance on an exemption from the registration requirements, and therefore are not required to comply with certain specific disclosure requirements;
• The Securities and Exchange Commission has not passed upon the merits of or approved the securities, the terms of the offering, or the accuracy of the materials.
This document provides an overview of key concepts from Chapter 1 of the textbook "Accounting Information Systems" by James A. Hall. It defines accounting and management information systems, transactions, and the general model for information systems, which includes data collection, processing, management and information generation. It also describes the organizational structure of businesses and functional areas like finance, accounting and IT. Finally, it discusses the importance of accounting independence for reliable information.
This document discusses various types of free cash flow metrics used to evaluate a company's financial performance and flexibility. It defines free cash flow, free cash flow per share, free cash flow to equity, free cash flow yield, free cash flow to sales, and unlevered free cash flow. Formulas are provided for calculating each metric.
UBS Investment Banking Challenge - Campus Final Pitch Book 2018 Oscar Haman
Case study competition on the past M&A transaction between Tatts Group Ltd and Tabcorp
Completing this case involved:
- Advising Tatts on how to proceed against the Tabcorp offer
- Creating a competitive bidding environment to force Tabcorp to raise their offers
- Market analysis of the gambling sector
- Valuation of Tatts through a DCF
- Constructing a merger model between Tatts and Tabcorp
- Devising various defence strategies against unfavourable takeover proposals
- Write-up of an ASX notice to Tatts' shareholders
- Creation of a decision tree to guide Tatts throughout this defence
The Markowitz model generates an efficient frontier of optimal portfolios that maximize return for a given level of risk. The Capital Asset Pricing Model (CAPM) builds on this by deriving the security market line (SML) which plots the expected return of individual securities based on their beta coefficient in relation to the market portfolio. The capital market line (CML) extends the efficient frontier by including a risk-free asset, demonstrating how investors can optimize the trade-off between risk and return through borrowing and lending at the risk-free rate.
This document provides solutions to capital budgeting problems involving techniques like payback period, net present value (NPV), and internal rate of return (IRR). For problem E10-1, the payback periods for two projects are provided. For other problems, the cash flows for projects are input into a financial calculator to calculate NPV or IRR in order to evaluate which projects should be accepted. The solutions demonstrate how to apply these capital budgeting techniques to make investment decisions.
1. The document provides information on 10 different cases to estimate working capital requirements, including projected sales, costs, credit terms, and stock levels. Working capital needs to be estimated to understand the capital required to support operations and growth.
2. Key factors that determine working capital requirements are levels of inventory, accounts receivable, accounts payable, and timing of cash flows from operations. Working capital requirements will fluctuate over time with changes in business activities, costs, and credit terms.
3. Proper management of working capital is important for business operations and financial flexibility. Accurate estimation of working capital needs is required for budgeting, financing, and investment decisions.
The document provides financial statements and key performance indicators for a company over several quarters and fiscal years. It includes income statements, balance sheets, cash flow statements, and common financial ratios analyzed over time. Charts are presented to show trends in revenue, costs, profits, assets, liabilities, cash flows, return on assets, debt ratios and other metrics. Projections for income statements and balance sheets are also included out to several future years.
This document provides an overview of key concepts in investment analysis and portfolio management. It discusses what constitutes an investment, factors that influence required rates of return such as time value of money, inflation, and risk. It also covers measures of historical and expected rates of return, risk of expected returns using variance and standard deviation, and the three determinants of required rates of return - the real risk-free rate, expected inflation, and risk premium.
Case study: DBS's digitalization in Southeast AsiaVarun Mittal
DBS Bank launched a digital banking platform called digibank in Singapore in 2016 that has since expanded to India and Indonesia. The platform focuses on integrating banking services into customers' lifestyles and daily needs. DBS worked with EY to develop its strategy in Indonesia, focusing on differentiating digibank by addressing key pain points and integrating banking seamlessly into customers' digital lives. DBS aims to offer banking services beyond transactions and become embedded in customers' experiences through integrated digital ecosystems.
Growth is a critical success factor for any business. Growth of a business can be measured in terms of growth in revenue, profits, asset base or any other important item. However, too rapid growth can be a strain on the entity’s resources and too slow growth can depict lack of competitiveness and issues in survival. Copy the link given below and paste it in new browser window to get more information on Sustainable Growth Rate:- http://www.transtutors.com/homework-help/corporate-finance/financial-planning-models/pro-forma-statements/external-financing-growth/sustainable-growth-rate/
1) The chapter discusses portfolio risk and return, and how diversification can reduce risk without lowering expected returns. It also covers calculating expected portfolio returns and standard deviation.
2) The Capital Asset Pricing Model (CAPM) measures systematic risk using beta coefficients. Systematic risk cannot be diversified away, whereas unsystematic risk can be through diversification.
3) CAPM predicts that investors will require a higher expected return for investments with higher betas or systematic risk. This relationship is depicted by the security market line.
Ratio analysis involves calculating and comparing various financial ratios to evaluate a company's profitability, liquidity, asset use efficiency, and financial stability. Key ratios include return on investment, return on equity, debt-to-equity, and current ratio. Calculating ratios from multiple periods or against industry benchmarks provides insights into a company's performance over time and relative to its peers.
Managerial Finance. "Risk and Return". Types of risk. Required return. Correlation. Diversification. Beta coefficient. Risk of a portfolio. Capital Asset Pricing Model. Security Market Line.
Valuation of merger & acquasition in indiaanjaligupta29
The document provides a comprehensive study on mergers and acquisitions in the Indian corporate sector. It discusses key deals in various sectors between 2007-2009 and analyzes the financial performance and synergies achieved by the acquiring companies. The research methodology involves ratio analysis and t-tests to test hypotheses about changes in liquidity, solvency, profitability and other metrics after various acquisitions. Key findings include improvements in liquidity, solvency and returns for most acquisitions, but some deals showed no significant changes or needed improvements in specific areas. Suggestions focus on cost reduction and inventory management.
The last decade has been a challenge for many investors, especially those investing for the long term and retirement. Given declines in global stock markets, many investors have seen little to no real growth in their portfolios over this period. This Wealth Guide explains why investors’ portfolios may underperform in both bear and bull markets and incur substantial costs in the process. It also details the impact this chronic underperformance can have on achieving long-term financial goals.
For more free wealth management guides on portfolio performance and for expert consultation, visit SolidRockWealth.com.
The three-factor model developed by Fama and French provides a framework for investment strategies that identifies sources of risk that compensate investors. It explains stock returns better than the single-factor CAPM model by including factors for firm size and book-to-market ratio in addition to market beta. While book-to-market ratio may not seem to directly describe risk, it serves as a proxy for a company's financial distress - high book-to-market stocks tend to be more risky with higher expected returns. The three-factor model allows advisors to construct portfolios targeting different risk exposures from size and value factors to outperform the market over the long run.
- The document discusses how concentration of the largest stocks in the US stock market is not a new phenomenon, and has occurred periodically throughout history.
- In 1967, IBM represented a larger portion of the market than Apple does today. And in the past, the top 10 stocks have accounted for over 20% of the market.
- Certain companies like AT&T, General Motors, and IBM were consistently among the largest stocks for multiple decades in the 20th century, demonstrating the market's tendency to concentrate in a few large firms.
- While the specific companies may change over time, technological innovation and cutting-edge firms often dominate the market.
Stanford CS 007-10 (2020): Personal Finance for Engineers / Additional Topics...Adam Nash
These are the slides from the 10th session of the Stanford University class, CS 007 "Personal Finance for Engineers" offered in November 2020. This seminar covers student requested additional topics for the course, including bitcoin / cryptocurrency, derivatives, futures, options, private equity & venture capital.
This document discusses how most people try unsuccessfully to beat the market through guessing, impulse, tips, media influence, unreliable past returns, and emotions. It advocates indexing, portfolio engineering based on dimensions of expected returns identified in academic research like firm size, price/book ratio, and profitability. Portfolios can be structured along these dimensions to potentially improve risk-adjusted returns over long periods.
Stanford CS 007-10 (2021): Personal Finance for Engineers / Additional Topics...Adam Nash
These are the slides from the 10th session of the Stanford University class, CS 007 "Personal Finance for Engineers" offered on December 7, 2021. This seminar covers student requested additional topics for the course, including bitcoin / cryptocurrency, derivatives, futures, options, private equity & venture capital.
This document summarizes a study examining IPO underpricing explanations using data from the Stock Exchange of Singapore. The key points are:
1) The study analyzes both application and allocation data from IPOs in Singapore, which allows reconstruction of underlying investor demand schedules.
2) They find large investors preferentially request shares in IPOs with higher initial returns, consistent with them having better information.
3) Inferences differ substantially between looking at just applications versus allocations, since allocations may not reflect true underlying demand due to rationing practices.
Stanford CS 007-10 (2019): Personal Finance for Engineers / Additional TopicsAdam Nash
These are the slides from the 10th session of the Stanford University class, CS 007 "Personal Finance for Engineers" offered in December 2019. This seminar covers student requested additional topics for the course, including bitcoin / cryptocurrency, derivatives, futures, options, private equity & venture capital.
Sotheby's Institute Week 5 Whitaker 20111005Amy Whitaker
The document provides an agenda and overview for an introduction to finance course. It includes:
- A brief history of markets and their structure
- An introduction to the time value of money concept
- An overview of key topics to be covered like the stock market, exchanges, company lifecycles, and crises
- Housekeeping notes on optional assignments and resources for students.
Nov 1999_SG Europe Top 20 Fund Report_SGAMAlfred Park
The document analyzes valuation levels and market conditions for US and European equities. It finds several concerning factors, including that US government intervention against Microsoft signals limits on wealth concentration. Productivity growth may be slower than assumed. Current account deficits and falling US savings are at unprecedented levels. European telecom stocks seem fully valued. Overall it recommends a tactically underinvested position in equities given uncertainties around factors currently propping up prices like strong dollar and corporate earnings growth. It models fair valuation based on return on capital, cost of capital, and growth assumptions.
The document summarizes a student's experience playing a stock market game, including key details such as dates played, ending balance, and penalties. It notes the student ended the game with $4,177.07 after penalties. The student is required to write an 8-page paper reflecting on their personal experience and lessons learned from playing the stock market simulation.
Smart option for planning for retirement, now at bealelee.comDavid Lee
The document discusses various strategies for protecting and growing wealth using financial tools like options. It explains that options are contracts that give the buyer the right to buy or sell a specific investment at a specific price. It then outlines the three main ways the SMARToption strategy uses options: buying long-term put options for downside protection; selling short-term covered calls to generate income from owned assets; and selling short-term puts to generate income. The document provides examples of how put options and covered calls work and the potential outcomes.
Connect with Vanguard vanguard.com Executive summary. D.docxbobbywlane695641
Connect with Vanguard > vanguard.com
Executive summary. Diversification is a common objective for global
investors. But even though there is general agreement on the importance
of exposure to a variety of asset classes (dependent, of course, on
investor-specific factors), there is less agreement on the role of foreign
securities in a domestic portfolio. Investors display a persistent and
significant home bias, regardless of domicile, which often conflicts with
the tenets of broad global diversification. It is interesting that this bias is
often conscious and intentional, with investors actively overweighting
domestic holdings at the expense of foreign securities.
This paper asks the question, “In a world in which a portfolio’s
diversification benefits from broad allocations to global securities, how
much home bias is reasonable?” We explore home bias in four developed
markets: the United States, the United Kingdom, Australia, and Canada.1
To address our governing question, we outline a decision framework that
Vanguard research June 2012
Note: We thank James D. Martielli in Vanguard’s Portfolio Review Department for insight and perspective with the initial framework
and articulation of this research. We also thank Daniel Piquet for assistance with data and analysis.
1 We selected these countries primarily because they represent nations where Vanguard has established domestic operations.
The role of home bias in global
asset allocation decisions
Authors
Christopher B. Philips, CFA
Francis M. Kinniry Jr., CFA
Scott J. Donaldson,
CFA, CFP®
http://www.vanguard.com
2
2 See notes to Figure 2 for the source of these allocations. Also, Figure 1’s analysis begins with 1988 to coincide with the inception of the MSCI All Country
World Index. Although our evaluation period covers 24 years, the results are still dependent on the particular period selected. Alternative starting and
ending dates can alter the outcome in favor of either foreign or domestic investment, depending on the market environment over the selected period. For
example, while Figure 1 shows the minimum-variance portfolio for U.S. equities at an allocation of 80% U.S./20% foreign, similar research by Philips (2012)
showed that since 1970, the minimum variance allocation between U.S. and foreign stocks has been 70% domestic/30% foreign.
It’s also important to note that when including additional asset classes, the assumed returns, variances, and covariances among the assets can lead to
allocation decisions that may differ from those based on a single asset-class analysis such as that in Figure 1. For example, in Philips (2012), variance for a
60% U.S. stock/40% U.S. bond portfolio would have been minimized by adding 40% foreign stocks to the equity allocation.
considers both quantitative and qualitative criteria. Based on these criteria,
we conclude that, in general, U.S. investors may have some justification for
marginal home bias, but inve.
1. Common stock represents ownership in a corporation and a claim on its assets and earnings. There are different types including common, preferred, and classes A and B.
2. Owners of common stock are also known as shareholders or equity owners. They may receive dividends as determined by the board of directors and can benefit from capital gains.
3. Fundamental analysis and technical analysis are two main approaches used to evaluate common stocks and make investment decisions.
Common stock represents partial ownership in a corporation. There are two main types: common stock which usually entitles the owner to vote, and preferred stock which generally does not have voting rights but has a higher claim on assets and earnings. Common stock owners are also known as shareholders or equity owners. A board of directors is elected to establish policies and make decisions on major company issues. Companies may pay dividends to shareholders from a portion of earnings.
There are many ways a company can go public on the equities markets. Learn the difference between a traditional IPO and APO (alternative public offering) from Charms Investments.
The document provides an overview of modern portfolio theory and passive investing strategies. It discusses key concepts like diversification, indexing, minimizing costs and turnover. The main recommendations are to invest in a few low-cost index funds covering major asset classes, rebalance annually, and maintain a buy-and-hold approach to achieve market-level returns. While EMH is largely valid, the evidence on value and small cap outperformance suggests tilting portfolios somewhat toward those factors.
This chapter discusses investing in stocks and the stock market. It covers topics such as how stocks are traded on exchanges and over-the-counter markets, methods for valuing stocks like the dividend discount and Gordon growth models, how the market sets stock prices, sources of error in valuations, important stock market indexes, investing in foreign stocks, and regulation of the stock market by the SEC.
The document is a master's thesis that examines cross-listings in emerging and frontier countries. It contains 5 chapters: 1) Introduction, 2) Literature Review, 3) Methodology, 4) Findings, and 5) Conclusions. The Introduction defines cross-listing and identifies key drivers. It also classifies different types of cross-listings. The Literature Review introduces several theories on cross-listings and identifies the dependent variable of cumulative abnormal returns. It predicts the direction of impact for each theory. The Methodology chapter outlines the models, controls, and data sources used.
This document discusses a study analyzing the historical fair value of foreign exchange (FX) options. It examines daily option premium and payout data for various currency pairs and tenors going back to 1995. The study finds that short-dated FX options tend to be overpriced, while long-dated options offer better value. It presents analysis showing the premium, forward point contribution, and actual spot contribution to returns for carry trades. The document also discusses how to calculate option values using Black-Scholes and the costs to include, and considers what results might indicate options are fairly or unfairly priced.
Similar to IPO underpricing slides 2020-2021 U30273_ec20e3bfc8834efc94d88a7e38326b9b.pptx (20)
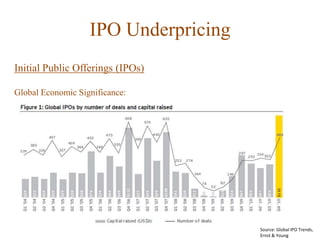
This document summarizes a research paper that analyzes the resilience of ESG, sharia compliant, and sin stocks during the COVID-19 pandemic and 2007-08 financial crisis. It begins with an introduction that outlines the research questions, objectives and significance. The introduction discusses how previous literature has found these types of stocks to exhibit lower volatility, higher resilience and abnormal returns during economic downturns. Subsequent chapters will analyze the resilience, return volatility and abnormal returns of these stock types specifically after the two crises.
Value slides 2022_430102343b4e7f831172c529b654a6ed.pptxHafizArslan19
This document summarizes research on the value premium - the tendency for stocks with value characteristics like low price-to-book ratios to outperform growth stocks over the long run. It discusses several potential explanations for the value premium proposed in academic literature, including that investors extrapolate past growth too far into the future for growth stocks and are surprised by mean reversion for value stocks. The document also reviews evidence that investors predict near-term earnings accurately but overestimate longer-term growth, and that value stocks experience positive earnings surprises while growth stocks see negative surprises.
1) Behavioural economics concepts like heuristics, biases, and self-control problems often lead to suboptimal financial decisions related to saving for retirement.
2) Nudge theory proposes using "choice architecture" and defaults to influence behavior in a way that maintains freedom of choice. This has been applied to retirement savings through automatic enrollment and programs like Save More Tomorrow.
3) The UK Pensions Act of 2008 and the US Pension Protection Act introduced automatic enrollment and escalating contribution programs based on these behavioral insights to try and increase retirement savings rates.
- Several studies have found that IPO firms in the US generally underperform the market in the years following their IPO. However, other research suggests this underperformance may be explained by risk factors or issues with performance measurement.
- Evidence for Europe is mixed, with some studies finding no underperformance for certain markets or time periods. However, IPOs that occur during "hot markets" have been found to perform poorly long-term.
- Earnings management prior to the IPO and excessive investor optimism have been proposed as behavioral explanations for long-run IPO underperformance.
1) A study from 1993 found that strategies that bought stocks that performed well in the past 3-12 months and sold stocks that performed poorly generated positive returns over 3-12 month holding periods.
2) Further research confirmed the momentum effect held out of sample and in other markets, though not in Japan. Several potential explanations for the momentum effect were explored, including differences in stock drift rates and tax-related selling, but none fully explained it.
3) Behavioral factors like conservatism bias, overconfidence, and representativeness bias were also found to potentially contribute to the momentum effect by causing underreaction or overreaction to information among investors.
- The equity premium puzzle refers to the historically large difference between average returns on stocks versus short-term bonds, which standard economic models cannot fully explain.
- Mehra and Prescott found the average equity premium from 1889-1978 was 6% annually, much higher than models predicted.
- Benartzi and Thaler proposed that investors evaluate returns over short periods (myopic loss aversion) rather than long-term, which helps explain the high equity premium demanded for stocks.
Discover timeless style with the 2022 Vintage Roman Numerals Men's Ring. Crafted from premium stainless steel, this 6mm wide ring embodies elegance and durability. Perfect as a gift, it seamlessly blends classic Roman numeral detailing with modern sophistication, making it an ideal accessory for any occasion.
https://rb.gy/usj1a2
Part 2 Deep Dive: Navigating the 2024 Slowdownjeffkluth1
Introduction
The global retail industry has weathered numerous storms, with the financial crisis of 2008 serving as a poignant reminder of the sector's resilience and adaptability. However, as we navigate the complex landscape of 2024, retailers face a unique set of challenges that demand innovative strategies and a fundamental shift in mindset. This white paper contrasts the impact of the 2008 recession on the retail sector with the current headwinds retailers are grappling with, while offering a comprehensive roadmap for success in this new paradigm.
During the budget session of 2024-25, the finance minister, Nirmala Sitharaman, introduced the “solar Rooftop scheme,” also known as “PM Surya Ghar Muft Bijli Yojana.” It is a subsidy offered to those who wish to put up solar panels in their homes using domestic power systems. Additionally, adopting photovoltaic technology at home allows you to lower your monthly electricity expenses. Today in this blog we will talk all about what is the PM Surya Ghar Muft Bijli Yojana. How does it work? Who is eligible for this yojana and all the other things related to this scheme?
Ellen Burstyn: From Detroit Dreamer to Hollywood Legend | CIO Women MagazineCIOWomenMagazine
In this article, we will dive into the extraordinary life of Ellen Burstyn, where the curtains rise on a story that's far more attractive than any script.
The Most Inspiring Entrepreneurs to Follow in 2024.pdfthesiliconleaders
In a world where the potential of youth innovation remains vastly untouched, there emerges a guiding light in the form of Norm Goldstein, the Founder and CEO of EduNetwork Partners. His dedication to this cause has earned him recognition as a Congressional Leadership Award recipient.
Cover Story - China's Investment Leader - Dr. Alyce SUmsthrill
In World Expo 2010 Shanghai – the most visited Expo in the World History
https://www.britannica.com/event/Expo-Shanghai-2010
China’s official organizer of the Expo, CCPIT (China Council for the Promotion of International Trade https://en.ccpit.org/) has chosen Dr. Alyce Su as the Cover Person with Cover Story, in the Expo’s official magazine distributed throughout the Expo, showcasing China’s New Generation of Leaders to the World.
AI Transformation Playbook: Thinking AI-First for Your BusinessArijit Dutta
I dive into how businesses can stay competitive by integrating AI into their core processes. From identifying the right approach to building collaborative teams and recognizing common pitfalls, this guide has got you covered. AI transformation is a journey, and this playbook is here to help you navigate it successfully.
Satta matka fixx jodi panna all market dpboss matka guessing fixx panna jodi kalyan and all market game liss cover now 420 matka office mumbai maharashtra india fixx jodi panna
Call me 9040963354
WhatsApp 9040963354
Starting a business is like embarking on an unpredictable adventure. It’s a journey filled with highs and lows, victories and defeats. But what if I told you that those setbacks and failures could be the very stepping stones that lead you to fortune? Let’s explore how resilience, adaptability, and strategic thinking can transform adversity into opportunity.
Prescriptive analytics BA4206 Anna University PPTFreelance
Business analysis - Prescriptive analytics Introduction to Prescriptive analytics
Prescriptive Modeling
Non Linear Optimization
Demonstrating Business Performance Improvement
NIMA2024 | De toegevoegde waarde van DEI en ESG in campagnes | Nathalie Lam |...BBPMedia1
Nathalie zal delen hoe DEI en ESG een fundamentele rol kunnen spelen in je merkstrategie en je de juiste aansluiting kan creëren met je doelgroep. Door middel van voorbeelden en simpele handvatten toont ze hoe dit in jouw organisatie toegepast kan worden.
Storytelling is an incredibly valuable tool to share data and information. To get the most impact from stories there are a number of key ingredients. These are based on science and human nature. Using these elements in a story you can deliver information impactfully, ensure action and drive change.
Unveiling the Dynamic Personalities, Key Dates, and Horoscope Insights: Gemin...my Pandit
Explore the fascinating world of the Gemini Zodiac Sign. Discover the unique personality traits, key dates, and horoscope insights of Gemini individuals. Learn how their sociable, communicative nature and boundless curiosity make them the dynamic explorers of the zodiac. Dive into the duality of the Gemini sign and understand their intellectual and adventurous spirit.
SATTA MATKA DPBOSS KALYAN MATKA RESULTS KALYAN CHART KALYAN MATKA MATKA RESULT KALYAN MATKA TIPS SATTA MATKA MATKA COM MATKA PANA JODI TODAY BATTA SATKA MATKA PATTI JODI NUMBER MATKA RESULTS MATKA CHART MATKA JODI SATTA COM INDIA SATTA MATKA MATKA TIPS MATKA WAPKA ALL MATKA RESULT LIVE ONLINE MATKA RESULT KALYAN MATKA RESULT DPBOSS MATKA 143 MAIN MATKA KALYAN MATKA RESULTS KALYAN CHART
2. Why do firms go public?
- In many cases a significant motivation is to raise fresh equity capital
- Taking a firm public offers a complete exit or diversification route for initial
owners
- Compared to a privately owned firm, a public firm is usually more visible to
investors
- Shares become considerably more liquid if they are traded in public markets
- Being a public firm means better access to capital markets and bank financing
- Being a public firms increases reputation in product markets and with suppliers
- Setting up stock and option-based compensation plans for employees becomes
easier
5. Initial Public Offerings (IPOs)
IPOs: An important exit route for the venture capital industry
Year
Total M&A
Deals
Deals with
Disclosed Values
Total Disclosed
Value
Average Value
($ mil)
Number
of IPOs
Total Offer
Amount
Average Offer
Size ($ mil)
2002 319 154 7586,7 49,3 22 2109,1 95,9
2003 284 119 7460,1 62,7 29 2022,7 69,8
2004 346 187 15919,6 85,1 94 11378 121
2005 351 166 17410,6 104,9 57 4485 78,7
2006 370 160 18693,6 116,8 57 5117,1 89,8
2007 360 160 28406,7 177,5 86 10326,3 120,1
2008 260 96 13915,4 145 6 470,2 78,4
Source: National Venture Capital Association
US Data, M&As and IPOs that involve venture capital backed entitites:
6. Initial Public Offerings (IPOs)
IPOs: An important exit route for the Venture Capital industry
Source: Bessler and Seim (2011)
European Data:
7. The costs of going public
These include direct costs such as underwriting fees and gross spread, legal and
accounting expenses. Since many of these costs are fixed, there are considerable
economies of scale. In the U.S., for example, issues raising $5 million or less incur
direct expenses of 18.2% while those raising over $100 million pay on average
6.8%.
More importantly, there is an indirect cost: initial underpricing of the shares offered.
An IPO is said to be underpriced if
(Closing price on day 1 in the stock market − offer price)/offer price > 0
Underpricing is a global phenomenon.
8. IPO underpricing – international evidence
Country Study Sample period Sample size Initial return (%)
USA Ibbotson et. al.(1994) 1960-92 10626 15.3
USA Ritter (1987) 1977-82 664 14.8
Australia Finn and Higham (1988) 1966-78 93 29.2
Australia Lee et. al. (1994) 1976-89 266 11.9
Canada Jog and Srivastava (1996) 1971-92 254 7.4
Finland Keloharju (1993) 1984-92 91 14.4
France Jacquillat (1986) 1972-86 87 4.8
Germany Ljungqvist (1996) 1970-93 180 9.2
G. Britain Jenkinson and Mayer (1988) 1983-86 143 10.7
Italy Cherubini and Ratti (1992) 1985-91 75 29.7
Japan Jenkinson (1990) 1986-88 48 54.7
Japan Kaneko and Pettway (1994) 1989-93 37 12.0
Sweden Rydqvist (1993) 1970-91 213 39.0
Korea Dhatt et. al. (1993) 1980-90 347 78.1
Taiwan Chen (1992) 1971-90 168 45.0
Turkey Kiymaz et. al. (2000) 1990-96 163 13.1
9. IPO underpricing – international evidence (continued)
2000-2006 IPOs from Banerjee et. al (2012) – initial returns
Mean % N Mean % N
Australia 16.59 696 Ireland 10.29 25
Austria 23.76 34 Israel 23.34 42
Belgium 10.36 32 Italy 7.87 215
Brazil 18.37 46 Japan 45.14 890
Canada 39.13 784 Luxembourg 26.68 15
China 57.14 590 Malaysia 31.18 295
Denmark 13.48 27 Netherlands 20.00 44
Finland 14.61 25 New Zealand 20.66 38
France 11.30 353 Norway 4.33 45
Germany 43.13 333 Philippines 17.27 19
Greece 14.44 53 Poland 45.50 23
Hong Kong 22.21 479 Russia 8.82 10
India 25.01 9 Singapore 24.88 296
Indonesia 52.25 48 South Africa 12.94 18
10. IPO underpricing – international evidence (continued)
2000-2006 IPOs from Banerjee et. al (2012) – initial returns
Mean % N
South Korea 54.57 192
Spain 10.98 45
Sweden 21.79 73
Switzerland 14.41 39
Taiwan 17.25 260
Thailand 19.15 143
United Kingdom 23.29 840
United States 24.00 1700
All 29.11 8776
12. IPO underpricing – Netscape example
Netscape’s August 1995 IPO
- Morgan Stanley, lead underwriter
- Preliminary price range $12-14
- Offer price was adjusted upwards by Morgan Stanley after the road shows, 5 million
shares were sold at $28 per share.
- First-day closing price $58.25 - $151 million was left on the table (($58.25 – $28) x 5m)
- Marc Andreessen, a co-founder of the firm, owned 1 million shares (2.7% of the firm).
The value of his stake went from an estimated $12-14 million to roughly $58 million as
of the first day of trading.
- whereas 2.7% of the $151 million left on the table is around $4 million.
13. IPO underpricing – theoretical explanations
Signaling-based theories (Grinblatt and Hwang (1989), Allen and Faulhaber (1989),
Welch (1989)): In order to signal firm quality so that they can subsequently issue seasoned
equity at more favorable prices, rational owners intentionally underprice.
Implication: there is a positive relationship between underpricing and both the probability
of SEO and the amount of SEO. Empirical evidence: mixed.
Principal-agent models (Baron (1989)): In order to compensate underwriters for the use of
their superior information, issuers rationally let underwriters underprice in an environment
in which underwriters have superior information about demand for the new shares.
Implication: IPOs of underwriting firms should not be underpriced. Empirical evidence:
Muscarella and Vetsuypens (1989) find that these IPOs are underpriced as well.
14. IPO underpricing – theoretical explanations
Asymmetric information-based theories (Rock (1986), Benveniste and Spindt (1989),
Benveniste and Wilhelm (1990)):
Rock (1986): In order to avoid the ‘lemons’ problem of adverse selection, issuers rationally
underprice, in an informational environment in which some investors are perfectly
informed.
Implication: underpricing returns tend to the riskless rate when rationing-adjusted.
Empirical evidence: mostly supportive for countries where book-building is not used.
Benveniste and Spindt (1989), Benveniste and Wilhelm (1990)): underwriters can entice
‘informed’ investors to truthfully reveal their superior information pre-sale; underpricing
ensures incentive-compatibility.
Implication: offers for which positive information is revealed will be priced towards or
beyond the upper end of the initial price range, however, the final price will be set below
the full-information price to allow regular investors to be compensated via underpricing.
Empirical evidence: supportive in the U.S. where book-building process is prevalent.
15. IPO underpricing – The Rock (1986) model in more detail
Consider a setting where the true value of shares that are offered in an IPO are known by
some investors, i.e. “informed investors”, while others, the “uninformed investors” do not
know this true value.
Suppose that informed investors have $100 to invest, uninformed investors also have $100
to invest and 10 IPO shares are offered at $8 per share while the true value is $10 per share.
This IPO is therefore underpriced. Informed investors would ask for a $100 allocation in
total, and uniformed ones, since they are assumed to not discriminate between IPOs, also
ask for $100 worth of shares. Hence, IPO shares would have to be rationed in this case as
there is only $80 worth of supply but $200 worth of demand in total for these shares.
With a pro rata allocation, informed investors would get $40 worth of shares, so 5 shares at
$8 per share and uninformed investors would also get 5 shares at that price. At the end of
the first day of trading when price goes up to $10 per share, each class of investor would
therefore attain a profit of $10 in total ($2 dollars per share * 5 shares).
16. IPO underpricing – The Rock (1986) model in more detail (continued)
Now consider what happens when an IPO is overpriced. The critical assumption is that
uninformed investors do not condition their demand for IPO shares on whether the shares
are underpriced or overpriced, they submit indications of interest regardless. Informed
ones, on the other hand, shy away from overpriced shares.
Suppose as before that informed investors have $100 to invest, uninformed investors also
have $100 to invest and 10 IPO shares are offered at $12.50 per share while the true value
is $10 per share.
This IPO is therefore overpriced. Informed investors would not ask for any allocation, they
would simply walk away from the deal. Uninformed investors however, ask for $100 worth
of shares as before. Now, there is no rationing, the seller would be able to sell only 8 shares
and these all would go to the uninformed investors.
At the end of the first day of trading, the shares would be worth $10 each and uniformed
investors would lose in total $2.50 * 8 = 20 dollars.
17. IPO underpricing – The Rock (1986) model in more detail (continued)
So how should we think about IPO pricing on average in equilibrium in such a setting? The
crucial point is when IPOs are underpriced, uninformed investors are crowded out by
informed investors while when IPOs are overpriced, they get full allocations since
informed investors show no interest in shares they know are overpriced.
Note that if underpricing and overpricing happened with 50-50 probability and in equal
dollar amounts (e.g. in our first example the IPO was underpriced by 20 dollars in total (10
shares * $2) and in the second example it was overpriced by 20 dollars (8 shares * 2.50)),
uninformed investors would lose money on average.
If the underwriter wants to keep uninformed investors in the game, it will need to produce
underpricing in equilibrium, in which, uniformed investors would just break even and
informed investors would of course be consistently profitable.
Because of the disadvantageous asymmetry in allocation that uninformed investors face
that we just illustrated, the only way they could break even in equilibrium would be if IPO
shares on average were underpriced.
18. IPO underpricing – theoretical explanations
Behavioural theories
Loughran and Ritter (2002): If an IPO is underpriced, pre-issue stockholders are worse off
because their wealth has been diluted. If an entrepreneur receives the good news that he or
she is suddenly unexpectedly wealthy because of a higher than expected IPO price, the
entrepreneur doesn't bargain as hard for an even higher offer price. This is because the
person integrates the good news of a wealth increase with the bad news of excessive
dilution. The individual is better off on net. Underwriters take advantage of this mental
accounting and severely underprice these deals. It is these IPOs where the offer price has
been raised (a little) that leave a lot of money on the table when the market price when
trading starts goes up a lot.
19. Loughran and Ritter
(2002): “Prospect
theory argues that
when an individual is
faced with two
related outcomes, the
individual can either
treat them separately
or as one.” The case of
Netscape
20. IPO underpricing – the partial adjustment phenomenon
Hanley (1993) and Loughran and Ritter (2002) observe that there is a positive correlation
between the money left on the table and the adjustments made by the underwriter to the
expected offer price. They also note that a minority of offerings is responsible for most of
the average underpricing. This is reflected in the median underpricing being in most cases
much smaller than the mean underpricing in the Benarjee samples, for example:
Mean % Median % N
Australia 16.59 5.08 696
Italy 7.87 0.85 215
Japan 45.14 20.71 890
Canada 39.13 6.02 784
Malaysia 31.18 14.21 295
Netherlands 20.00 4.94 44
Germany 43.13 15.65 333
Poland 45.50 16.81 23
Hong Kong 22.21 5.26 479
Singapore 24.88 9.47 296
Indonesia 52.25 23.11 48
United Kingdom 23.29 9.21 840
United States 24.00 5.00 1700
All 29.11 8.18 8776
21. IPO underpricing – the partial adjustment phenomenon
Loughran and Ritter (2002) find that the mean underpricing for an offering whose final
offer price is below the offer range as anticipated by the underwriter in earlier stages is 4%.
On the other hand, for issues that manage to sell at prices that are greater than their offer
ranges, the mean underpricing is 32%.
22. Ljungqvist, Nanda and Singh (2004) – “Sentiment” investors
Another attempt at introducing behavioural dimensions to the explanation of the IPO
underpricing phenomenon comes in the form of a multi-period model by Ljungqvist,
Nanda and Singh (2004).
Key assumption: There are sentiment investors who hold excessively optimistic beliefs
about the future prospects for the IPO company alongside rational investors.
The issuer’s objective is to maximize the excess valuation over the fundamental value of
the stock.
Flooding the market with stock will depress the price, so the optimal strategy involves
holding back stock in inventory to keep the price from falling.
23. Ljungqvist, Nanda and Singh (2004) – (continued)
Eventually, nature reveals the true value of the stock and the price reverts to fundamental
value. That is, in the long-run IPO returns are negative, consistent with the empirical
evidence.
This assumes the existence of short sale constraints, or else arbitrageurs would trade in
such a way that prices reflected fundamental value even in the short term.
The optimal mechanism involves the issuer allocating stock to ‘regular’ institutional
investors for subsequent resale to sentiment investors, at prices the regulars maintain by
restricting supply. Because the hot market can end prematurely, carrying IPO stock in
inventory is risky, so to break even in expectation regulars require the stock to be
underpriced.
24. Ljungqvist, Nanda and Singh (2004) – (continued)
Related Empirical Results:
• Ofek and Richardson (2003) show that high initial returns occur when institutions sell
IPO shares to retail investors on the first day, and that such high initial returns are followed
by sizeable reversals to the end of 2000, when the ‘dot-com bubble’ eventually burst. This
is the pattern Ljungqvist, Nanda, and Singh (2004) predict.
• Using German data on IPO trading by 5,000 retail customers of an online broker, Dorn
(2003) documents that retail investors overpay for IPOs following periods of high
underpricing in recent IPOs, and for IPOs that are in the news. Consistent with the
Ljungqvist, Nanda, and Singh (2004) model, he also shows that ‘hot’ IPOs pass from
institutional into retail hands. Over time, high initial returns are reversed as net purchases
by retail investors subside, eventually resulting in underperformance over the first six to 12
months after the IPO.
25. Methods of selling shares
• Firm-commitment offers
• Best-efforts offers
• Offers for sale
• Private placements
• Book-building with when-issued trading
• Introductions
26. Methods of selling shares
• Firm-commitment offers
Widely used in the U.S., almost all IPOs over $10 million are firm-commitment.
The process: a syndicate of investment banks led by one or two lead banks agree to market
and sell the issue at a price that is determined after the ‘book-building’ process.
Book-building involves obtaining non-binding indications of interest from large, mostly
institutional, investors, at marketing meetings known as ‘road shows’.
• Best-efforts offers
Tend to be used only by small companies in the U.S.
The process: the investment bank does not underwrite the shares but agrees to distribute them.
If a certain proportion of shares remain unsold the issue may be withdrawn. The bank usually
has 90 days to sell the minimum amount.
• Offers for sale
Widely used in the U.K. in the 1990s, especially for larger offerings, currently rarely used..
The process: the company will sell all the shares to an issuing bank who in turn arranges the
issue to be sub-underwritten. The price is determined up to ten days in advance of the
distribution. The public then sends requests for allocation to the issuing bank. Allocations are
pro-rated in the event of over-subscription
27. Methods of selling shares
• Private placements
Used in the U.K. for smaller offerings.
The process: similar to a firm-commitment offer, but large investors are invariably the
clients of private placements.
• Book-building with when issued-trading
The prevalent method by far in Germany.
The process: similar to a firm-commitment offer, but has a when-issued trading stage in
which investors begin trading soon after the underwriter posts a preliminary range for the
price at which IPO shares will be offered in the primary market. The underwriter then uses
this trading information to set the final offer price, but the offer price is never set above the
preliminary range.
• Introductions
Used in the U.K. and continental Europe.
The process: the shares, if they meet the listing requirements, are simply listed on the
exchange and trading begins even though initially no shares are sold.