
Recommended
More Related Content
What's hot
What's hot (20)
Similar to Philip j. lee 1999
Similar to Philip j. lee 1999 (20)
Recently uploaded
Recently uploaded (20)
Philip j. lee 1999
- 1. JOURNAL OF FINANCIAL AND OUANTITATIVE ANALYSIS VOU. 34. NO. 4. DECEMBER 1999 IPO Underpricing Explanations; Implications from Investor Application and Allocation Schedules Philip J. Lee, Stephen L. Taylor, and Terry S. Walter* Abstract Initial Public Offers (IPOs) made on the Stock Exchange of Singapore routinely provide sufficiently detailed data to allow rcconstniction of both the application and allocation schedules. We show that large investors tend to preferentially request participation in IPOs with higher initial returns, consistent with these investors being better informed. We also show that inferences based exclusively on application strategies are quite different from those drawn on investor allocations. Our results suggest that caution is necessary in assess- ing the relative merit of competing explanations for IPO underpricing where the underlying demand is not identified. I. Introduction Institutional practices adopted in initial public offerings (IPOs) are an impor- tant determinant of initial underpricing (Loughran, Ritier, and Rydqvist (1994)). The "book-building" approach of U.S. underwriters means that there should be a close correspondence between final applications for shares in an IPO atid the allo- cation of these shares.' Final applications, however, may differ substantially from the underlying demand for an issue, reflecting potential investors' perceptions of bias in underwriters' allocation decisions and the futility of an application for shares when not on the "favored client" list. When underlying demand is damp- ened in this way, it is not possible to observe the probability of an allocation, and theories that rely on differentially informed investors cannot be directly tested.^ * All authoni. Department of Accouming (H04), tJniversity of Sydney. NSW 2006. Australia. This paper has benefited from commenLs by panicipants at the 1996 PACAP/APFA annual meeting, as well a-s workshops at the following universities: Sydney, Adelaide. Western Australia. Macquarie, and Queensland. The authors gratefully acknowledge these comments. They also acknowledge detailed comments and suggestions received from Philip Brown. Paul Malatesta (the editor), and Wo Welch (a.>isociate editor and referee), ' Following pre selling, U,S, underwriters must set a common price for all investors (Benveniste and Wilhelm (1990)), The subsequent offers of .shares rcHect underwriters' allocation di.scretion. as well as the Information gained from pre-selling. Hence, "applications." as such, will already reflect both ihc information provided in ihe pre-selHng period and the underwriters' ability to discriminate bciween applicants, ^It is possible that investors might strategically apply for a larger number of shares than they actually want in an issue. To do so. however, involves an additional application cost, and an increa.sed 425
- 2. 426 Journal of Financial and Quantitative Analysis Indeed, the extent of differentially informed investors becomes a maintained as- sumption, rather than a subject of investigation. We examine stock issues in Singapore and show that large investors prefer- entially request partieipation in IPOs with higher initial returns, consistent with them having better information. While larger investors are commonly assumed to have an information advantage, our paper is the first to document it empirically. We also show that the winner's curse (Rock (1986)) is far more apparent in appli- cations than it is in allocations. Data for Singapore IPOs are frequently sufficient to reconstruct the demand schedule within various application sizes, as well as a schedule of how that demand is rationed (i.e., allocation data). Thus, we can make a direct comparison of the inferences drawn from allocation data vis a vis those that derive from application data (i.e., unconstrained demand). To the extent that differences between unconstrained demand and eventual allocation patterns exist in the U.S. and elsewhere, our results also suggest that conclusions based only on allocation data need to be cautiously interpreted. Our results need to be considered in light of the prevailing institutional set- ting for Singapore IPOs. Underwriting in Singapore is cvenhanded, in contrast to the book-building approach adopted in the U.S. All investors who apply for the same number of shares in an IPO have an equal chance of success (though issuers can choose to ration requests for different numbers of shares more or less severely), because over-subscribed issues are allocated using a process of random drawing. Koh and Walter (1989) and Lee, Taylor, and Walter (1996b) confirm the winner's curse prediction for short-run underpricing, and also show that long-run returns for Singapore IPOs are consistent with efficient market expectations. The long-run secular decline in price documented in several international studies (see Loughran, Ritter, and Rydqvist (1994) and Lee, Taylor, and Walter (1996a)) is not present in Singapore. The next section highlights the role of informed investors in two widely tested explanations for IPO underpricing, as well as the key institutional arrange- ments for the Singapore IPO market. The data used in this study are described in Section III, together with the results. Application and allocation details are ana- lyzed to discover the nature of demand expansion and its relationship with IPO rationing. The conclusions are presented in the final section. 11. Background A. Prior Research Differentially informed investors play a crucial role in many explanations of IPO underpricing. For example, in Rock's (1986) winner's curse model, informed investors only request stock in issues they know to be underpriced, thereby cre- ating an adverse selection problem for issuers that leads to underpricing, on av- erage, of IPOs. In Benveniste and Spindt's (1989) information-gathering model, informed investors provide valuable demand and pricing feedback to underwrit- ers, and underpricing, on average, compensates for the value of this information, probability ihai, if the i.ssue is overpriced, ihcy will face ihe consequcnl winner's curse. More delail on ihe cost structure and institutional arrangements in Singapore IPO.s is provided in Section II.B,
- 3. Lee, Taylor, and Walter 427 as well as the cost of participating in overpriced issues. While distinguishing be- tween the role of these (and other) models requires consideration of the prevailing institutional setting, Hanley and Wilhelm (1995) also argue that the behavior of informed investors will differ in important aspects between the winner's curse and information-gathering models. Hence, Hanley and Wilhelm endeavor to "test" these competing explanations for IPO underpricing by examining outcomes for informed investors. They use confidential allocation data for a limited number of U.S. IPOs and show that institutional (i.e., informed) investors receive approxi- mately the same proportions of shares in overpriced and underpriced issues. They interpret this result as support for Benveniste and Spindt's (1989) explanation of IPO underpricing, which is premised on discriminatory behavior by U.S. un- derwriters, and reject the winner's curse explanation proposed by Rock (1986). Specifically, they show that variation in the proportion of the issue allocated to institutional investors explains a statistically insignificant (though positive) pro- portion of cross-sectional variation in initial returns. Hanley and Wilhelm interpret their evidence to imply that informed investors are forced by underwriters to take shares in overpriced issues. It is also plausible that informed investors take more reliably overpriced issues because of unob- servable "scaling back" via the pre-selling process or a bias in rationing relative to uninformed investors. More generally, it is even possible that results such as those reported by Hanley and Wilhelm may simpiy reflect an absence of supe- rior information among institutional investors, so that they cannot be expected to discriminate between overpriced and underpriced issues. Another possible expla- nation for the result reported by Hanley and Wilhelm is that the regression masks a statistically significant institutional investor coefficient due to institutions be- ing more prominent in larger underpriced issues, because each IPO is equally weighted. The variety of possible interpretations of the results in Hanley and Wilhelm (1995) highlights two important related issues. First, do allocation data provide a representative picture of differentia! information among investors? We know of no existing evidence on this issue, but provide such information for the Sin- gapore IPO market. Biases created by pre-selling methods or explicit rationing guidelines may disguise unconstrained demand, the measure most likely to re- flect differential information among investors. Second, is it appropriate to even assume (as so many explanations of IPO underpricing do) that some investors are differentially informed? The extent to which investors are differentially informed has received little attention. Rather, it is typically assumed that institutional and/or larger investors are better informed about the "true" value of an IPO. This assump- tion underlies tests of competing equilibrium models of IPO underpricing (e.g., Koh and Walter (1989), Hanley and Wilhelm (1995)). Recent evidence (Field (1997)) indicates that institutional investors may be better informed about IPO value. Field, however, examines only post-issue institutional holdings, showing that IPOs with the smallest institutional investment at the end of the first post- listing quarter lend to have the poorest long-run returns. Hence, Field does not actually demonstrate that institutional investors are better informed in the absence of an observable market price (i.e., at the time of deciding whether, and to what extent, to subscribe to the IPO).
- 4. 428 Journal of Financial and Quantitative Analysis To investigate the extent to which allocations reflect differential information between investors, it is necessary to examine the relationship between uncon- strained demand and actual allocations. These data are not typically available, so studies such as Hanley and Wilhelm (1995) are confined to assuming that alloca- tion data reflect the underlying demand (i.e., applications). The relationship between application and allocation data, and direct evidence of the extent to which large investors are better informed, can be tested using our data for Singapore IPOs. We use the dollar value of the shares applied for as a proxy for information advantage, rather than the applicants' identity, which we cannot observe. We expect that large applications will be based on better information. In other environments, institutional investor identity and applica- tion size should be highly correlated. Using private data for 28 Finnish IPOs, Keloharju (1997) is able to distinguish retail investors' orders from those placed by institutions. He shows that institutional investors place much larger orders than those placed by retail investors, consistent with order size capturing the re- lail/instilutional distinction. More fundamentally, the role of order size is sup- ported by Chowdhry and Sherman (1996a), who argue that informed investors place larger orders even when they have the same wealth as the uninformed. Fi- nally, the dilemma of revealing information to other market participants purely by means of order size does not apply to Singapore IPOs. Other IPO participants cannot observe the number of shares applied for by a particular investor, and the total application pool is not publicly known until after the issue closes. Large in- vestors are hidden in the crowd (if they so desire) and need not fear that the size of their order will reveal their information advantage. Hence, the adverse selection problem identified in Easley and O'Hara (1987) is avoided, as too are cascades of the type described by Welch (1992). B. Institutional Arrangements The main features of the Stock Exchange of Singapore's (SES) IPO mar- ket are described in Koh and Walter (1989), Saunders and Lim (1990), and Lee, Taylor, and Walter (1996b). These papers highlight that; i) Rationing of shares in over-subscribed issues is evenhanded; all investors who apply for the same number of shares in an IPO have an equal probability of receiving an allocation. ii) Disclosure of the rationing process is provided routinely, allowing the re- searcher to determine, conditional on various application strategies, the ex post probability of success. iii) Sufficient post-issue disclosure is frequently made to allow estimation of the demand schedule, allowing the researcher to observe the application pool for an issue, the rationing process used in the issue, and the actual allocation distribution for the issue.^ corporate disclosures made in Singapore IPOs allow ihe researcher to estimate ihe prob- ability of receiving an allocation conditional on the number of shares applied for, but do not give sufficieni details to allow the demand schedule lo be reconslnicted. For example, a disclosure might indicate that one in 10 investors who applied for 1,000 shares were randomly selected as success-
- 5. Lee, Taylor, and Walter 429 Previous Singapore research has utilized the disclosures in i) and li). Koh and Walter (1989) and Lee, Taylor, and Walter (1996b) show that there is a systematic preference for the applications of smaller investors in the aliocation process, pos- sibly induced by the listing requirements of the SES. Both papers also show that large investor demand is significantly more responsive to expected levels of un- derpricing (proxied by realized underpricing) than demand in smaller investor size categories. However, neither study exploits data contained in the full application and allocation schedules for the Singapore IPO market to show small and large investor profits and losses. This paper employs the 91 (out of 132) IPOs made in the period July 1973 to December 1992 with sufficient disclosure to reconstruct the application and allocation proportion and split these into groups based on the application size. These features of the Singapore IPO market mean that the observable de- mand for an issue is not dampened by any ex ante expectation that a particular issue will be discretionally allocated to favored clients of the underwriter, Issuer, or broker for the issue."* That demand is not dampened by discriminatory allo- cations has, however, resulted in quite pervasive over-subscription levels. Lee, Taylor, and Walter (1996b) document a median over-subscription level of 14.1 times for the 128 Singapore IPOs included in their study. Chowdhry and Sher- man (1996b) suggest that, given high levels of over-subscription, the cost to the issuing firm of underpricing may be mitigated by the interest earned on the sub- scription pool. To investigate this, we calculated a standardized measure of the interest on the subscription pool expressed as a percentage of the issue size. Our standardized interest measure shows a maximum interest accruing to the issuer of 39% (this issue was priced at 65i, came on to the market three days later at $ 1.93 and was over-subscribed 783 times), though neariy 70% of issues have a value at less than 1%. This can be compared to the average underpricing we report in Table 1 of 31.73%. We conclude that the interest on the subscription pool is not a major incentive to underprice.^ It is also worth noting that the IPO process in Singapore foiiows the general principles of British law and, thus, the offer price must be set and stated in a prospectus prior to a formal invitation to the public to apply for shares. The elapsed time between fixing an offer price for inclusion in the prospectus and the listing of the shares averages four to five weeks. Comparing evidence for different countries, Loughran, Ritter, and Rydqvist (1994) suggest that the longer the time period between setting the offer price and listing, the greater will be the level of underpricing, conditional on the offer not being withdrawn. Another feature of relevance in this paper is the SES listing rule, which re- quires a minimum percentage of the issued capital (after excluding the holdings of directors, the parent company, and companies associated with the parent com- pany) to be held by shareholders who hold between 500 and 10,000 shares. The ful. but the proportion of the total issue allocaled lo such investors is not dLsclosed. Koh and Walter ((1989), pp. 270-271) provide an exampte of both a "complete" disclosure and a "partial" disclosure. "•TVpicaily 10% of the issue is reserved for staff of the i.ssuing company. Seventy-five of the 132 IPOs bad a 10% staff priority entitlement. ^The statistics for the interest on the subscription pool expressed as a percentage of issue size are: mean 1.53. median 0.49, standard deviation 3.81, maximum 39.04, minimum 0.01, deciles 4.28,1.89, 1.13. 0.79,0.49. 0.27, 0.16, 0.08. 0.04. 0,01.
- 6. 430 Journal of Financial and Quantitative Analysis TABLE 1 Summary Statistics lor Singapore IPOs Summary statistics for various firm attributes for 132 Singapore IPOs made between July 1973 and Dec, 1992, and for the 91 firms for which sufficient data are disclosed to allow the application and allocation proportions for the issue to be reconstructed (the included firms), and tor the remaining 41 firms for which application and allocation proportions cannot be reconstructed (the excluded firms). Variable^ Underpricing (%) Over-subscription (times) Age of the firm (years) Retained ownership Listing lag (days) Log of issue size Log of total assets 250-Day wealth rels Number of firms surviving 250 Days 50(^Day wealth rels Number of firms surviving 500 Days 750-Day wealth reis Number of firms sun/iving 750 Days Total IPOs Mean (Median) 31.73 (20.52) 41,28 (12,65) 17,23 (13.00) 68.84 (74.61) 16,08 (15.00) 16,80 (16,72) 18.02 (17,91) 1,073 (0,967) 0,992 (0,880) 1,008 (0,860) Standard Deviation 40.89 83.02 16,92 13,08 6,62 1.12 1.29 0,436 132 0,449 118 0,550 107 Included IPOs Mean (Median) 35.13 (26,96) 55.43 (30.00) 15.72 (14,00) 69.95 (74,57) 15.01 (15,00) 16,93 (16,83) 18.11 (17.81) 1,033 (0.921) 0,959 (0,829) 1.020 (0,803) Standard Deviation 40,84 95,60 9,04 10,33 3,63 1,14 1.32 0,440 91 0,465 BI 0,610 71 Excluded IPOs (n = A^) Mean (Median) 24,19 (11.00) 9.66 (2,30) 20,59 (13.00) 66,37 (74,79) 18,46 (16,00) 16,52 (16,47) 17,81 (17-98) 1.161 (1.000) 1,064 (1.055) 0,984 (0,984) Standard Deviation 40,47 2135 27,15 17.64 1027 1.04 1,21 0.417 41 0,406 37 0.414 36 * Underpricing = The last sale on the first day of listing minus the subscription price, divided by the subscription price, multiplied by 100(%), Over-subscription = The multiple by which total applications exceed available shares (times). Age of the firm = Length of prior operating history of the firms (years). Retained ownership = Proportion of the equity retained by previous owners (%), Listing lag = Time between prospectus registration and exchange listing (days). Log of issue size = Natural log of equity issue size • (Singapore $ millions). Log of total assets = Naturai iog of total assets after initial equity issue * (Singapore $ millions), 2S0-, 500-, 750-Day wealth relatives — The investment performance of the obsen/ation relative to a market return over the relevant number of trading days. The beginning point for the wealth relative is the first day listing price (ratio). Number of firms = The number of firms used in the calculation of the relevant wealth relative (firms). The number of observations for the 500- and 750-day wealth relative decreases due to truncation of the share price series at Dec, 31. 1993, No sample company failed or delisted during the period of the study • These figures are CPI-adjusted to a Jan, 1993 base, to reflect a constant dollar value. For comparison purposes, the exchange rate between the Singapore dollar and the U,S, dollar increased durir>g the study from approximately 2.1S$: 1 US$ to 1,4S$- 1 US$.
- 7. Lee, Taylor, and Walter 431 minimum percentage varies from 10% (for issues with paid-up capital of $150 million or more) to 20% {for issues with a paid-up capital of $50 million or less). This rule creates a bias in favor of smaller investors, clearly evident in Koh and Walter's (1989) figure 2. which shows that the probability of receiving an alloca- tion of shares for a 1,000 share application (0.35) is more than twice the proba- bility of success (0.16) when I million shares are sought. However, whether this bias actually reduces the extent of any winner's curse (as suggested in Chowdhry and Sherman (1996a) has not been addressed empirically. III. Data and Empirical Results A. Data and Descriptive Statistics We use a combined sample of IPOs previously studied by, and described in, Kob and Walter (1989) and Lee, Taylor, and Walter (1996b). During the period from July 1973 (which marks the inception of the SES) to December 1992, tbere were 132 IPOs. We manually searched the company files at the SES library to extract details of the application and allocation patterns for each issue. Ninety- one issues provided sufficient information to allow us to estimate the total demand schedule for tbe issue (see the Appendix for details of the estimation methods used), classified by size of application, The reasons why data are not available for 41 IPOs are as follows: i) Prior to June 1978, detailed disclosure of demand for the issue was not re- quired and was rarely provided on a voluntary basis (22 out of the 25 IPOs made between January 1973 and June 1978 did not voluntarily disclose the demand schedule). ii) Six IPOs were under-subscribed and they did not provide sufficient details to allow demand to be determined.^ iii) A further 13 IPOs were over-subscribed but the details of the application patterns cannot be estimated from the (less complete) information disclosed.' Nine of these come from the earlier IPOs studied by Koh and Walter (1989). In summary, the exclusions are primarily caused by insufficient voluntary disclosure in the earlier IPOs. Thirty-two of the first 66 IPOs in our sample period do not provide sufficient disclosure for our tests, while only nine of the second 66 are omitted due to incomplete application and allocation data. Various attributes of the IPO population (132) and tbe included (91) and ex- cluded (41) IPOs are reported in Table 1. Underpricing for the excluded IPOs is approximately 24%, which is insignificantly different (r-statistic 1.43) from tbe 35% for the included firms. However, the over-subscription level of 55 times for the included firms is significantly higher (r-statistie 4.31) than for the excluded firms (10 times). This is expected because under-subscribed firms are in the excluded set. Included firms have issue sizes that are significantly larger than ^Of the.se six omitted (under-subscribed) fimis. [hrce were overpriced (by an average of 8.2%). Another two firms were underpriced (by an average of 7,0%) and one was neither over- nor under- priced. These omissions may introduce a bias to the results. 'The niean over-subscription for lhe.se was 21,0 times, and ihe median was 8,0.
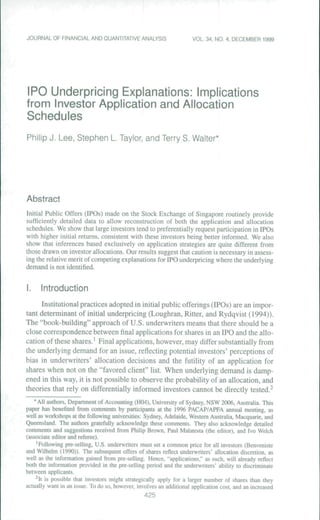
- 8. 432 Journal of Financial and Quantitative Analysis excluded IPOs (/-statistic 2.00), but firm size as measured by total assets, is in- significantly different (r-statistic 1.27) between the two groups. The lag between the prospectus date and the listing date is significantly smaller (r-statistic 2.09) for the included firms. This is also expected as a result of efficiencies associated with technology improvements introduced into the IPO process over the sample period, and also because under-subscribed offerings are probably shopped longer. Across all other dimensions (retained ownership, age, and three measures of long-run performance), the included and excluded firms have similar characteristics. As noted in Lee, Taylor, and Walter (1996b), there is no evidence that Singa- pore IPOs display poor long-run performance of the type encountered in several international studies (see Loughran, Ritter, and Rydqvist (1994)). Further, while initial underpricing is significantiy positive, Koh and Walter (1989) and Lee, Tay- lor, and Walter (1996b) show that once the probability of receiving shares in an issue is considered, initial returns are insignificantly different from the risk-free rate of interest. This result is consistent with the prediction (for uninformed in- vestors) of Rock's (1986) equilibrium model of why new issues are underpriced. A direct test of Rock's model requires data on the rationing process used in each IPO, and this information is routinely supplied to the market in Singapore. The probability of an allocation, conditional on the quantity applied for, can be estab- lished for 128 of the 132 IPOs; these probabilities were used in previous Singa- pore tests of Rock's model; however, the more stringent disclosure requirements that we impose restrict the analysis to 91 firms. Figure 1 plots the difference in the allocation proportion and the applica- tion proportion for investors in four categories (small, medium/small, medium, and large investors) for each ofthe 91 issues. Small investors are defined as those who apply for up to $5,000 dollars worth of shares in each issue, mediuni/small in- vestors apply for $5,001 to $50,000, medium investors apply for $50,001 to $250,000, and large investors are defined as those who apply for more than $250,000 worth of stock. It is clear in Figure 1 that large investors are allocated relatively less than they apply for, when compared to small investors. The data on which Figure 1 is based show that large (informed) investors, on average, account for approximately half the applications, though they are allocated only 28%. In contrast, small (uninformed) investor demand constitutes, on average, 12% of the applications, but they receive an average of 32%. An analysis of the IPOs plotted in Figure 1 shows that the range of appli- cation proportions differs considerably from the allocation proportions. Large investors had a minimum demand of zero (as too did medium investors for one issue that was underpriced by significantly less than the average underprieing for the sample) and a maximum demand of 97.55% (the issue was the most heav- ily over-subscribed IPO and it was the most underpriced; small investors were crowded out of this particular issue and accounted for only 1.22% of the total ap- plication pool for the issue, though they were allocated 20.2% ofthe shares). We examine these matters in greater detail in subsequent regression analysis, but point out that substantial differences in application and allocation proportions mean that inferences drawn solely from an analysis of allocations may give a false picture of application proportions for the Singapore IPO market. Likewise, the allocation data examined by Hanley and Wilhelm (1995) may aiso disguise the underlying.
- 9. Lee, Taylor, and Walter 433 unconstrained demand for U.S. IPO shares, making a reliable test of this particular prediction of Rock's (1986) winner's curse model difficult. Panels A, B, and C of Table 2 combine the information in Figure 1 with data on issue size and underpricing to develop total profit (loss) statistics for all 91 issues, and separately for the underpriced issues (84) and the overpriced or fully priced issues (seven). The profit (loss) statistics in panels A, B, and C of Table 2 are developed using the actual allocations for each issue and show that large investors made an average gross profit before application and information search costs of $3,897 million per issue, while small investors made $3,766 million per issue. The total realized value of the information advantage of large investors is $11.9 million for the 91 issues. However, as shown in Figure 1 and further quantified below, large investor gains are scaled back by the allocation system used in Singapore. The maximum profit earned by large investors is $54,122 million, while their maximum loss is $31.189 million.^ Across all issues, $920.7 million dollars are left "on the table" (i.e., 91 times the sum of the mean profits for the four application size categories). In underpriced issues, the total gain to investors is $1,078.6 million, while the total loss in overpriced issues is $157.9 million. Large investors are shown to make substantial gains ($406.6 million) in the 84 underpriced issues (which are 12 times as likely for our data), but they also suffer some large losses ($52.0 million) in the seven overpriced issues. Panels D and E of Table 2 show the wealth transfer associated with the fa- vorable treatment small investors receive in rationing IPOs, which was evident in Figure 1. Panel D shows the wealth transfers and panel E shows profits that would have been achieved by each investor category if allocations were strictly proportional to applications. The systematic favoring of small investors results in an average increase in profit per issue of $2,674 million for small investors, whereas large investors have their profits reduced on average by $2,630 million. Large investors apply for issues that would produce average gains of $6,527 mil- lion, but the allocation process scales these profits back lo an average gain of $3,897 million. Median results show similar patterns of profit transfer from large to small investor categories. The application data can also be used to estimate the information advantage that large investors have over small investors. Large investors apply for issues that would have realized gains of $6,527 million per issue, whereas small investor applications would have produced gains of $1.092 million per issue. The total value of this information advantage is $494.6 million for the 91 issues. However, as we have shown here, allocations in Singapore IPOs systematically favor small investors, reinforcing our point that inferences drawn from allocations are quite different to those based on applications. Hence, tests of competing IPO pricing models (e.g., Hanley and Wilhelm (1995)) that rely on allocation decisions may not produce the same conclusions as tests based on application decisions. "The maximum loss occurred for DBS Land, which issued 300 million shares a( $1.35. These shares ended trading on [he first day at $1.03 (above the low of 80rf), giving invesiorn a IONS of $96 million ((1.03 - 1.35) * 300 million). Thi.s loss was then adjusted for the change in the CPl between October 1987 and the CPI base of January 1993 by applying a factor of 86.8.
- 10. 434 Journal of Financial and Quantitative Analysis FIGURE 1 Differences in the Application and Allocation Proportions lor Various Investor Classes Small Medium/smaii Medium Large IPO Number in Chronological Order Differences in the application and allocation proportions for various investor classes (based on dollar value of applications), from 91 Singapore IPOs made between July 1973 and December 1992 that have sufficient data disclosed to allow the application and allocation proportions for the issue to be reconstructed. The vertical axis is the change (bias) between the application and allocation proportion. B. Evidence on Application and Allocation Schedules as Explanations of Initial Underpricing This section investigates the ability of application and allocation schedules to explain variations in initial underpricing. We are particularly interested in whether different inferences flow from looking at ihe allocation decisions of issuers, com- pared to the application patterns of investors, across various application size cat- egories. As we detail below, the proportions applied for by investors are substan- tially different from the proportions allocated to those investors. Table 3 reports results for eight regressions in which either the application proportion (within four investor size categories) or the allocation proportion {for the same four investor size categories) is regressed on initial profit. Initial profit Is calculated as initial underpricing multiplied by the size of the issue (in millions of Singapore dollars). The regression equation for Table 3 is P, = i + £, where ( P IP = 1,2,..., number of firms; Proportion for small, medium/small, medium, and large applica- tions and allocations; Initial Profits.
- 11. Lee. Taylor, and Walter 435 TABLE 2 Singapore IPO Profits Profits to various investor classes (based on dollar value of applications) for Singapore IPOs where sufficient disclosures were made to allow reconstruction of the total demand for the issue and the basis of allocation in the issue (91 firms), drawn from 132 IPOs made between July 1973 and Dec. 1992, The sample is then split into those IPOs that were overpriced or had zero initial return (seven firms) in Panel B, and the underpriced IPOs (84 firms) in Panel C, Panel D shows the change in profits caused by the allocation proportions differing from the application proportions, while Panel E describes the profits that would have been earned if the allocation proportions had been determined by the application proportions. Profits are denominated in Singapore dollars, CPI-adjusted to a Jan, 1993 base, to reflect a constant dollar value. Profit (Loss) Statistics Pane/A All IPOs (91) Mean profit (loss) Standard deviation Median profit (loss) Maximum profit (loss) Minimum profit (loss) Small Investor Profit (Loss)* $3,765,882 $8,695,357 $1,622,559 $39,370,500 ($41,032,300) Medium/Small Investor Profit (Loss)* $1,064,043 $4,164,089 $400,009 $20,164,330 ($24,774,200) Panel B. Overpriced and Zero Initial Return IPOs (7) Mean profit (loss) Standard deviation Median profit (loss) Maximum profit (loss) Minimum profit (loss) ($7,451,440) $14,974,490 ($545,260) $0 ($41,032,300) Panel C Underpriced IPOs (84) Mean profit (loss) Standard deviation Median profit (loss) Maximum profit (loss) Minimum profit (loss) $4,700,659 $7,367,480 $2,070,049 $39,370,500 £13,984 ($4,498,790) $9,071,770 ($361,420) $0 ($24,774,200) $1,527,612 $3,166,310 $467,905 $20,164,330 $6,356 Medium investor Profit (Loss)* $1,390,794 $3,159,871 $926,084 $16,592,120 ($13,603,700) ($3,170,610) $4,947,399 ($393,190) $0 ($13,603,700) $1,770,910 $2,675,162 $1,085,743 $16,592,120 $9,262 PanBl D. Change in Profits Caused by the Allocation Proportions Beinq Different from Proportions Mean profit change (ioss) Standard deviation Median profit change (loss) Maximum increase in profit or decrease in loss Maximum decrease in profit Of increase in loss Panel E. Profits that Would Application Proportions Mean profit (loss) Standard deviation Median profit (loss) Maximum profit (loss) Minimum profit (loss) $2,673,575 $5,502,616 $1,234,091 $33,478,410 ($18,013,200) $153,231 $1,948,279 $84,431 $6,238,217 ($15,605,900) Have Been Achieved if the Allocation $1,092,307 $4,829,758 $418,645 $33,073,170 ($23,019,000) $910,811 $2,950,811 $261,072 $20,326,880 ($9,166,330) ($193,240) $1,270,296 ($58,990) $6,533,888 ($6,688,350) Large Investor Profit (Loss)' $3,896,595 $9,371,620 $1,064,691 $54,121,740 ($31,188,900) ($7,433,960) $12,529,870 ($808,230) $0 ($31,188,900) $4,840,808 $8,494,440 $1,466,682 $54,121,740 $0 the Application ($2,630,410) $6,024,168 ($846,620) $27,085,190 ($28,832,100) Proportions Strictly Followed the $1,584,036 $3,987,025 $931,838 $18,750,420 ($20,137,600) $6,527,001 $14,621,6^ $2,180,113 $67,863,920 ($58,274,100) ' Small investors are defined as those who apply for up to $5,000 dollars worth of shares in each issue, medium/small investors apply for $5,001 to $50,000, medium investors apply for $50,001 to $250,000, and large investors are defined as those who apply for more than $250,000 worth of stock. The results in Table 3 show that relative demand by large investors is significantly positively associated with underpricing, consistent with large investors being bet- ter informed.^ Indeed, demand by the largest investors is sufficient to reduce the proportional applications and allocations in the three smaller investor categories, 'We repeated the regressions in Table 3 tjsing weighted least .squares, where the weighis are ihe size of the issue. The unreported results are very similar lo tho,st; reported.
- 12. 436 Journal of Financial and Quantitative Analysis TABLE 3 OLS Regression Results for Application and Allocation Proportions Results for the OLS regression of application and allocation proportions lor various investor classes (based on dollar value of applications) on initial underpricing profits, for 91 IPOs where sufficient disclosures were made to allow reconstruction of the total demand for the issue and the basis of allocation in Ihe issue, drawn from 132 Singapore IPOs made be- tween July 1973 and Dec. 1992. Initial underpricing profits are determined by multiplying the initial underpricing by the size of the issue (issue price multiplied by the number of shares issued) and are denominated in millions on Singapore dollars, then CPI-adjusted to a Jan. 1993 base, to reflect a constant dollar value. All /-statistics have been adjusted for heteroskedasticity using White's (1980) procedure. Statistic Application Proportions Coefficient (-Statistic Panel A. Small Investor^ Relative Demand Intercept 0.15373 Initial profits -0.00076 Adjusted R^ Panel B. Medium/Small Investor' 10,51" -1.24 0,0051 ' Relative Demand Intercept 0.11159 11,35" Initial profits -0.00036 -0.88 Adjusted R^ -0.0031 Panel C. Medium Investor^ Relative Demand Intercept 0,22915 15,98" Initial profits -0,00121 -1,90" Adjusted fl^ 0.0435 Panel D. Larae Investor^ Relative Demand Intercept Initial profits Adjusted R^ 0,50553 0,00234 17.45" 1,90* 0.0319 Allocation Proportions Coefficient 0.40441 -0,00054 0,13432 -0,00049 0.17688 -0.00066 028443 0,00169 -0,0052 0.0035 0.0169 0,0264 (-Statistic 22,64" -0.86 13.83" -1.26 16,34" -1,40 12,65" 1.74" ^Small Investors are defined as those who apply for up to $5,000 dollars worth of shares in each issue, medium/small investors apply for $5,001 to $50,000, medium investors apply for $60,001 to $250,000, and large investors are defined as those who apply for more than $250,000 worth of stock. The regression equation is Pi = a + /3IP^+£, where / — 1,2,..., number of observation firms; P - proportion for small, medium/small, medium, and large applications or al- locations; IP - initial profits in millions of Singapore dollars. 'Significant at 5% "Significant at 1% such Ihat the coefficient on underpricing profit is negative, either insignificantly different from zero (five cases) or significantly negative (one case). In all eight cases, White's (1980) adjusted /-statistics show the intercept to be highly signif- icant, suggesting that there are omitted variables in this test of cross-sectional differences in underpricing. A test similar to Table 3 is reported by Hanley and Wilhelm (1995), who find an insignificant positive relationship between the proportion of an issue al- located to institutional (i.e., large) investors and initial underpricing. When we
- 13. Lee, Taylor, and Walter 437 repeat the regressions in Table 3 using underpricing, rather than initial profits as the dependant variable, our results are similar to, though somewhat weaker than, those reported in Table 3. Koh and Walter (1989) report that the Spearman rank correlation coefficient between tbe over-subscription level and underpricing in their sample (n — 66) is 0.951, which is significant at the 1 % level. Lee, Taylor, and Walter (1996b) report results for a univariate regression of over-subscription on underpricing [n = 128), which is also significant at the 1% level. Table 4 explores these issues further For each of three samples (all 91 IPOs, the 46 least underpriced IPOs, and the 45 most underpriced IPOs), we regress the level of over-subscription achieved within four investor categories (small, medium/small, medium, and large) on ini- tial underpricing. Rock's (1986) theory predicts that, among other things, the estimated coefficients, which are measures of how responsive investors are to expected underpricing (proxied by actual underpricing), should reflect their infor- mation advantage. For example. Rock's (1986) model also predicts that issuers intentionally underprice IPOs to overcome the adverse selection problem that un- informed investors face in dealing in a market in which informed traders exist. Looking first at panel A for all 91 IPOs, the results are strongly in accord with this theory, providing that the value of shares applied for is a valid proxy for the information advantages of groups. While small investor demand expansion is sta- tistically significant (each 1% increase in underpricing results in small investor demand expanding by 7.9%), it expands far less markedly than large investor de- mand (each 1 % of underpricing causes demand to expand by 176.7%, or 22 times as much). Rock ((1986), pp. 194-196) noted that it is essential to establish that uninformed demand expands as the issue price is reduced. This creates an in- centive for the issuer to underprice, because underpricing increases the chance of achieving full subscription in the event of informed demand being withdrawn (i.e., the issue is overpriced). It is also worth noting that the panel A regressions in Table 4, with the adjusted R^s in the range of 0.2467 (small investors) to 0.3088 (medium/small investors), indicate that underpricing explains over-subscription levels within investor size categories quite weli. Further evidence consistent with demand expansion by informed investors is presented in the sub-category results drawn by dividing the sample at the median level of underpricing. For the most underpriced subsample in Table 4, panel C, large investor demand expands sufficiently (the coefficient is 278.3)'^ to crowd out uninformed investors, and small investor demand expansion is no longer sta- tistically significant. The reverse is true for small investor demand in the least underpriced subsample in panel B; where small investor demand expansion is statistically significant at the 1% level." '"White's (-statistic i.s significant at 5% in Table 4 whereas the raw /-.statistic is 3.931. This result is influenced by one exireme observation caused by the most heavily over-subscribed (and most under- priced) issue. White's (-statistic increa.ses to 2.035 (significant at 1%) when this outlier is removed. '' The standard error of the estimate for the underpricing coefficient on this regression is 32.4. Thus, it is clear that some ofthe least underpriced IPOs still attract significant informed demand. White's (1980) adju.sled (-statistics were also calculated. These are consistent with the reported results, except that the f-statistic for large investor demand expansion for ihe mo.st underpriced i.ssues is significant at 5%, rather ihan al I %. The weaker result is caused by one extreme observation.
- 14. 438 Journal of Financial and Quantitative Analysis TABLE 4 OLS Regression Results for Over-Subscription Levels Results for the OLS regression of over-subscription level for various investor classes (based on dollar value of applications) on initial underpricing where Ihe over-subscription level is determined by actual application levels for 91 IPOs where sufficient disclosures were made to aliow reconstruction of the total demand for the issue and the basis of ailocation in the issue, drawn from 132 Singapore IPOs made between July 1973 and Dec. 1992. Underpricing is calculated by taking the natural logarithm of the last sale price on the first day of listing divided by the subscription price. Ail f-statistics have been adjusted for heteroskedasticity using White's (1980) procedure. Small Medium/Smali Medium Largo Investors" Investors^ Investors* Investors* Coefficient f-Statistic Coefficient f-Statistic Coefficient f-Statistic Coefficient f-Staiistic Panel A Ali 91 Issues Intercept 1.43 3.95"* 0.82 1.98- 2.77 3.13" -8.77 -0.56 Underpricing 7.93 5.38" 6.55 2,88" 21.66 S.A5" 176.75 2.14' Adjusted t^ 0.2467 0.2824 0.3088 0.2601 Panel B. Least Underpriced Issues (46) Intercept 1.22 6.45" 0.92 7.01" 2.47 4.95" 8 68 3.51" Underpricing 4.41 2.44" 3.72 3.12" 18.36 2,88" 57,15 2.01" Adjusted ff 0.0931 0.1147 0.1482 0.0458 Pane! C. Most Underpriced Issues (45) Intercept 3.34 1.96* 1.05 0.59 5.08 1.36 -64.30 -1.00 Underpricing 4.81 1.47 6.29 1.35 17.85 2.27' 27826 1.68- Adjusted If 0.0252 0.1053 0.0939 0.2473 ^Small investors are defined as those who apply for up to $5,000 dollars worth of shares in each issue, medium/small investors apply for $5,001 to $50,000, medium investors apply for $50,001 to $250,000, and large investors are defined as those who apply for more than $250,000 worth of slock. The regression equation is OS, = a + /?UP, + e, where / = 1,2,..., number of observation firms; OS = Over-subscription for small, medium/small, medium, and large investors: UP = Underpricing. "Significant at 5% "Significant at 1% We also estimated these regressions using the allocation proportions (rather than the over-subscription levels or application proportions used in Table 4) within investor categories, In summary, the demand expansion coefficients for tbe four investor categories for the full sample are —0.0563 for small investors, —0.0787 for medium/small, 0.0046 for medium, and 0.1308 for the large group. None of these coefficients is statistically significant. This evidence provides a further cautionary note for inferences drawn from observation of the allocation outcomes. In Singapore, the results for application proportions and allocation proportions are quite different. Specifically, large investor demand expands significantly based on applications, but the allocation data mask this relationship. Taken together, the results in Table 4 are consistent with Rock's model, which predicts that informed demand expansion in underpriced issues crowds out other investors. More generally, other models (e.g., Welch's (1992) cascade theory) of underpricing also require that demand expands in response to price decreases.
- 15. Lee, Taylor, and Walter 439 Table 5 further explores the issue of demand expansion. Here, our concern is to determine the extent to which applications by (and allocations to) investors in each of the four size categories are explained by the level of over-subscription. It is clearly evident in the Table 5 result that, overall, over-subscription levels are determined by the large investor group. The estimated coefficients of O.(X) 12 for applications and 0.0010 for allocations have /-statistics of 3.05 and 4.17, re- spectively. In sharp contrast, all six coefficients for the three smaller investor categories are significantly negative. TABLE 5 OLS Regression Results for Total Demand Proportions Results for the OLS regression of proportion of the total demand for an issue applied for by various investor classes (based on dollar value of applications) as a function of total over- subscription, and the proportion of the total demand for an issue allocated to various in- vestor classes (based on the size of the application) as a function of total over-subscription, for 91 IPOs where sufficient disclosures were made to allow reconstruction of the total de- nnand for the issue and the basis of allocation in the issue, drawn from 132 Singapore IPOs made between July 1973 and Dec. 1992. All (-statistics have been adjusted for het- eroskedasticity using White's (1980) procedure. Statistic Application Proportions Allocation Proportions Coefficient f-Statistic Coefficient /-Statistic Panel A. Small Investor* Relative Demand Intercept 0.1709 9.79" 0.4228 22.63" Over-subscription -0.0005 -2.40" -0,0005 - 3 . 6 6 " Adjusted R^ 0.0982 0-0633 Panel B. Medium/Small Investor^ Relative Demand Intercept 0.1267 10.82" 0,1474 12.41" Over-subscription -0.0004 -2.35* -0.0003 -2.31' Adjusted fl^ 0.1281 0.1160 Panel C. Medium Investor^ Relative Demand Intercept 0.2343 17.29" 0.1791 17-16" Over-subscription -0.0003 -5.17" -0.0002 - 3 . 2 9 " Adjusted R^ 0.0601 0.0208 Panel D. Large investor^ Relative Demand Intercept 0.4681 15.23" 0.2506 11.11" Over-subscription 0.0012 3.05" 0.0010 4.17"' Adjusted fl2 0.1744 0.2048 ^Small investors are defined as those who apply for up to $5,000 dollars worth of shares In each issue, medium/small investors apply tor $5,001 to $50,000, medium investors apply for $50,001 to $250,000, and large investors are defined as those who apply for more than $250,000 worth ot stock, The regression equation is P, - n + /30S,+e, where / = 1,2,..., number of observation firms; P = proportion for small, medium/small, medium, and large applications or al- locations; OS = over-subscription. 'Significant at 5% "Significant at 1%
- 16. 440 Journal of Financial and Quantitative Analysis C. Long-Run Returns In unreported results, we also tested for an association between long-run returns and initial investor demand for an issue. Long-run returns are measured as individual firm wealth relatives. Our methodology is consistent with that of Lee et al. (1996b) in their equations 5, 6, and 7 and their Table 5. The wealth relative compares the investment in each firm (from the first day of listing) with the performance of the market index over an equivalent period. The index used is the Straits Times index, which is an equally-weighted price index of 30 stocks (adjusted for capital changes but not adjusted for dividends). Ritter (1991) suggests that long-run under-performance of IPOs reflects the overly optimistic expectations of investors, followed by a marked reversal in de- mand post-listing. Such an association is inconsistent with an efficient market (though perhaps consistent with a speculative bubble or fad argument). While Lee, Taylor, and Walter (1996b) examine the relationship between long-run re- turns and initial demand, they do not break demand down into categories that are proxies for information advantage. However, none of the estimated coefficients on over-subscription by these different investor groups was significant, and all models had insignificant explanatory power. Fad or speculative bubble arguments are not supported by this analysis. Market efficiency explanations better fit the results. We further explore the issue of whether long-run IPO returns are associated with initial demand for the issue. Specifically, we constructed an index of the level of informed demand for an issue by dividing the over-subscription level for large investors by the sum ofthe over-subscription levels for the other three cat- egories. IPOs with larger values for this statistic have a larger level of informed demand. This proxy for the level of informed investor participation in an IPO was regressed on the 250-, 500-, and 750-day wealth relatives for the sample. Field (1997) shows that IPOs that have larger institutional shareholdings at the end of the quarter after listing have better equally-weighted long-run (three-year) abnor- mal returns. However, we are unable to find any significant association between long-run performance and our proxy for the level of informed investor participa- tion in the IPO. This is in contrast to our evidence that informed investors reveal their information advantage in relation to initial IPO underpricing in Singapore. IV. Conclusions Using confidential allocation data for a limited number of U.S. IPOs, Haniey and Wilhelm (1995) show that institutional (i.e., informed) investors receive ap- proximately the same proportions of shares in overpriced and underpriced issues. They interpret this result as support for Benveniste and Spindt's (1989) explana- tion of IPO underpricing, which is premised on discriminatory behavior by U.S. underwriters, and reject the winner's curse explanation proposed by Rock (1986). This conclusion, however, is subject to the criticism that the final allocation of IPO shares may look very different from the underlying demand for the shares. Unfortunately, this criticism cannot be evaluated using U.S.-sourced data, for at least two reasons. First, application and allocation data will likely be very
- 17. Lee, Taylor, and Walter 441 similar if, in fact, underwriters' discriminatory allocation powers dampen under- lying (i.e., unconstrained) demand. Second, even if this were not the case, such application data are simply not available to researchers in the U.S.; however, IPOs made on the Stock Exchange of Singapore (SES) routinely provide details of how over-subscribed issues are rationed. Frequently, the disclosure is sufficiently de- tailed to allow the application schedule for an IPO to be reconstructed. For a sample of 91 IPOs made on the SES between July 1973 and December 1992, we investigate the profits and losses made by Investors in various size-of-application based categories. We argue that investors who apply for larger quantities of IPO shares are likely to be better informed than small investors are. Based on the al- location decisions of underwriters and issuers, we show that large investors make substantial profits in underpriced issues, though they also lose in overpriced is- sues. Similarly, based on allocation decisions, small investors gain in underpriced issues and lose in overpriced issues. We also show, however, that allocation deci- sions favor smaller investors and cause a transfer of some profits that would have accrued to large investors if allocations were strictly proportional to applications. Most important, we show that inferences drawn from an analysis of Ihe allo- cation decisions of underwriters and issuers in Singapore are in contrast to those arising from an investigation of investors' application strategies. We show that larger investors are more informed in that they apply for relatively more of the un- derpriced Issues. Our results are consistent with the predictions of Rock's (1986) theory of why, in equilibrium, IPOs are underpriced. We note that a direct test of the uninformed investor equilibrium conditions in Rock's model requires that the probability of receiving an allocation in IPOs can be estimated. These data are routinely reported for IPOs made on the SES. We show that, in underpriced IPOs, large investor demand is far more responsive than small investor demand. We split our sample at the median level of underpricing and show that large in- vestors crowd small investors out of the most underpriced issues and leave small investors to take larger proportions of the less attractive issues. Thus, we provide, for the first time, evidence that large investors arc better informed and that this information advantage is revealed in their IPO application strategies. While sev- eral authors assume such a relationship, we provide strong empirical support for its existence. Appendix The following is the full text of an announcement made by United Merchant Bank Limited (the underwriter) on April 19, 1988 for and on behalf of Fuji Offset Plates Manufacturing Ltd (the issuer).
- 18. 442 Journal of Financial and Quantitative Analysis ANNOUNCEMENT Fuji Offset Plates Manufacturing Ltd (Incorporated in the Republic of Singapore) New Issue of 5,000,000 shares of $0.20 each at $0.75 per share 1, The Board of Directors of Fuji Offset Plates Manufacturing Ltd ("Fuji Offset" or the "The Company") is pleased to announce that, at the close of the Application List at 12 noon on 19 April 1988, Fuji Offset's issue was 11.0 times subscribed. Of the 4,250,000 shares available for subscription by the public, a total of 5,237 applica- tions were received for 46.866,000 shares, amounting to $35,149,500. 2. In order to ensure a reasonable spread of shareholders in the Company, the Board has decided on the following basis of allotment: Range ot Shares Applied for ('000) 1 2-9 10-19 20-49 50-99 100-249 250-499 500-999 1,000 & above Balloting Ratio 10:25 18:25 Allotment Allotment Allotment Allotment Allotment Allotment Allotment No. of Shares Allotted per Successful Application ('000) 1 1 1 2 4 6 12 20 36 Percentage of Shares Allotted (%) 36.7 15.1 6.9 1.0 5.3 12.7 0.8 11.3 10.2 100.0 3. The 500.000 shares reserved for the management and staff of Fuji Offset and those who have contributed to the success of the Company were fully subscribed. The 250,000 shares placed privately with the Sponsoring Market Makers were also fully subscribed. 4. The Board of Directors wishes to thank all applicants for their interest and confidence in the Company, Unsuccessful applications and refund cheques for successful appiications will be sent to applicants as soon as possible. We estimate demand for the issue for investors in the following categories: i) small investors, defined to be those appiying lor $5,000 worth ot" shares or less, ii) medium/small investors, defined to be those applying for between $5,001 and $50,000 worth of shares, iii) medium investors, defined as those applying for between $50,001 and $250,000 worth of shares, and iv) large investors, those applying for more than $250,001 worth of shares. V ' •' We estimate total demand (D) at each range of application (/) as follows: AP, * AS * IB, • LR; where AP, = the proportion of shares allocated to investors with an applica- tion in the range i, AS = the number of shares available for subscription, IB, = the inverse of the balloting ratio for applications in the range J, LR, = the low point of the range for an application in range i, and NAj = the number of shares allotted to each successful application in range i.
- 19. Lee, Taylor, and Walter 443 Thus, demand {D) for application / = 1 is 0.367*4,250,000*25/10* 1,000 U — 1,000 = 3,899.375 shares. Thus, we estimate that there were 3,899.375 applications for 1,000 shares giving an over-subscription rate of 0.9175. That a minimum parcel was 1,000 shares lor this issue means that some rounding error exists in this calculation. It is probable that 3,900 or 3,899 applications were received. The subscription price per share for this issue was $0.75, thus 1,O(X) shares would cost $750. This is less than the upper limit ($5,000) of our definition for the cost of shares for small investors, while a subscription for 2,000 shares (the smallest application size in the next dis- closed category) would cost $ 1,500. This is again less than the $5,000 upper limit (and, hence, will be included in the small category), though the next category has a cost of $7,500 and is, thus, in the medium/small category. The estimated number of shares applied for in category D2 is 1,782,639. Thus, the over-subscription rate for small investors is estimated at (3,899,375 + 1,782,639)/4,250,000 or 1.3369 times. Another source of rounding error exists in our calculations because we do not know the distribution of applications within a range. Here, we assume all applicants apply for the smallest number of shares in a range and, thus, our esti- mates of demand are downward biased, To illustrate this rounding error, we show below, in summary, all analogous calculations for this issue. Medium/small demand over-subscription is estimated at 1.4525 times, medi- um demand results in an over-subscription rate of 2.2833 times, and large in- vestor demand is over-subscribed 5.6583 times. Our total demand is estimated as 10.7310 times, whereas actual over-subscription was 11.0273 times. References Benvenisie, L. M.. and P. A. Spindt. "How Invcstmenl Bankers Deicrmine the Offer Price and Allo- cation of initial Public Offerings." Journal of Financial Economics. 24 (Oct. 1989), 343-361. Benveniste, L. M., and W. J. Wilhelm. "A Comparative Analysis of IPO Proceeds under Aliemaiive Regulatory Environment.s." Journal of Financial Economics, 28 (Nov./Dec. 1990), 173-207, Chowdhry. B., and A, Sherman. 'The Winner's Curse and International Methods of Allocating Initial Public Offering,s," Pacific-Basin Finance Journal. 4 (May 1996a). 15-30. "Intemaiiona! Differences in Oversubscription and Underpricing of IPOs," Journal of Corporate Finance. 2 (July 1996b). 359-381, Easley, D,. and M. O'Hara, "Price, Trade Size, and Information in Securities Markets." Journal of Financial Economics. 19 (Sept. 1987), 69-90. Field, L. C. "Is Institutional Invesinient in Initial Public Offerings Related to the Long-Run Perfor- mance of These Firms?" Working Paper, Penn State Univ. (Jan. 23, 1997), Hanley. K, W., and W, J, Wilhelm, "Evidence on the Sirategic Allocation of Initial Public Offerings." Journal of Financial Economics. 37 (Feb. 1995), 239-257. Keloharju, M. "The Distribution of Information among Institutional and Retail Investors and the Impact of Past Investment Performance on ihe Demand for IPOs." Working Paper, Helsinki School of Economics and Business Administration. Helsinki, Finland (Jan. 11, 1997). Koh. F,, and T. Waller. "A Direct Test of Rock's Model of ihe Pricing of Un,seasoned Issues." Journal of Financial Economics. 23 (Aug. 1989), 251-272, t-ee. P.; S. Taylor; and T. Walter. "Australian IPO Pricing in the Shon and Long Run," Journal of Banking and Finance. 20 (Aug. 1996a), 1189-1210,
- 20. 444 Journal of Financial and Quantitative Analysis "Expected and Realised Returns for Singaporean IPOs: Initial and Long-Run Analyais." Pacific Basin Finance Journal. 4 {July 1996b), 153-180. Loughran, T.; J. Riiter; and K- Rydqvi.si. "Initial Public Offerings: International In.sights." Pacific Basin Finance Journal, 2 (May 1994), 165-199. Ritter, J. R. 'The Long Run Perfomiance of Initial Public Offerings." Journal of Finance, 46 (March 1991), 3-27. Rock, K. "Why New Issues are Underpriced." Journal of Financial Economics, 15 (Jan./Feb. 1986), 187-212. Saunders, A.,and J. Lim. "Underpricing and the New Issue Process in Singapore." Journal of Banking and Finance. !4 (Aug. 1990). 291-309. Welch, I. "Sequential Sales, Learning and Cascades." Journal of Finance. 47 (June 1992), 695-732. White, H. "A Heterosceda.sticity-Consistent Covariance Matrix Estimator and a Direct Test for Het- eroscedasticity." Econometrica, 48 (May 1980). 817-838.