Download as PDF, PPTX


![Appendix III:
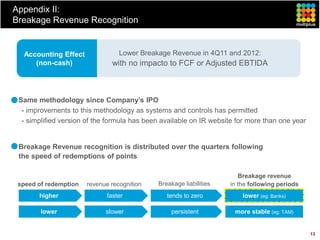
Air tickets pricing model
Flights with Flights with
Simple and high load factor low load factor
robust model
Unit cost = [Revenue Displacement + Marginal Cost] / # of points
Unit cost of standard redemptions
DEC/11: periodic review
FEB/10: R$622M prepayment (~10% reduction)
(~13% discount)
Unit Cost (R$)
AUG/10: R$400M prepayment
(~4% discount)
Jan
Jun
Jul
Jan
Jun
Jul
Jan
Jun
Jul
Aug
Feb
Aug
Sep
Feb
May
Aug
Sep
Feb
Sep
Apr
May
Oct
Oct
Nov
Dec
Apr
Nov
Dec
Apr
May
Oct
Nov
Dec
Mar
Mar
Mar
2010 2011 2012
Contractual cost (model) Cost after commercial discounts (prepayments)
NOTE: assuming current unit cost for 2012
14](https://image.slidesharecdn.com/120214-investorpresentationfull-120305115110-phpapp01/85/Investor-Presentation-February-2012-14-320.jpg)
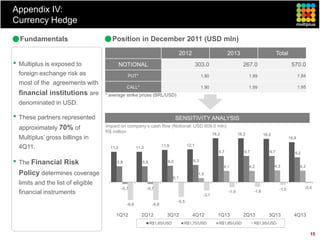

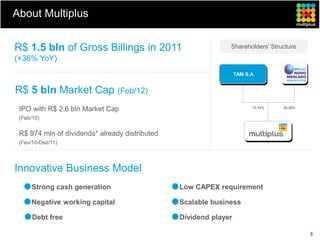
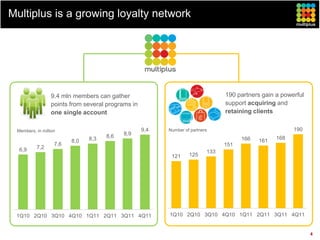
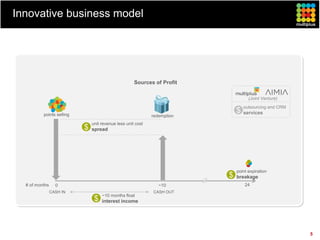
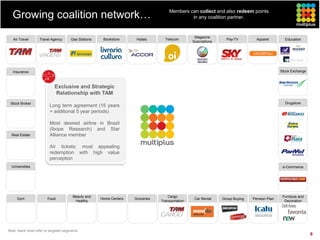
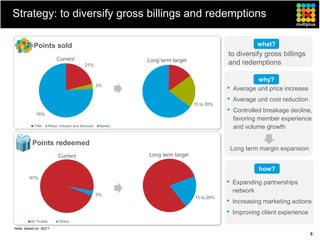
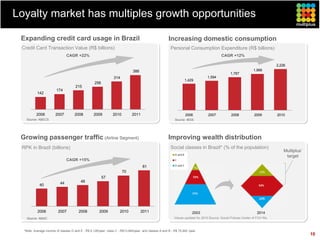
This investor presentation summarizes Multiplus S.A., a loyalty program company. It discusses Multiplus' growth in gross billings and market capitalization. Multiplus has an innovative business model with strong cash generation, low capital expenditures, and scalability. The presentation outlines Multiplus' strategy to diversify its sources of points sold and redemptions to different industry partners to control costs and breakage while improving the member experience.


