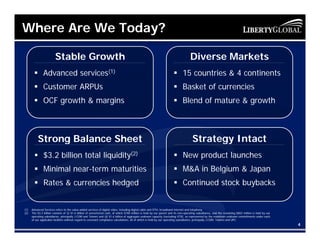
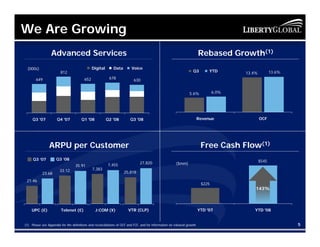
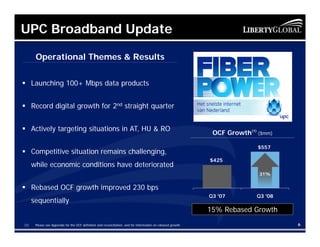
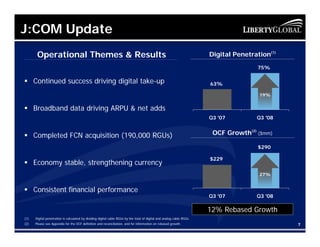
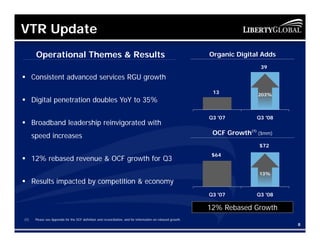
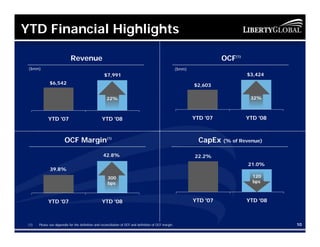
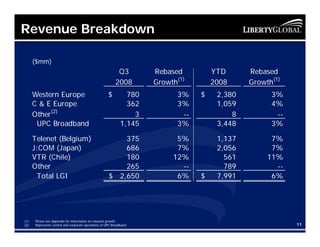
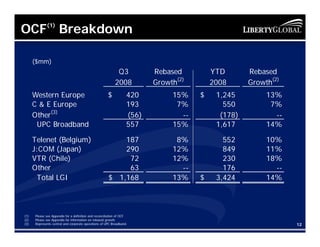
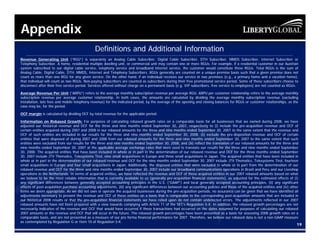
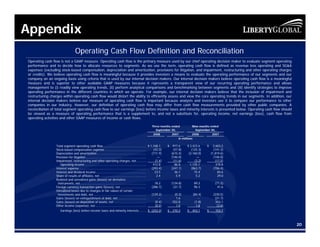
This document provides an overview and agenda for Liberty Global's 3rd Quarter 2008 Investor Call. It begins with introductory remarks noting the company's stable growth, diverse markets, and intact strategy. The agenda outlines sections on operating updates, financial results, and Q&A. Under operating updates, it summarizes key metrics and trends for UPC Broadband, J:COM, VTR and other segments. The financial results section reviews revenue, operating cash flow, capital expenditures, balance sheet, debt amortization schedule and conclusions. It directs readers to an appendix for definitions of terms used.
I risultati di TIM per il primo trimestre 2020, illustrati in webcast e conference call il 19 maggio 2020.
TIM 2020 First Quarter Results, presented on May 19, 2020, via webcast and conference call.
In this 68 page in-depth report we analyze the market demand share for global SVOD platforms, digital original series popularity and genre demand share trends in 10 global markets.
NO1 Uk Black Magic Specialist Expert In Sahiwal, Okara, Hafizabad, Mandi Bah...Amil Baba Dawood bangali
Contact with Dawood Bhai Just call on +92322-6382012 and we'll help you. We'll solve all your problems within 12 to 24 hours and with 101% guarantee and with astrology systematic. If you want to take any personal or professional advice then also you can call us on +92322-6382012 , ONLINE LOVE PROBLEM & Other all types of Daily Life Problem's.Then CALL or WHATSAPP us on +92322-6382012 and Get all these problems solutions here by Amil Baba DAWOOD BANGALI
#vashikaranspecialist #astrologer #palmistry #amliyaat #taweez #manpasandshadi #horoscope #spiritual #lovelife #lovespell #marriagespell#aamilbabainpakistan #amilbabainkarachi #powerfullblackmagicspell #kalajadumantarspecialist #realamilbaba #AmilbabainPakistan #astrologerincanada #astrologerindubai #lovespellsmaster #kalajaduspecialist #lovespellsthatwork #aamilbabainlahore#blackmagicformarriage #aamilbaba #kalajadu #kalailam #taweez #wazifaexpert #jadumantar #vashikaranspecialist #astrologer #palmistry #amliyaat #taweez #manpasandshadi #horoscope #spiritual #lovelife #lovespell #marriagespell#aamilbabainpakistan #amilbabainkarachi #powerfullblackmagicspell #kalajadumantarspecialist #realamilbaba #AmilbabainPakistan #astrologerincanada #astrologerindubai #lovespellsmaster #kalajaduspecialist #lovespellsthatwork #aamilbabainlahore #blackmagicforlove #blackmagicformarriage #aamilbaba #kalajadu #kalailam #taweez #wazifaexpert #jadumantar #vashikaranspecialist #astrologer #palmistry #amliyaat #taweez #manpasandshadi #horoscope #spiritual #lovelife #lovespell #marriagespell#aamilbabainpakistan #amilbabainkarachi #powerfullblackmagicspell #kalajadumantarspecialist #realamilbaba #AmilbabainPakistan #astrologerincanada #astrologerindubai #lovespellsmaster #kalajaduspecialist #lovespellsthatwork #aamilbabainlahore #Amilbabainuk #amilbabainspain #amilbabaindubai #Amilbabainnorway #amilbabainkrachi #amilbabainlahore #amilbabaingujranwalan #amilbabainislamabad
If you are looking for a pi coin investor. Then look no further because I have the right one he is a pi vendor (he buy and resell to whales in China). I met him on a crypto conference and ever since I and my friends have sold more than 10k pi coins to him And he bought all and still want more. I will drop his telegram handle below just send him a message.
@Pi_vendor_247
Turin Startup Ecosystem 2024 - Ricerca sulle Startup e il Sistema dell'Innov...Quotidiano Piemontese
Turin Startup Ecosystem 2024
Una ricerca de il Club degli Investitori, in collaborazione con ToTeM Torino Tech Map e con il supporto della ESCP Business School e di Growth Capital
how can i use my minded pi coins I need some funds.DOT TECH
If you are interested in selling your pi coins, i have a verified pi merchant, who buys pi coins and resell them to exchanges looking forward to hold till mainnet launch.
Because the core team has announced that pi network will not be doing any pre-sale. The only way exchanges like huobi, bitmart and hotbit can get pi is by buying from miners.
Now a merchant stands in between these exchanges and the miners. As a link to make transactions smooth. Because right now in the enclosed mainnet you can't sell pi coins your self. You need the help of a merchant,
i will leave the telegram contact of my personal pi merchant below. 👇 I and my friends has traded more than 3000pi coins with him successfully.
@Pi_vendor_247
how to sell pi coins in all Africa Countries.DOT TECH
Yes. You can sell your pi network for other cryptocurrencies like Bitcoin, usdt , Ethereum and other currencies And this is done easily with the help from a pi merchant.
What is a pi merchant ?
Since pi is not launched yet in any exchange. The only way you can sell right now is through merchants.
A verified Pi merchant is someone who buys pi network coins from miners and resell them to investors looking forward to hold massive quantities of pi coins before mainnet launch in 2026.
I will leave the telegram contact of my personal pi merchant to trade with.
@Pi_vendor_247
NO1 Uk Divorce problem uk all amil baba in karachi,lahore,pakistan talaq ka m...Amil Baba Dawood bangali
Contact with Dawood Bhai Just call on +92322-6382012 and we'll help you. We'll solve all your problems within 12 to 24 hours and with 101% guarantee and with astrology systematic. If you want to take any personal or professional advice then also you can call us on +92322-6382012 , ONLINE LOVE PROBLEM & Other all types of Daily Life Problem's.Then CALL or WHATSAPP us on +92322-6382012 and Get all these problems solutions here by Amil Baba DAWOOD BANGALI
#vashikaranspecialist #astrologer #palmistry #amliyaat #taweez #manpasandshadi #horoscope #spiritual #lovelife #lovespell #marriagespell#aamilbabainpakistan #amilbabainkarachi #powerfullblackmagicspell #kalajadumantarspecialist #realamilbaba #AmilbabainPakistan #astrologerincanada #astrologerindubai #lovespellsmaster #kalajaduspecialist #lovespellsthatwork #aamilbabainlahore#blackmagicformarriage #aamilbaba #kalajadu #kalailam #taweez #wazifaexpert #jadumantar #vashikaranspecialist #astrologer #palmistry #amliyaat #taweez #manpasandshadi #horoscope #spiritual #lovelife #lovespell #marriagespell#aamilbabainpakistan #amilbabainkarachi #powerfullblackmagicspell #kalajadumantarspecialist #realamilbaba #AmilbabainPakistan #astrologerincanada #astrologerindubai #lovespellsmaster #kalajaduspecialist #lovespellsthatwork #aamilbabainlahore #blackmagicforlove #blackmagicformarriage #aamilbaba #kalajadu #kalailam #taweez #wazifaexpert #jadumantar #vashikaranspecialist #astrologer #palmistry #amliyaat #taweez #manpasandshadi #horoscope #spiritual #lovelife #lovespell #marriagespell#aamilbabainpakistan #amilbabainkarachi #powerfullblackmagicspell #kalajadumantarspecialist #realamilbaba #AmilbabainPakistan #astrologerincanada #astrologerindubai #lovespellsmaster #kalajaduspecialist #lovespellsthatwork #aamilbabainlahore #Amilbabainuk #amilbabainspain #amilbabaindubai #Amilbabainnorway #amilbabainkrachi #amilbabainlahore #amilbabaingujranwalan #amilbabainislamabad
USDA Loans in California: A Comprehensive Overview.pptxmarketing367770
USDA Loans in California: A Comprehensive Overview
If you're dreaming of owning a home in California's rural or suburban areas, a USDA loan might be the perfect solution. The U.S. Department of Agriculture (USDA) offers these loans to help low-to-moderate-income individuals and families achieve homeownership.
Key Features of USDA Loans:
Zero Down Payment: USDA loans require no down payment, making homeownership more accessible.
Competitive Interest Rates: These loans often come with lower interest rates compared to conventional loans.
Flexible Credit Requirements: USDA loans have more lenient credit score requirements, helping those with less-than-perfect credit.
Guaranteed Loan Program: The USDA guarantees a portion of the loan, reducing risk for lenders and expanding borrowing options.
Eligibility Criteria:
Location: The property must be located in a USDA-designated rural or suburban area. Many areas in California qualify.
Income Limits: Applicants must meet income guidelines, which vary by region and household size.
Primary Residence: The home must be used as the borrower's primary residence.
Application Process:
Find a USDA-Approved Lender: Not all lenders offer USDA loans, so it's essential to choose one approved by the USDA.
Pre-Qualification: Determine your eligibility and the amount you can borrow.
Property Search: Look for properties in eligible rural or suburban areas.
Loan Application: Submit your application, including financial and personal information.
Processing and Approval: The lender and USDA will review your application. If approved, you can proceed to closing.
USDA loans are an excellent option for those looking to buy a home in California's rural and suburban areas. With no down payment and flexible requirements, these loans make homeownership more attainable for many families. Explore your eligibility today and take the first step toward owning your dream home.
US Economic Outlook - Being Decided - M Capital Group August 2021.pdfpchutichetpong
The U.S. economy is continuing its impressive recovery from the COVID-19 pandemic and not slowing down despite re-occurring bumps. The U.S. savings rate reached its highest ever recorded level at 34% in April 2020 and Americans seem ready to spend. The sectors that had been hurt the most by the pandemic specifically reduced consumer spending, like retail, leisure, hospitality, and travel, are now experiencing massive growth in revenue and job openings.
Could this growth lead to a “Roaring Twenties”? As quickly as the U.S. economy contracted, experiencing a 9.1% drop in economic output relative to the business cycle in Q2 2020, the largest in recorded history, it has rebounded beyond expectations. This surprising growth seems to be fueled by the U.S. government’s aggressive fiscal and monetary policies, and an increase in consumer spending as mobility restrictions are lifted. Unemployment rates between June 2020 and June 2021 decreased by 5.2%, while the demand for labor is increasing, coupled with increasing wages to incentivize Americans to rejoin the labor force. Schools and businesses are expected to fully reopen soon. In parallel, vaccination rates across the country and the world continue to rise, with full vaccination rates of 50% and 14.8% respectively.
However, it is not completely smooth sailing from here. According to M Capital Group, the main risks that threaten the continued growth of the U.S. economy are inflation, unsettled trade relations, and another wave of Covid-19 mutations that could shut down the world again. Have we learned from the past year of COVID-19 and adapted our economy accordingly?
“In order for the U.S. economy to continue growing, whether there is another wave or not, the U.S. needs to focus on diversifying supply chains, supporting business investment, and maintaining consumer spending,” says Grace Feeley, a research analyst at M Capital Group.
While the economic indicators are positive, the risks are coming closer to manifesting and threatening such growth. The new variants spreading throughout the world, Delta, Lambda, and Gamma, are vaccine-resistant and muddy the predictions made about the economy and health of the country. These variants bring back the feeling of uncertainty that has wreaked havoc not only on the stock market but the mindset of people around the world. MCG provides unique insight on how to mitigate these risks to possibly ensure a bright economic future.
how to swap pi coins to foreign currency withdrawable.DOT TECH
As of my last update, Pi is still in the testing phase and is not tradable on any exchanges.
However, Pi Network has announced plans to launch its Testnet and Mainnet in the future, which may include listing Pi on exchanges.
The current method for selling pi coins involves exchanging them with a pi vendor who purchases pi coins for investment reasons.
If you want to sell your pi coins, reach out to a pi vendor and sell them to anyone looking to sell pi coins from any country around the globe.
Below is the contact information for my personal pi vendor.
Telegram: @Pi_vendor_247
Latino Buying Power - May 2024 Presentation for Latino CaucusDanay Escanaverino
Unlock the potential of Latino Buying Power with this in-depth SlideShare presentation. Explore how the Latino consumer market is transforming the American economy, driven by their significant buying power, entrepreneurial contributions, and growing influence across various sectors.
**Key Sections Covered:**
1. **Economic Impact:** Understand the profound economic impact of Latino consumers on the U.S. economy. Discover how their increasing purchasing power is fueling growth in key industries and contributing to national economic prosperity.
2. **Buying Power:** Dive into detailed analyses of Latino buying power, including its growth trends, key drivers, and projections for the future. Learn how this influential group’s spending habits are shaping market dynamics and creating opportunities for businesses.
3. **Entrepreneurial Contributions:** Explore the entrepreneurial spirit within the Latino community. Examine how Latino-owned businesses are thriving and contributing to job creation, innovation, and economic diversification.
4. **Workforce Statistics:** Gain insights into the role of Latino workers in the American labor market. Review statistics on employment rates, occupational distribution, and the economic contributions of Latino professionals across various industries.
5. **Media Consumption:** Understand the media consumption habits of Latino audiences. Discover their preferences for digital platforms, television, radio, and social media. Learn how these consumption patterns are influencing advertising strategies and media content.
6. **Education:** Examine the educational achievements and challenges within the Latino community. Review statistics on enrollment, graduation rates, and fields of study. Understand the implications of education on economic mobility and workforce readiness.
7. **Home Ownership:** Explore trends in Latino home ownership. Understand the factors driving home buying decisions, the challenges faced by Latino homeowners, and the impact of home ownership on community stability and economic growth.
This SlideShare provides valuable insights for marketers, business owners, policymakers, and anyone interested in the economic influence of the Latino community. By understanding the various facets of Latino buying power, you can effectively engage with this dynamic and growing market segment.
Equip yourself with the knowledge to leverage Latino buying power, tap into their entrepreneurial spirit, and connect with their unique cultural and consumer preferences. Drive your business success by embracing the economic potential of Latino consumers.
**Keywords:** Latino buying power, economic impact, entrepreneurial contributions, workforce statistics, media consumption, education, home ownership, Latino market, Hispanic buying power, Latino purchasing power.
how to sell pi coins effectively (from 50 - 100k pi)DOT TECH
Anywhere in the world, including Africa, America, and Europe, you can sell Pi Network Coins online and receive cash through online payment options.
Pi has not yet been launched on any exchange because we are currently using the confined Mainnet. The planned launch date for Pi is June 28, 2026.
Reselling to investors who want to hold until the mainnet launch in 2026 is currently the sole way to sell.
Consequently, right now. All you need to do is select the right pi network provider.
Who is a pi merchant?
An individual who buys coins from miners on the pi network and resells them to investors hoping to hang onto them until the mainnet is launched is known as a pi merchant.
debuts.
I'll provide you the Telegram username
@Pi_vendor_247
2. “Safe Harbor”
Safe Harbor Statement Under the Private Securities Litigation Reform Act of 1995:
Forward-Looking Statements: The following slides contain forward-looking statements within the meaning of the Private
Securities Litigation Reform Act of 1995, including our expectations with respect to our 2008 guidance targets, our future
g
growth prospects, including our continued ability to generate free cash flow, expand our RGUs and increase our ARPU per
pp , g y g ,p p
customer, and our liquidity, including our ability to repay near-term debt amortizations, the performance of our currency
hedges and our borrowing availability; our expectations with respect to the timing and impact of our roll-out of digital and
broadband products and services; our insight and expectations regarding competitive and economic factors in our markets;
the impact of our M&A activity on our operations and financial performance; our expectations concerning future repurchases
of our stock; and other information and statements that are not historical fact. These forward-looking statements involve
certain risks and uncertainties that could cause actual results to differ materially from those expressed or implied by these
statements. These risks and uncertainties include the continued use by subscribers and potential subscribers of the Company's
services and willingness to upgrade to our more advanced offerings, our ability to meet challenges from competition and
economic factors, the continued growth in services for digital television at a reasonable cost, the effects of changes in
technology and regulation, our ability to achieve expected operational efficiencies and economies of scale, our ability to
generate expected revenue and operating cash flow, control capital expenditures as measured by percentage of revenue and
achieve assumed margins our ability to access cash of our subsidiaries and the impact of our future financial performance or
margins, performance,
market conditions generally, on the availability, terms and deployment of capital, as well as other factors detailed from time to
time in the Company's filings with the Securities and Exchange Commission including our most recently filed Forms 10-K and
10-Q. These forward-looking statements speak only as of the date of this presentation. The Company expressly disclaims any
obligation or undertaking to disseminate any updates or revisions to any forward-looking statement contained herein to reflect
any change in the Company's expectations with regard thereto or any change in events, conditions or circumstances on which
any such statement is based
based.
Additional Information Relating to Defined Terms:
Please refer to the Appendix at the end of this presentation, as well as the Company’s Press Release dated November 5, 2008
and SEC filings, for definitions of the following terms which may be used herein including: Rebased Growth, Operating Cash
Flow (“OCF”), Free Cash Flow (“FCF”), Revenue Generating Units (“RGUs”), Average Revenue per Unit (“ARPU”), and OCF
Margin, as well as GAAP reconciliations, where applicable.
2
3. Agenda
O
Operating Update
ti U d t
Financial Results
Q&A
3
4. Where Are We Today?
Stable Growth Diverse Markets
Advanced services(1) 15 countries & 4 continents
Customer ARPUs Basket of currencies
OCF growth & margins Blend of mature & growth
Strategy Intact
Strong Balance Sheet
New product launches
$3.2 billion total liquidity(2)
M&A in Belgium & Japan
Minimal near term maturities
near-term
Continued stock buybacks
Rates & currencies hedged
(1) Advanced Services refers to the value-added services of digital video, including digital cable and DTH, broadband internet and telephony.
(2) The $3.2 billion consists of (i) $1.6 billion of unrestricted cash, of which $780 million is held by our parent and its non-operating subsidiaries, and the remaining $802 million is held by our
operating subsidiaries, principally J:COM and Telenet and (ii) $1.6 billion of aggregate undrawn capacity (excluding VTR), as represented by the maximum undrawn commitments under each
of our applicable facilities without regard to covenant compliance calculations, all of which is held by our operating subsidiaries, principally J:COM, Telenet and UPC.
4
5. We Are Growing
Advanced Services Rebased Growth(1)
Digital Data Voice
(000s)
Q3 YTD 13.6%
812 13.4%
678
652
649 630
214 6.0%
154 125 5.6%
182
190
Revenue OCF
Q3 '07 Q4 '07 Q1 '08 Q2 '08 Q3 '08
Free Cash Flow(1)
ARPU per Customer
Q3 ’08
Q3 ’07 $545
27,820 ($mm)
7,455
35.91
7,383
33.12
33 12 25,818
23.68
21.46
$225
143%
YTD '07 YTD '08
VTR (CLP)
UPC (€) Telenet (€) J:COM (¥)
5
(1) Please see Appendix for the definitions and reconciliations of OCF and FCF, and for information on rebased growth.
6. UPC Broadband Update
Operational Themes & Results
Launching 100+ Mbps data products
Record digital growth for 2nd straight quarter
Actively targeting situations in AT, HU & RO
OCF Growth(1) ($mm)
$557
Competitive situation remains challenging,
$425
while economic conditions have deteriorated
31%
Rebased OCF growth improved 230 bps
Q3 '07 Q3 '08
sequentially
15% Rebased Growth
6
(1) Please see Appendix for the OCF definition and reconciliation, and for information on rebased growth.
7. J:COM Update
Operational Themes & Results Digital Penetration(1)
75%
Continued success driving digital take-up 63%
19%
Broadband data driving ARPU & net adds
Q3 '07 Q3 '08
OCF Growth(2) ($mm)
Completed FCN acquisition (190,000 RGUs)
p q ( , )
$290
$229
Economy stable, strengthening currency
27%
Consistent financial performance
Q3 '07 Q3 '08
12% Rebased Growth
(1) Digital penetration is calculated by dividing digital cable RGUs by the total of digital and analog cable RGUs.
(2) Please see Appendix for the OCF definition and reconciliation, and for information on rebased growth. 7
8. VTR Update
Operational Themes & Results Organic Digital Adds
39
Consistent advanced services RGU growth
13 203%
Digital penetration doubles YoY to 35%
Q3 '07 Q3 '08
Broadband leadership reinvigorated with
OCF Growth(1) ($mm)
speed increases
p
$72
$64
12% rebased revenue & OCF growth for Q3
13%
Results impacted by competition & economy
Q3 '07 Q3 '08
12% Rebased Growth
(1) Please see Appendix for the OCF definition and reconciliation, and for information on rebased growth.
8
10. YTD Financial Highlights
Revenue OCF(1)
($mm) ($mm)
$3,424
$,
$7,991
$6,542 $2,603
32%
22%
YTD '07 YTD '08
YTD '07 YTD '08
OCF Margin(1) CapEx (% of R
f Revenue)
)
42.8% 22.2%
21.0%
39.8%
120
300
bps
bps
YTD '07
07 YTD '08
08
YTD '07
07 YTD '08
08
10
(1) Please see Appendix for the definition and reconciliation of OCF and definition of OCF margin.
11. Revenue Breakdown
($mm)
Q3 Rebased YTD Rebased
(1) (1)
2008 Growth 2008 Growth
Western Europe $ 780 3% $ 2,380 3%
C & E Europe 362 3% 1,059 4%
(2)
Other 3 -- 8 --
UPC Broadband 1,145 3% 3,448 3%
Telenet (Belgium) 375 5% 1,137
1 137 7%
J:COM (Japan) 686 7% 2,056 7%
VTR (Chile) 180 12% 561 11%
Other 265 -- 789 --
Total LGI $ 2,650 6% $ 7,991 6%
(1) Please see Appendix for information on rebased growth.
11
(2) Represents central and corporate operations of UPC Broadband.
12. OCF Breakdown(1)
($mm)
Q3 Rebased YTD Rebased
Growth(2) Growth(2)
2008 2008
Western Europe $ 420 15% $ 1,245 13%
C & E Europe
p 193 7% 550 7%
Other(3) (56) -- (178) --
UPC Broadband 557 15% 1,617 14%
Telenet (Belgium) 187 8% 552 10%
J:COM (Japan) 290 12% 849 11%
VTR (Chile) 72 12% 230 18%
Other 63 -- 176 --
Total LGI $ 1,168 13% $ 3,424 14%
(1) Please see Appendix for a definition and reconciliation of OCF.
(2) Please see Appendix for information on rebased growth.
(3) Represents central and corporate operations of UPC Broadband. 12
13. FCF(1) Progression
2007 2008
($mm)
$545
$318
$225
$128 $125
$100
$58 $42
Q1 Q2 Q3 YTD
FCF Expected to Increase Meaningfully in Q4 ’08
13
(1) Please see appendix for definition of FCF and for reconciliation.
14. Balance Sheet Snapshot
For periods ended 2008
Adj. Sept 30(3)
June 30 Sept 30
($mm)
Total Debt $ 19,786 $ 19,262 $ 18,317
T t l Cash(1)
Total C h (1,691) (2,057) (2,057)
Net Debt $ 18,095 $ 17,205 $ 16,260
Gross Leverage(2)
()
4.3x
4 3x 4.1x
4 1x 3.9x
3 9x
Net Leverage(2) 3.9x 3.7x 3.5x
Gross & Net Leverage Ratios Trending Lower
(1) Cash includes restricted cash related to our debt instruments of approximately $480 million at June 30, 2008 and $476 million at September 30, 2008.
(2) Gross and Net Leverage equals total and net debt, respectively, divided by annualized OCF for the three months ended as of the date indicated.
14
(3) Adjusted September 30 excludes our debt related to our borrowings against our News Corp. and Sumitomo shares.
15. Capital Structure Review
Significant consolidated liquidity (cash & borrowing capacity)
Financial leverage at low-end of target range
Floating interest rates & currencies hedged on debt
Diversified base of lenders & counterparties
Positive FCF at key credit groups
Long-term maturity profile
15
16. (1)
Debt Amortization Schedule
Total debt & capital leases of $19.3 bn
($bn)
$14
$12.6
(2)
UPC VTR Telenet J:COM Austar Other
$12
$10
$8
$6
$4
$2.4 $2.2
$2 $1.2
$0.4 $0.3
$0.1
$0
$
Q4 2008 2009 2010 2011 2012 2013 Thereafter
Limited Near-Term Amortizations
Near Term
(1) Includes principal amount of capital leases.
16
(2) UPC excludes VTR.
17. Conclusions
Driving penetrations of high-ARPU advanced services
gp g
14% rebased OCF growth YTD & record OCF margin in Q3
% ebased OC g o t eco d OC ag
Positioned to weather extension of current credit environment
Balancing liquidity & commitment to levered equity strategy
17
19. Appendix
Definitions and Additional Information
f d dd lf
Revenue Generating Unit (“RGU”) is separately an Analog Cable Subscriber, Digital Cable Subscriber, DTH Subscriber, MMDS Subscriber, Internet Subscriber or
Telephony Subscriber. A home, residential multiple dwelling unit, or commercial unit may contain one or more RGUs. For example, if a residential customer in our Austrian
system subscribed to our digital cable service, telephony service and broadband internet service, the customer would constitute three RGUs. Total RGUs is the sum of
Analog Cable, Digital Cable, DTH, MMDS, Internet and Telephony Subscribers. RGUs generally are counted on a unique premise basis such that a given premise does not
count as more than one RGU for any given service On the other hand if an individual receives our service in two premises (e g a primary home and a vacation home)
service. hand, (e.g., home),
that individual will count as two RGUs. Non-paying subscribers are counted as subscribers during their free promotional service period. Some of these subscribers choose to
disconnect after their free service period. Services offered without charge on a permanent basis (e.g. VIP subscribers, free service to employees) are not counted as RGUs.
Average Revenue Per Unit (“ARPU”) refers to the average monthly subscription revenue per average RGU. ARPU per customer relationship refers to the average monthly
subscription revenue per average customer relationship. In both cases, the amounts are calculated by dividing the average monthly subscription revenue (excluding
installation, late fees and mobile telephony revenue) for the indicated period, by the average of the opening and closing balances for RGUs or customer relationships, as the
case may be, for the period.
y, p
OCF margin is calculated by dividing OCF by total revenue for the applicable period.
Information on Rebased Growth: For purposes of calculating rebased growth rates on a comparable basis for all businesses that we owned during 2008, we have
adjusted our historical revenue and OCF for the three and nine months ended September 30, 2007, respectively to (i) include the pre-acquisition revenue and OCF of
certain entities acquired during 2007 and 2008 in our rebased amounts for the three and nine months ended September 30, 2007 to the same extent that the revenue and
OCF of such entities are included in our results for the three and nine months ended September 30, 2008, (ii) exclude the pre-disposition revenue and OCF of certain
entities that were disposed of during 2007 and 2008 from our rebased amounts for the three and nine months ended September 30 2007 to the same extent that such
30,
entities were excluded from our results for the three and nine months ended September 30, 2008, and (iii) reflect the translation of our rebased amounts for the three and
nine months ended September 30, 2007 at the applicable average exchange rates that were used to translate our results for the three and nine months ended September
30, 2008. The acquired entities that have been included in whole or in part in the determination of our rebased revenue and OCF for the three months ended September
30, 2007 include JTV Thematics, Telesystems Tirol, nine small acquisitions in Europe and three small acquisitions in Japan. The acquired entities that have been included in
whole or in part in the determination of our rebased revenue and OCF for the nine months ended September 30, 2007 include JTV Thematics, Telesystems Tirol, fourteen
small acquisitions in Europe and four small acquisitions in Japan. Additionally, the disposed entities that were excluded in whole or in part from the determination of our
rebased revenue and OCF for the three and nine months ended September 30 2007 include our broadband communications operations in Brazil and Peru and our Liveshop
30,
operations in the Netherlands. In terms of acquired entities, we have reflected the revenue and OCF of these acquired entities in our 2007 rebased amounts based on what
we believe to be the most reliable information that is currently available to us (generally pre-acquisition financial statements), as adjusted for the estimated effects of (i)
any significant differences between generally accepted accounting principles in the U.S. (“GAAP”) and local generally accepted accounting principles, (ii) any significant
effects of post-acquisition purchase accounting adjustments, (iii) any significant differences between our accounting policies and those of the acquired entities and (iv) other
items we deem appropriate. As we did not own or operate the acquired businesses during the pre-acquisition periods, no assurance can be given that we have identified all
adjustments necessary to present the revenue and OCF of these entities on a basis that is comparable to the corresponding post-acquisition amounts that are included in
our historical 2008 results or that the pre-acquisition financial statements we have relied upon do not contain undetected errors. The adjustments reflected in our 2007
p q p j
rebased amounts have not been prepared with a view towards complying with Article 11 of the SEC's Regulation S-X. In addition, the rebased growth percentages are not
necessarily indicative of the revenue and OCF that would have occurred if these transactions had occurred on the dates assumed for purposes of calculating our rebased
2007 amounts or the revenue and OCF that will occur in the future. The rebased growth percentages have been presented as a basis for assessing 2008 growth rates on a
comparable basis, and are not presented as a measure of our pro forma financial performance for 2007. Therefore, we believe our rebased data is not a non-GAAP measure
as contemplated by Regulation G or Item 10 of Regulation S-K.
19
20. Appendix
Operating Cash Flow Definition and Reconciliation
Operating cash flow is not a GAAP measure. Operating cash flow is the primary measure used by our chief operating decision maker to evaluate segment operating
performance and to decide how to allocate resources to segments. As we use the term, operating cash flow is defined as revenue less operating and SG&A
expenses (excluding stock-based compensation, depreciation and amortization, provisions for litigation, and impairment, restructuring and other operating charges
or credits). We believe operating cash flow is meaningful because it provides investors a means to evaluate the operating performance of our segments and our
company on an ongoing basis using criteria that is used by our internal decision makers. Our internal decision makers believe operating cash flow is a meaningful
measure and is superior to other available GAAP measures because it represents a transparent view of our recurring operating performance and allows
management to (i) readily view operating trends, (ii) perform analytical comparisons and benchmarking between segments and (iii) identify strategies to improve
operating performance in the different countries in which we operate. For example, our internal decision makers believe that the inclusion of impairment and
restructuring charges within operating cash flow would distort the ability to efficiently assess and view the core operating trends in our segments. In addition, our
internal decision makers believe our measure of operating cash flow is important because analysts and investors use it to compare our performance to other
companies in our industry. However, our definition of operating cash flow may differ from cash flow measurements provided by other public companies. A
reconciliation of total segment operating cash fl
ili i f l i h flow to our earnings (l ) b f
i (loss) before iincome taxes and minority i
d i i interests i presented b l
is d below. OOperating cash fl
i h flow should
h ld
be viewed as a measure of operating performance that is a supplement to, and not a substitute for, operating income, net earnings (loss), cash flow from
operating activities and other GAAP measures of income or cash flows.
Three months ended Nine months ended
September 30, September 30,
2008 2007 2008 2007
in millions
Total segment operating cash flow............................................... $ 1,168.1 $ 917.6 $ 3,423.6 $ 2,603.2
(42.0) (57.8) (125.3) (141.3)
Stock-based compensation expense .............................................
(711.9) (615.4) (2,160.0) (1,819.6)
Depreciation and amortization .....................................................
— (146.0) — (146.0)
Provision for litigation .................................................................
(1.4) (11.6) (3.2) (17.5)
Impairment, restructuring and other operating charges, net ...........
412.8 86.8 1,135.1 478.8
Operating income ..................................................................
(293.4) (247.1) (863.7) (706.4)
Interest expense ........................................................................
23.5 36.1 75.4 84.6
Interest and dividend income ......................................................
2.4 5.9 5.2 29.0
Share of results of affiliates, net ..................................................
Realized and unrealized gains (losses) on derivative
18.2 (134.8) 89.2 (71.2)
instruments, net .......................................................................
(286.7) (31.7) 96.3 41.6
Foreign currency transaction gains (losses), net ............................
Unrealized losses due to changes in fair values of certain
(129.2) (0.3) (84.4) (230.5)
investments and debt, net .........................................................
-- 1.6 -- (21.7)
Gains (losses) on extinguishment of debt, net ...............................
(0.4)
(0 4) 552.8
552 8 (1.8)
(1 8) 553.1
553 1
Gains (losses) on disposition of assets, net ...................................
G i (l ) di iti f t t
(0.5) 1.0 1.8 (3.6)
Other income (expense), net .......................................................
Earnings (loss) before income taxes and minority interests ........ $ (253.3) $ 270.3 $ 453.1 $ 153.7
20
21. Appendix
Free Cash Flow Definition and Reconciliation
FCF is defined as net cash provided by operating activities less capital expenditures, each as reported in our condensed consolidated statements of cash
flows. Adjusted FCF represents FCF less non-cash capital lease additions. FCF and Adjusted FCF are not GAAP measures of liquidity. We believe that our
presentation of FCF and Adjusted FCF provides useful information to our investors because these measures can be used to gauge our ability to service debt and
fund new investment opportunities. FCF should not be understood to represent our ability to fund discretionary amounts, as we have various mandatory and
pp p y y , y
contractual obligations, including debt repayments, which are not deducted to arrive at this amount. Investors should view FCF as a supplement to, and not a
substitute for, GAAP measures of liquidity included in our consolidated cash flow statements. The table below highlights the reconciliation of net cash provided by
operating activities to FCF and FCF to Adjusted FCF for the indicated periods.
Three months ended Nine months ended
September 30,
30 September 30,
30
2007(1)
2008
2007(1)
2008
in millions
Net cash provided by operating activities .................. $ 697.4 $ 624.7 $ 2,224.1 $ 1,675.9
Capital expenditures ............................................... (597.7) (499.4) (1,679.1) (1,451.2)
$ 99.7 $ 125.3 $ 545.0 $ 224.7
FCF ..................................................................
FCF ....................................................................... $ 99.7 $ 125.3 $ 545.0 $ 224.7
(37.4) (50.4) (109.0) (139.2)
Capital lease additions.............................................
Adjusted FCF ..................................................... $ 62.3 $ 74.9 $ 436.0 $ 85.5
(1) Our cash provided by operations for the three and nine months ended September 30, 2007 differs from the previously reported amounts due to the reclassification of cash flows
21
related to derivative instruments to align with the classification of the applicable underlying cash flows.