Download to read offline

![So, how do they work then?
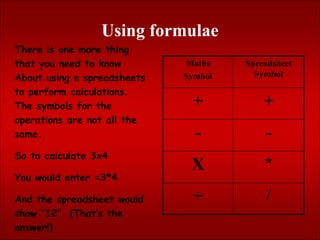
Rows
(Side to Side)
[Numbered]
Columns
(Up and Down)
[Letters]
Cell
(Every one on
these boxes is
a cell)
Every cell has a name to help you find the right one.
Its name starts with the column letter and then the row number.
So, this cell is called what?
F22](https://image.slidesharecdn.com/4-221219070017-c16910e6/85/introduction-to-SPREADSHEETS-pptx-4-320.jpg)
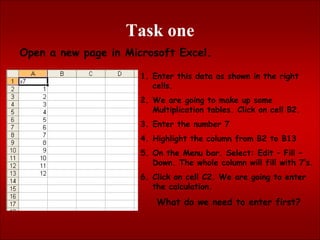
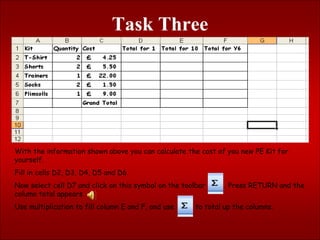


This document provides an introduction to using spreadsheets in Microsoft Excel. It explains that spreadsheets can organize information, perform calculations quickly, and store large amounts of data. The document then describes the basic components of a spreadsheet including rows, columns, and cells. It provides examples of entering basic data and using formulas with cell references and mathematical operators. Finally, it includes tasks for practicing creating tables, calculations, and a bar graph using sample student data.


![Spreadsheets[1]](https://cdn.slidesharecdn.com/ss_thumbnails/spreadsheets1-150131022908-conversion-gate01-thumbnail.jpg?width=640&height=640&fit=bounds)


