What’s
RapidMiner ?
• RapidMineris a Learning Environment, an
environment for machine learning, data
mining, text mining, predictive analytics, and
business analytics. It is used for research,
education, training, rapid prototyping,
application development, and industrial
applications.
• RapidMiner is one of the most popular
Machine Learning and Data Analytics
environments in the market. Thanks to its
newly introduced features, users can do basic
to advanced machine learning in Rapidminer.
3.
why
RapidMiner ?
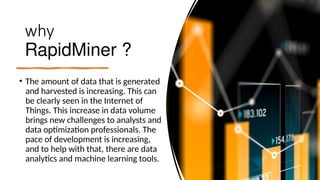
• Theamount of data that is generated
and harvested is increasing. This can
be clearly seen in the Internet of
Things. This increase in data volume
brings new challenges to analysts and
data optimization professionals. The
pace of development is increasing,
and to help with that, there are data
analytics and machine learning tools.
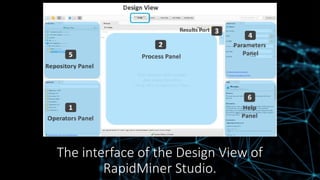
Design View (andResult View)
•You can select between the Design View and Results
View which are the most used views in this
application. Design view is where you can import and
prepare data, build and validate models, and apply
models. Results View is where you can view the
results of the process you built in the Design View
with data tables, statistics or visualizations.
6.
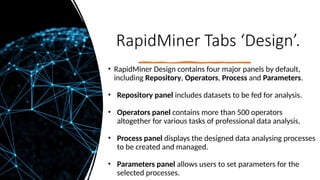
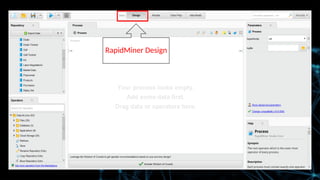
RapidMiner Tabs ‘Design’.
•RapidMiner Design contains four major panels by default,
including Repository, Operators, Process and Parameters.
• Repository panel includes datasets to be fed for analysis.
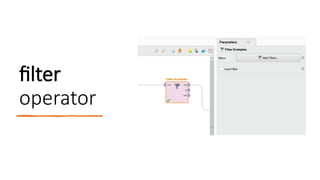
• Operators panel contains more than 500 operators
altogether for various tasks of professional data analysis.
• Process panel displays the designed data analysing processes
to be created and managed.
• Parameters panel allows users to set parameters for the
selected processes.
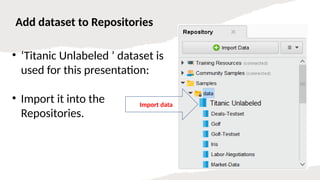
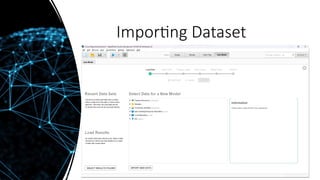
Add dataset toRepositories
• ‘Titanic Unlabeled ’ dataset is
used for this presentation:
• Import it into the
Repositories.
Import data
10.
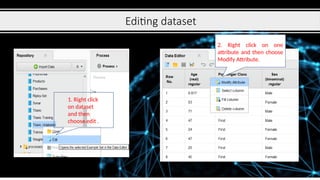
Editing dataset
1. Rightclick
on dataset
and then
choose edit .
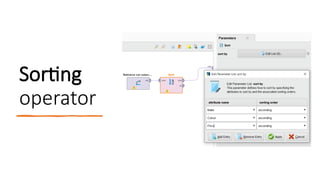
2. Right click on one
attribute and then choose
Modify Attribute.
11.
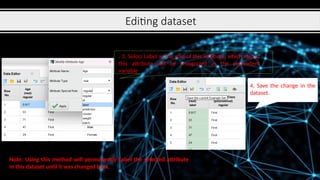
Editing dataset
. 3.Select Label as the role of this attribute, which means
this attribute will be recognized as the dependent
variable
4. Save the change in the
dataset.
Note: Using this method will permanently Label the selected attribute
in this dataset until it was changed back.
12.
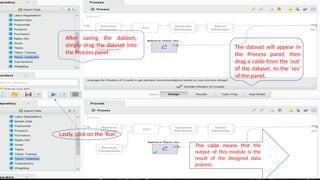
After saving thedataset,
simply drag the dataset into
the Process panel
The dataset will appear in
the Process panel, then
drag a cable from the ‘out’
of the dataset, to the ‘res’
of the panel.
Lastly, click on the ‘Run’.
This cable means that the
output of this module is the
result of the designed data
process.
13.
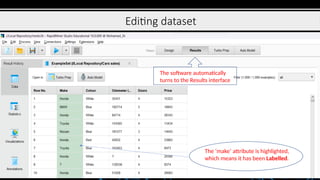
Editing dataset
The softwareautomatically
turns to the Results interface
The ‘make’ attribute is highlighted,
which means it has been Labelled.
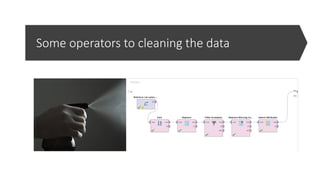
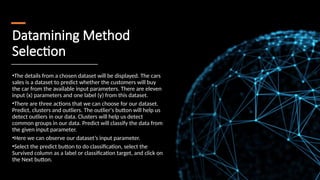
Datamining Method
Selection
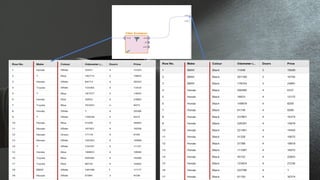
•The detailsfrom a chosen dataset will be displayed. The cars
sales is a dataset to predict whether the customers will buy
the car from the available input parameters. There are eleven
input (x) parameters and one label (y) from this dataset.
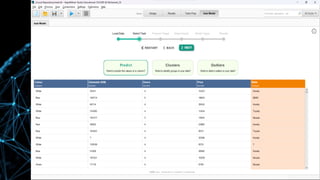
•There are three actions that we can choose for our dataset.
Predict, clusters and outliers. The outlier's button will help us
detect outliers in our data. Clusters will help us detect
common groups in our data. Predict will classify the data from
the given input parameter.
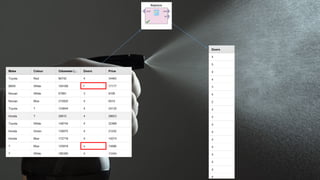
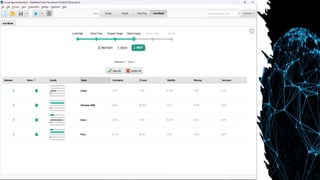
•Here we can observe our dataset’s input parameter.
•Select the predict button to do classification, select the
Survived column as a label or classification target, and click on
the Next button.
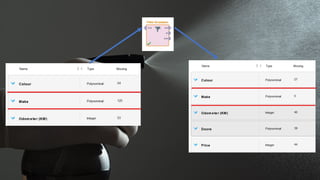
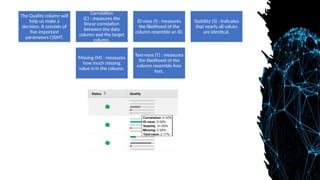
The Quality columnwill
help us make a
decision. It consists of
five important
parameters CISMT.
Correlation
(C) : measures the
linear correlation
between the data
column and the target
column.
ID-ness (I) : measures
the likelihood of the
column resemble an ID.
Stability (S) : Indicates
that nearly all values
are identical.
Missing (M) : measures
how much missing
value is in the column.
Text-ness (T) : measures
the likelihood of the
column resemble free
text.
34.
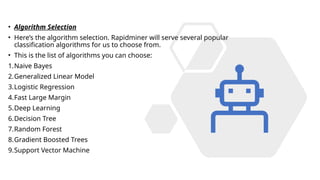
• Algorithm Selection
•Here’s the algorithm selection. Rapidminer will serve several popular
classification algorithms for us to choose from.
• This is the list of algorithms you can choose:
1.Naive Bayes
2.Generalized Linear Model
3.Logistic Regression
4.Fast Large Margin
5.Deep Learning
6.Decision Tree
7.Random Forest
8.Gradient Boosted Trees
9.Support Vector Machine
35.
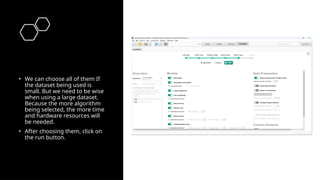
• We canchoose all of them If
the dataset being used is
small. But we need to be wise
when using a large dataset.
Because the more algorithm
being selected, the more time
and hardware resources will
be needed.
• After choosing them, click on
the run button.
36.
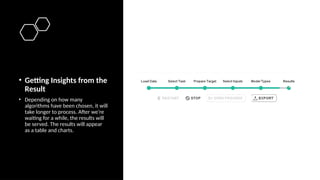
• Getting Insightsfrom the
Result
• Depending on how many
algorithms have been chosen, it will
take longer to process. After we’re
waiting for a while, the results will
be served. The results will appear
as a table and charts.
37.
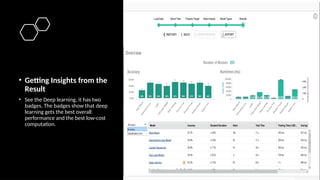
• Getting Insightsfrom the
Result
• See the Deep learning, it has two
badges. The badges show that deep
learning gets the best overall
performance and the best low-cost
computation.
38.
• Exporting Result
•Imagine if we have to prepare our data manually and create the
classification code with a deep learning algorithm. That one itself
must be taken so many hours to code. It’s only one algorithm, how
about coding all of them and create the visualizations.
• In just ten minutes we have already finished our data mining
process without the fuss to code them from the ground up. All we
have to do is to click the Next button and finish.
39.
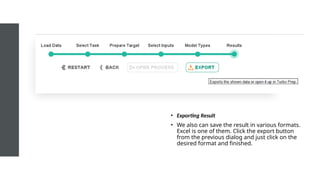
• Exporting Result
•We also can save the result in various formats.
Excel is one of them. Click the export button
from the previous dialog and just click on the
desired format and finished.
40.
• Conclusion
• No-codedevelopment platforms can greatly simplify data mining works
• Rapidminer is one of the tools that are effective for data mining tasks and safe a lot of
times.
• Rapidminer also includes data pre-processing and algorithms selection
• At the end of the task, rapidminer will serve visualizations for us to get an insight.
• All the tasks done in rapidminer are so effortless compared to manual coding.