Download to read offline


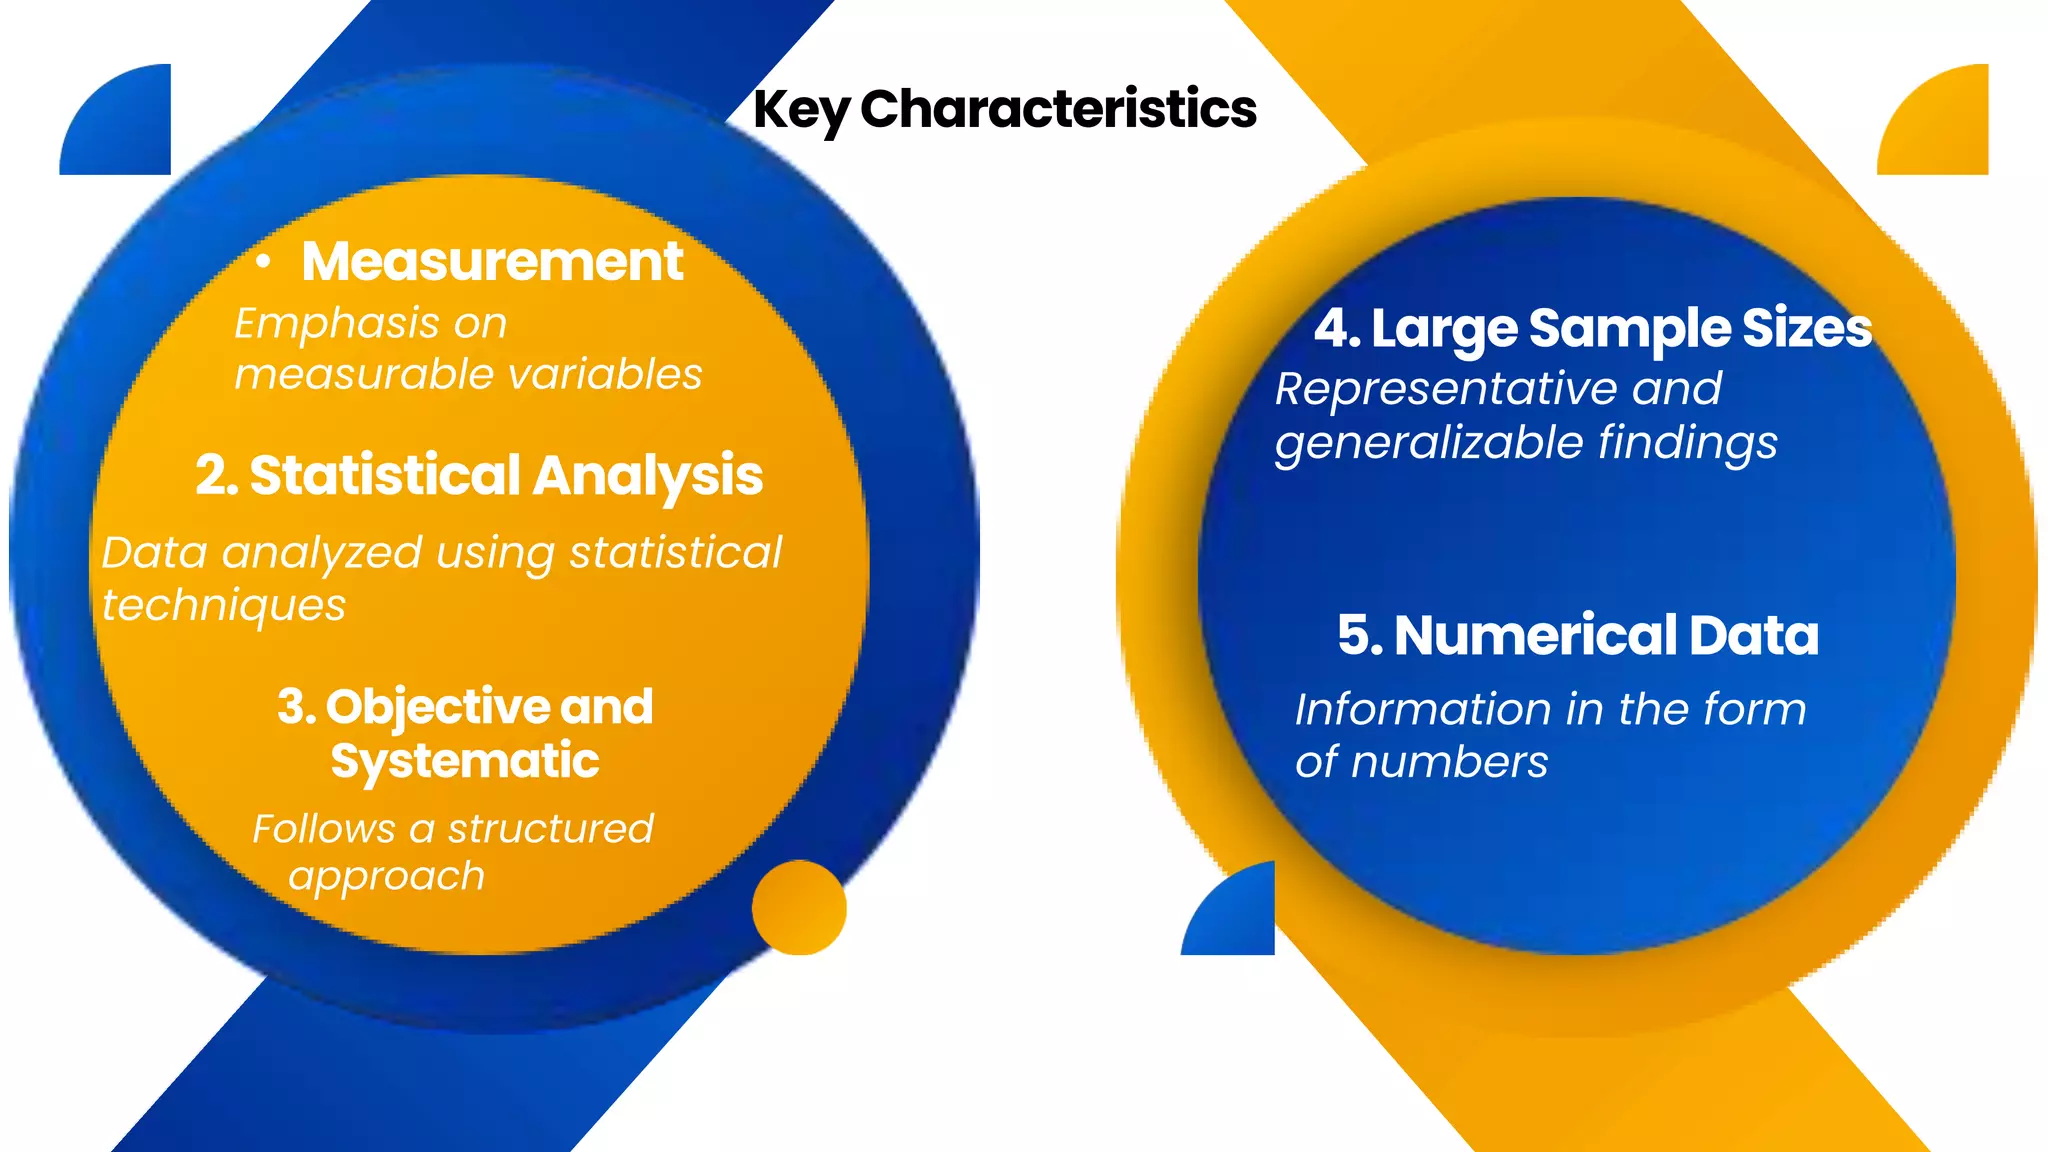


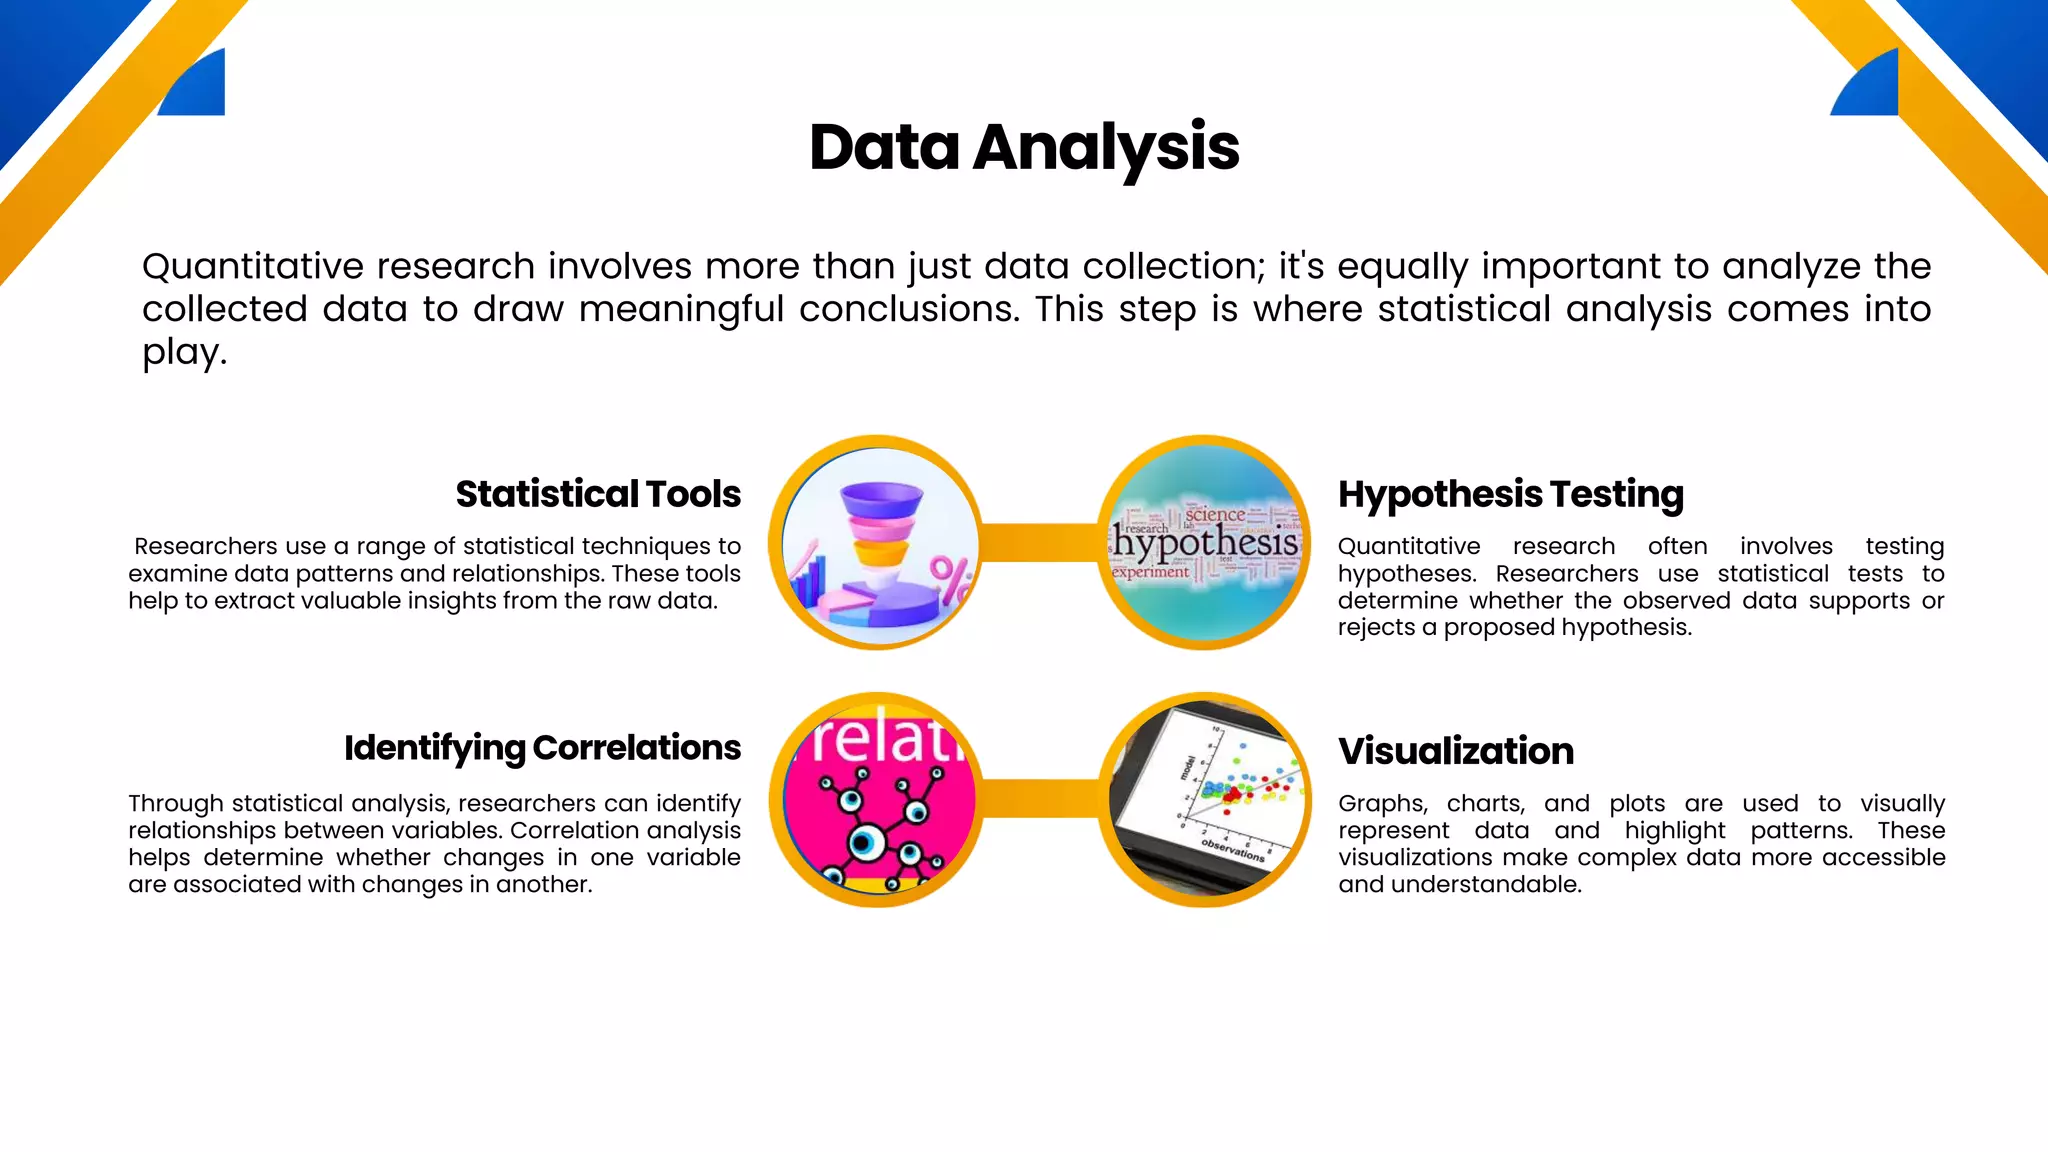


This document discusses quantitative research, which involves collecting and analyzing numerical data to identify patterns, relationships, and trends. Quantitative research focuses on measurable variables and uses statistical analysis of large sample sizes to draw objective, generalizable conclusions. Common data collection methods include experiments, observation, and structured surveys. Statistical tools are used to analyze data and identify correlations in order to test hypotheses. Quantitative research has various applications in fields like medicine, psychology, economics and education by providing empirical evidence to inform decision-making and support theories.