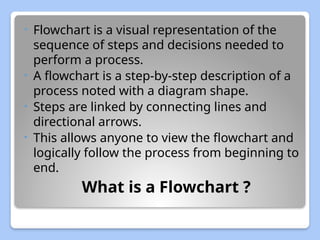
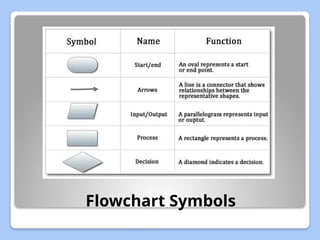
FLOW CHART
K. Srividya Lakshmi
Assistant Professor (Sr. G.)
EFL Department
SRMIST
Ramapuram Campus
What is a Flowchart ?
• Flowchart is a visual representation of the
sequence of steps and decisions needed to
perform a process.
• A flowchart is a step-by-step description of a
process noted with a diagram shape.
• Steps are linked by connecting lines and
directional arrows.
• This allows anyone to view the flowchart and
logically follow the process from beginning to
end.
Flowchart Symbols
Uses of Flowchart
 Flowchart is widely used in multiple fields to document,
study, plan, improve and communicate often complex
processes in clear, easy-to-understand diagrams.
 When designing and planning a process, flowcharts
help identify key steps while providing a complete
picture of the process.
 Organize tasks in chronological order and identify by
type. Processes, decisions, data, etc.
 Planning new projects, documenting processes,
modeling business processes, managing workflows,
auditing processes, mapping computer algorithms,
managing data
Types of flow chart
 Process flowcharts
The most opted and versatile; can be applied to anything.
It is used in process engineering and chemical industry
where there is a requirement of depicting the relationship
between major components only.
 Document flowcharts (work flow chart)- shows control over
a document
 Data flowcharts- shows control over a data-flow in a system
to see where data flows in and out of an Information System
 The Swim lane Flowchart- shows multiple flows of
information side by side; process that interacts with various
segments of an organization.
Steps in a Flowchart
 Describe each and every step in a
separate block/box
 Each block should have a verb, mostly
in passive form.
 It should be in the right sequence of
occurrence
 Each block should be connected with
directional arrows or straight lines
 Give a suitable title.
Interpretation of Flowchart
 While interpreting a Chart/Table/Graph,
care must be taken to use the
appropriate connective words such as
‘initially’, ‘first’, ‘next’, ‘then’, ‘as a result
of’, ‘consequently’, ‘finally’, etc.
 As the flow chart represents the
sequence of a process, in a step-by-step
method.
 All interpretations of a flowchart should
be in present passive.
Example
 Convert the following flowchart into a paragraph of
about 150 words. Use an introductory and a
concluding sentence.
The Process of Making Cement
The flow chart describes the process of making
cement. The two raw materials used in the process are
limestone and clay. Limestone is crushed, sized and
dried. After that, it is stored in the storage silos.
Similarly, clay is washed, crushed ,dried and stored in
the storage bins . The crushed limestone and clay are
mixed in correct proportions. The formation is known
as slurry. The slurry is fed into the rotary kiln where it
is burnt at a higher temperature (1000 C). A

chemical reaction takes place and clinkers are formed.
Now gypsum is added to the clinker. The mixture is
powdered and sent to the storage silos. Eventually the
finished product is ready in the form of cement. In this
The process of making a Cement
Flowchart Example
Introduction to Flowchart and Its Uses.pptx

Introduction to Flowchart and Its Uses.pptx

  • 1.
    FLOW CHART K. SrividyaLakshmi Assistant Professor (Sr. G.) EFL Department SRMIST Ramapuram Campus
  • 2.
    What is aFlowchart ? • Flowchart is a visual representation of the sequence of steps and decisions needed to perform a process. • A flowchart is a step-by-step description of a process noted with a diagram shape. • Steps are linked by connecting lines and directional arrows. • This allows anyone to view the flowchart and logically follow the process from beginning to end.
  • 3.
  • 4.
    Uses of Flowchart Flowchart is widely used in multiple fields to document, study, plan, improve and communicate often complex processes in clear, easy-to-understand diagrams.  When designing and planning a process, flowcharts help identify key steps while providing a complete picture of the process.  Organize tasks in chronological order and identify by type. Processes, decisions, data, etc.  Planning new projects, documenting processes, modeling business processes, managing workflows, auditing processes, mapping computer algorithms, managing data
  • 5.
    Types of flowchart  Process flowcharts The most opted and versatile; can be applied to anything. It is used in process engineering and chemical industry where there is a requirement of depicting the relationship between major components only.  Document flowcharts (work flow chart)- shows control over a document  Data flowcharts- shows control over a data-flow in a system to see where data flows in and out of an Information System  The Swim lane Flowchart- shows multiple flows of information side by side; process that interacts with various segments of an organization.
  • 6.
    Steps in aFlowchart  Describe each and every step in a separate block/box  Each block should have a verb, mostly in passive form.  It should be in the right sequence of occurrence  Each block should be connected with directional arrows or straight lines  Give a suitable title.
  • 7.
    Interpretation of Flowchart While interpreting a Chart/Table/Graph, care must be taken to use the appropriate connective words such as ‘initially’, ‘first’, ‘next’, ‘then’, ‘as a result of’, ‘consequently’, ‘finally’, etc.  As the flow chart represents the sequence of a process, in a step-by-step method.  All interpretations of a flowchart should be in present passive.
  • 8.
    Example  Convert thefollowing flowchart into a paragraph of about 150 words. Use an introductory and a concluding sentence. The Process of Making Cement The flow chart describes the process of making cement. The two raw materials used in the process are limestone and clay. Limestone is crushed, sized and dried. After that, it is stored in the storage silos. Similarly, clay is washed, crushed ,dried and stored in the storage bins . The crushed limestone and clay are mixed in correct proportions. The formation is known as slurry. The slurry is fed into the rotary kiln where it is burnt at a higher temperature (1000 C). A  chemical reaction takes place and clinkers are formed. Now gypsum is added to the clinker. The mixture is powdered and sent to the storage silos. Eventually the finished product is ready in the form of cement. In this
  • 9.
    The process ofmaking a Cement Flowchart Example