• Discussing thekey components of evaluating
the model performance, which are
• Overfitting,
• Cross Validation, And
• Evaluation Metrics.
3.
Overfitting:
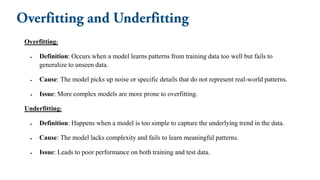
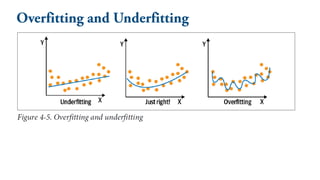
• Definition: Occurswhen a model learns patterns from training data too well but fails to
generalize to unseen data.
• Cause: The model picks up noise or specific details that do not represent real-world patterns.
• Issue: More complex models are more prone to overfitting.
Underfitting:
• Definition: Happens when a model is too simple to capture the underlying trend in the data.
• Cause: The model lacks complexity and fails to learn meaningful patterns.
• Issue: Leads to poor performance on both training and test data.
5.
There can betwo ways to combat overfitting:
• Using more training data
• The more training data we have, the harder it is to overfit the data by learning
too much from any single training example.
• Using regularization
• Adding a penalty in the loss function for building a model that assigns too
much explanatory power to any one feature, or allows too many features to be
taken into account.
6.
What is Cross-Validation?
•Cross-validation (CV) is a statistical technique used in machine learning to assess the performance and
generalizability of a model by splitting the dataset into multiple subsets for training and testing. It
helps ensure that the model does not overfit (overfitting versus underfitting) to a specific training set
and performs well on unseen data.
Aim of Cross-Validation:
• Evaluate Model Performance: Measures how well the model generalizes to unseen data.
• Prevent Overfitting: Ensures the model doesn’t memorize the training data but learns patterns.
• Improve Hyperparameter Selection: Helps in tuning model parameters for optimal performance.
• Reduce Bias and Variance: Balances model complexity by training and testing on different subsets.
7.
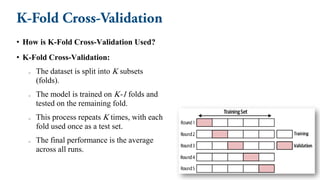
• How isK-Fold Cross-Validation Used?
• K-Fold Cross-Validation:
o The dataset is split into K subsets
(folds).
o The model is trained on K-1 folds and
tested on the remaining fold.
o This process repeats K times, with each
fold used once as a test set.
o The final performance is the average
across all runs.
8.
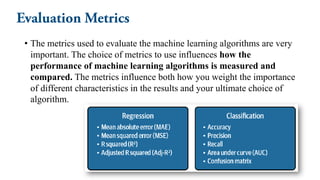
• The metricsused to evaluate the machine learning algorithms are very
important. The choice of metrics to use influences how the
performance of machine learning algorithms is measured and
compared. The metrics influence both how you weight the importance
of different characteristics in the results and your ultimate choice of
algorithm.
9.
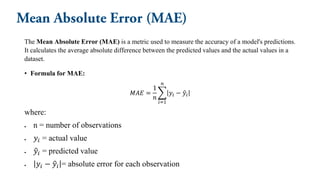
The Mean AbsoluteError (MAE) is a metric used to measure the accuracy of a model's predictions.
It calculates the average absolute difference between the predicted values and the actual values in a
dataset.
• Formula for MAE:
𝑀𝐴𝐸 =
1
𝑛
𝑖=1
𝑛
𝑦𝑖 − ො
𝑦𝑖
where:
• n = number of observations
• 𝑦𝑖 = actual value
• ො
𝑦𝑖 = predicted value
• 𝑦𝑖 − ො
𝑦𝑖 = absolute error for each observation
10.
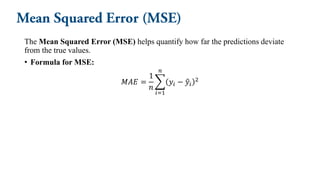
The Mean SquaredError (MSE) helps quantify how far the predictions deviate
from the true values.
• Formula for MSE:
𝑀𝐴𝐸 =
1
𝑛
𝑖=1
𝑛
𝑦𝑖 − ො
𝑦𝑖
2
11.
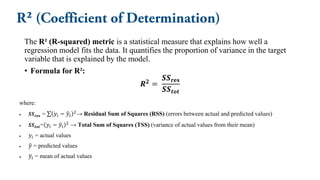
The R² (R-squared)metric is a statistical measure that explains how well a
regression model fits the data. It quantifies the proportion of variance in the target
variable that is explained by the model.
• Formula for R²:
𝑹𝟐 =
𝑺𝑺𝐫𝐞𝐬
𝑺𝑺𝒕𝒐𝒕
where:
• 𝑺𝑺𝐫𝐞𝐬 = σ 𝑦𝑖 − ො
𝑦𝑖
2
→ Residual Sum of Squares (RSS) (errors between actual and predicted values)
• 𝑺𝑺𝒕𝒐𝒕= 𝑦𝑖 − ത
𝑦𝑖
2
→ Total Sum of Squares (TSS) (variance of actual values from their mean)
• 𝑦𝑖 = actual values
• ො
𝑦 = predicted values
• ത
𝑦𝑖 = mean of actual values
12.
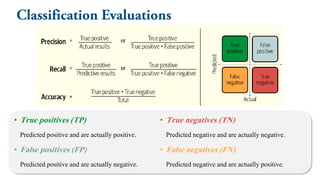
• True positives(TP)
Predicted positive and are actually positive.
• False positives (FP)
Predicted positive and are actually negative.
• True negatives (TN)
Predicted negative and are actually negative.
• False negatives (FN)
Predicted negative and are actually positive.


![PERFORMANCE_PREDICTION__PARAMETERS[1].pptx](https://cdn.slidesharecdn.com/ss_thumbnails/performancepredictionparameters1-240130171305-9f984922-thumbnail.jpg?width=640&height=640&fit=bounds)