Data Science andBig Data Analytics
Course Tutor: Dr. Akbar Hussain
Class: BSSE/CS/AI/IT (7th
)
Week # 8
2.
Lecture Contents
1. Whatis a Confusion Matrix
2. Evaluation Metrics for Classification Problems (Confusion Matrix)
3. Evaluation Metrics for Regression Problems (MAE, MSE, R-Squared)
4. What is Sampling
5. Types of sampling.
3.
What is aConfusion Matrix?
A Confusion Matrix is a square matrix or a table used to evaluate the
performance of a classification model by comparing predicted vs. actual
values.
It summarizes the results of predictions and shows the number of correct
and incorrect predictions for each class.
4.
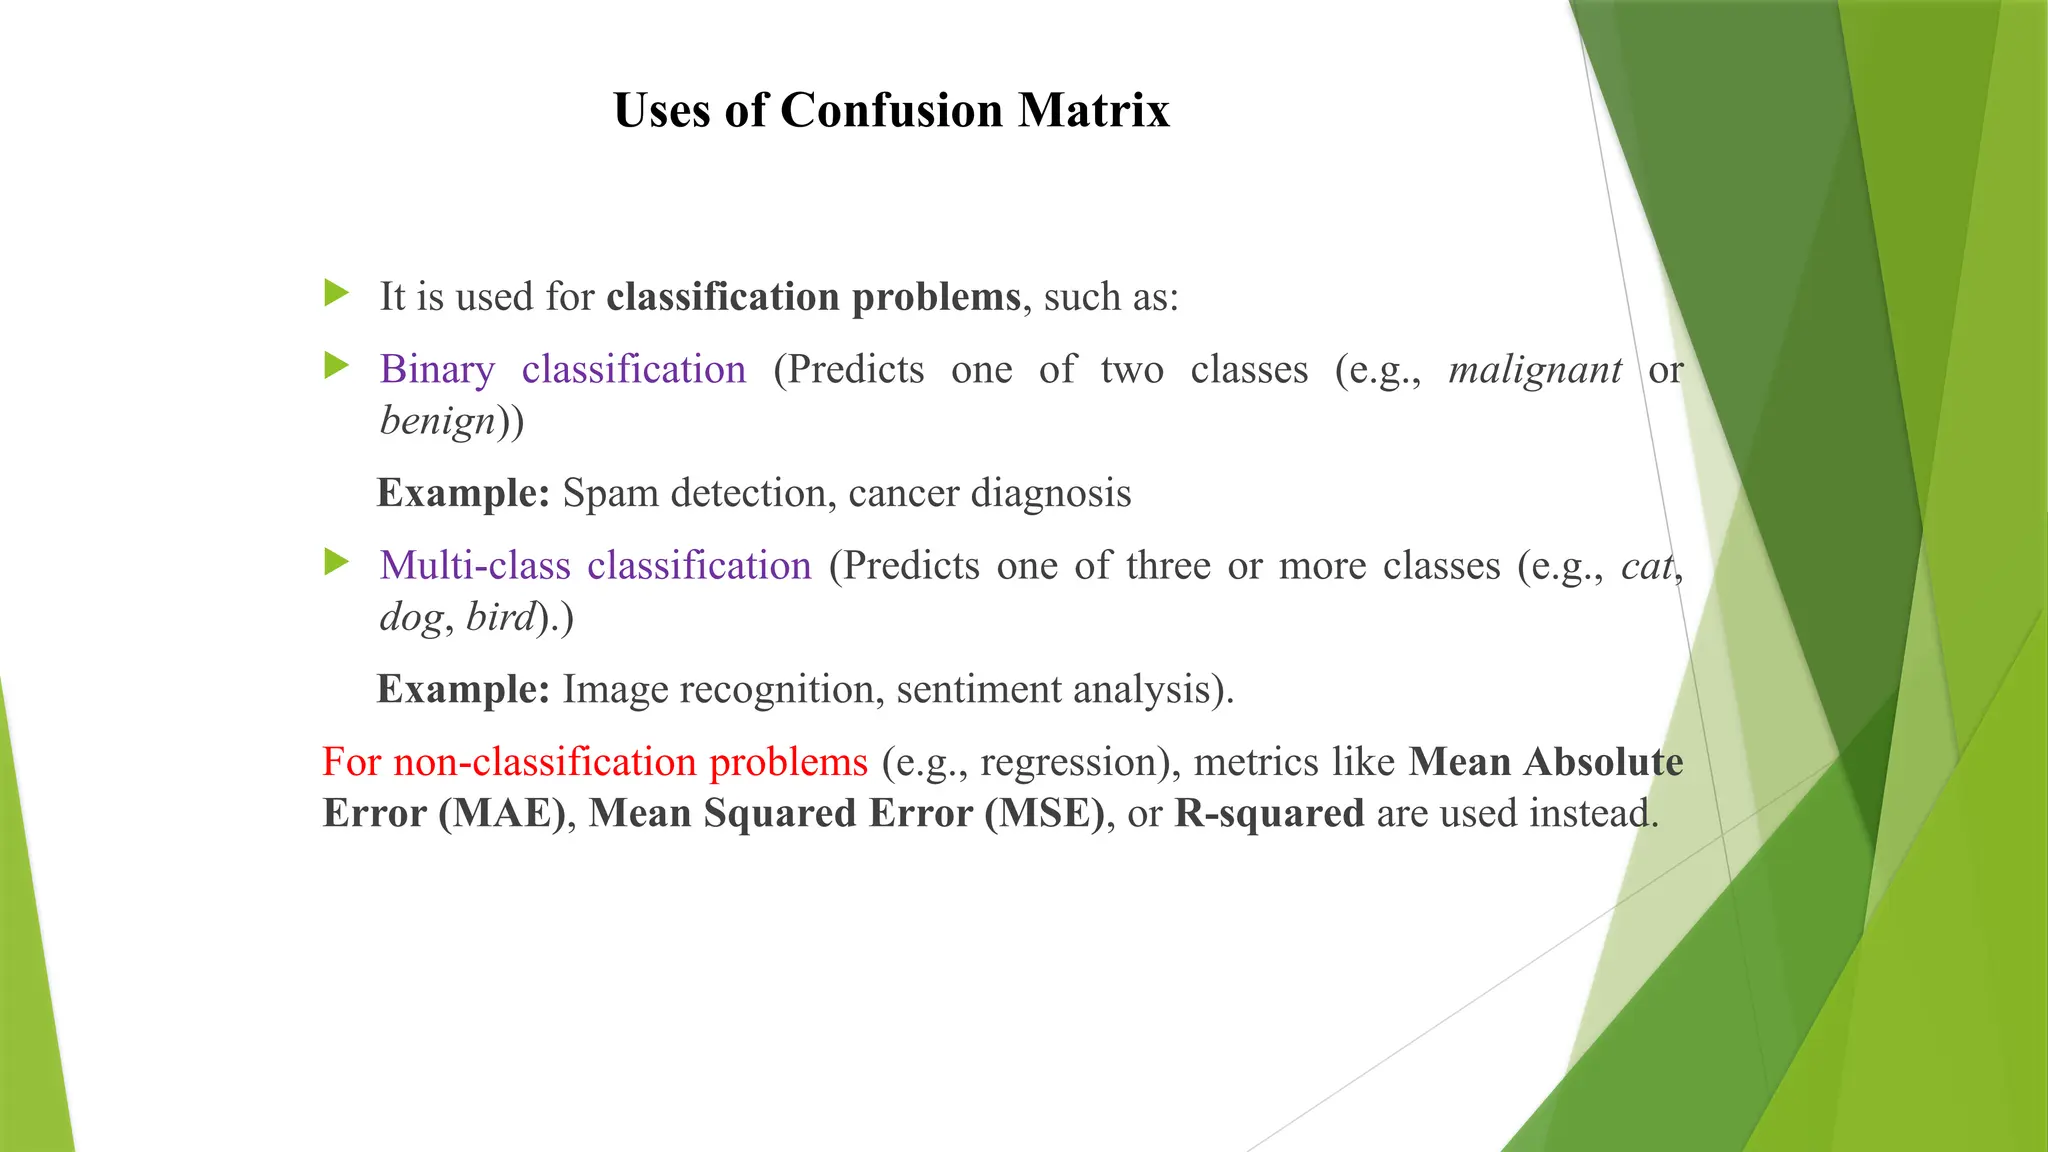
Uses of ConfusionMatrix
It is used for classification problems, such as:
Binary classification (Predicts one of two classes (e.g., malignant or
benign))
Example: Spam detection, cancer diagnosis
Multi-class classification (Predicts one of three or more classes (e.g., cat,
dog, bird).)
Example: Image recognition, sentiment analysis).
For non-classification problems (e.g., regression), metrics like Mean Absolute
Error (MAE), Mean Squared Error (MSE), or R-squared are used instead.
5.
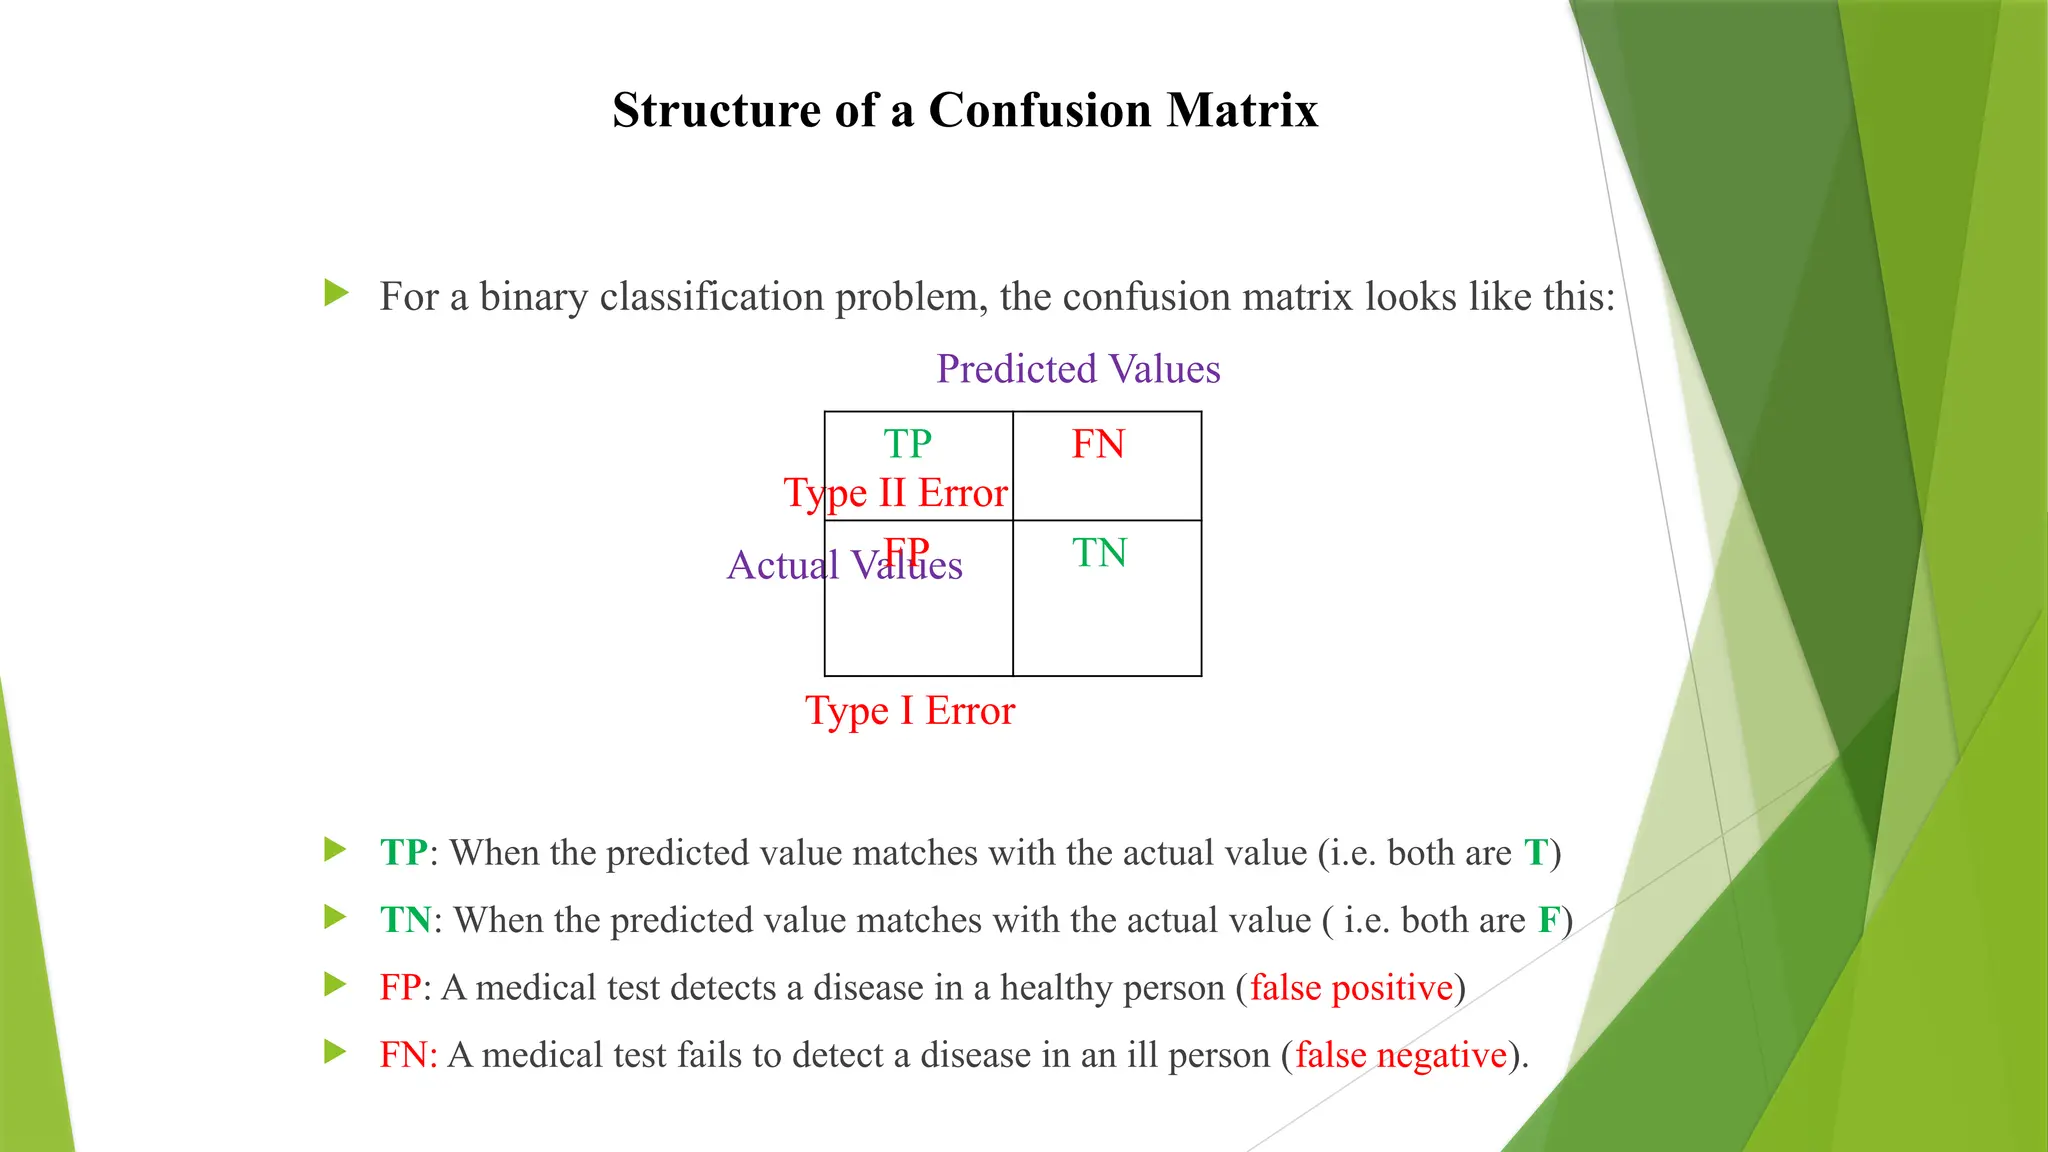
Structure of aConfusion Matrix
For a binary classification problem, the confusion matrix looks like this:
Predicted Values
Type II Error
Actual Values
Type I Error
TP: When the predicted value matches with the actual value (i.e. both are T)
TN: When the predicted value matches with the actual value ( i.e. both are F)
FP: A medical test detects a disease in a healthy person (false positive)
FN: A medical test fails to detect a disease in an ill person (false negative).
TP FN
FP TN
6.
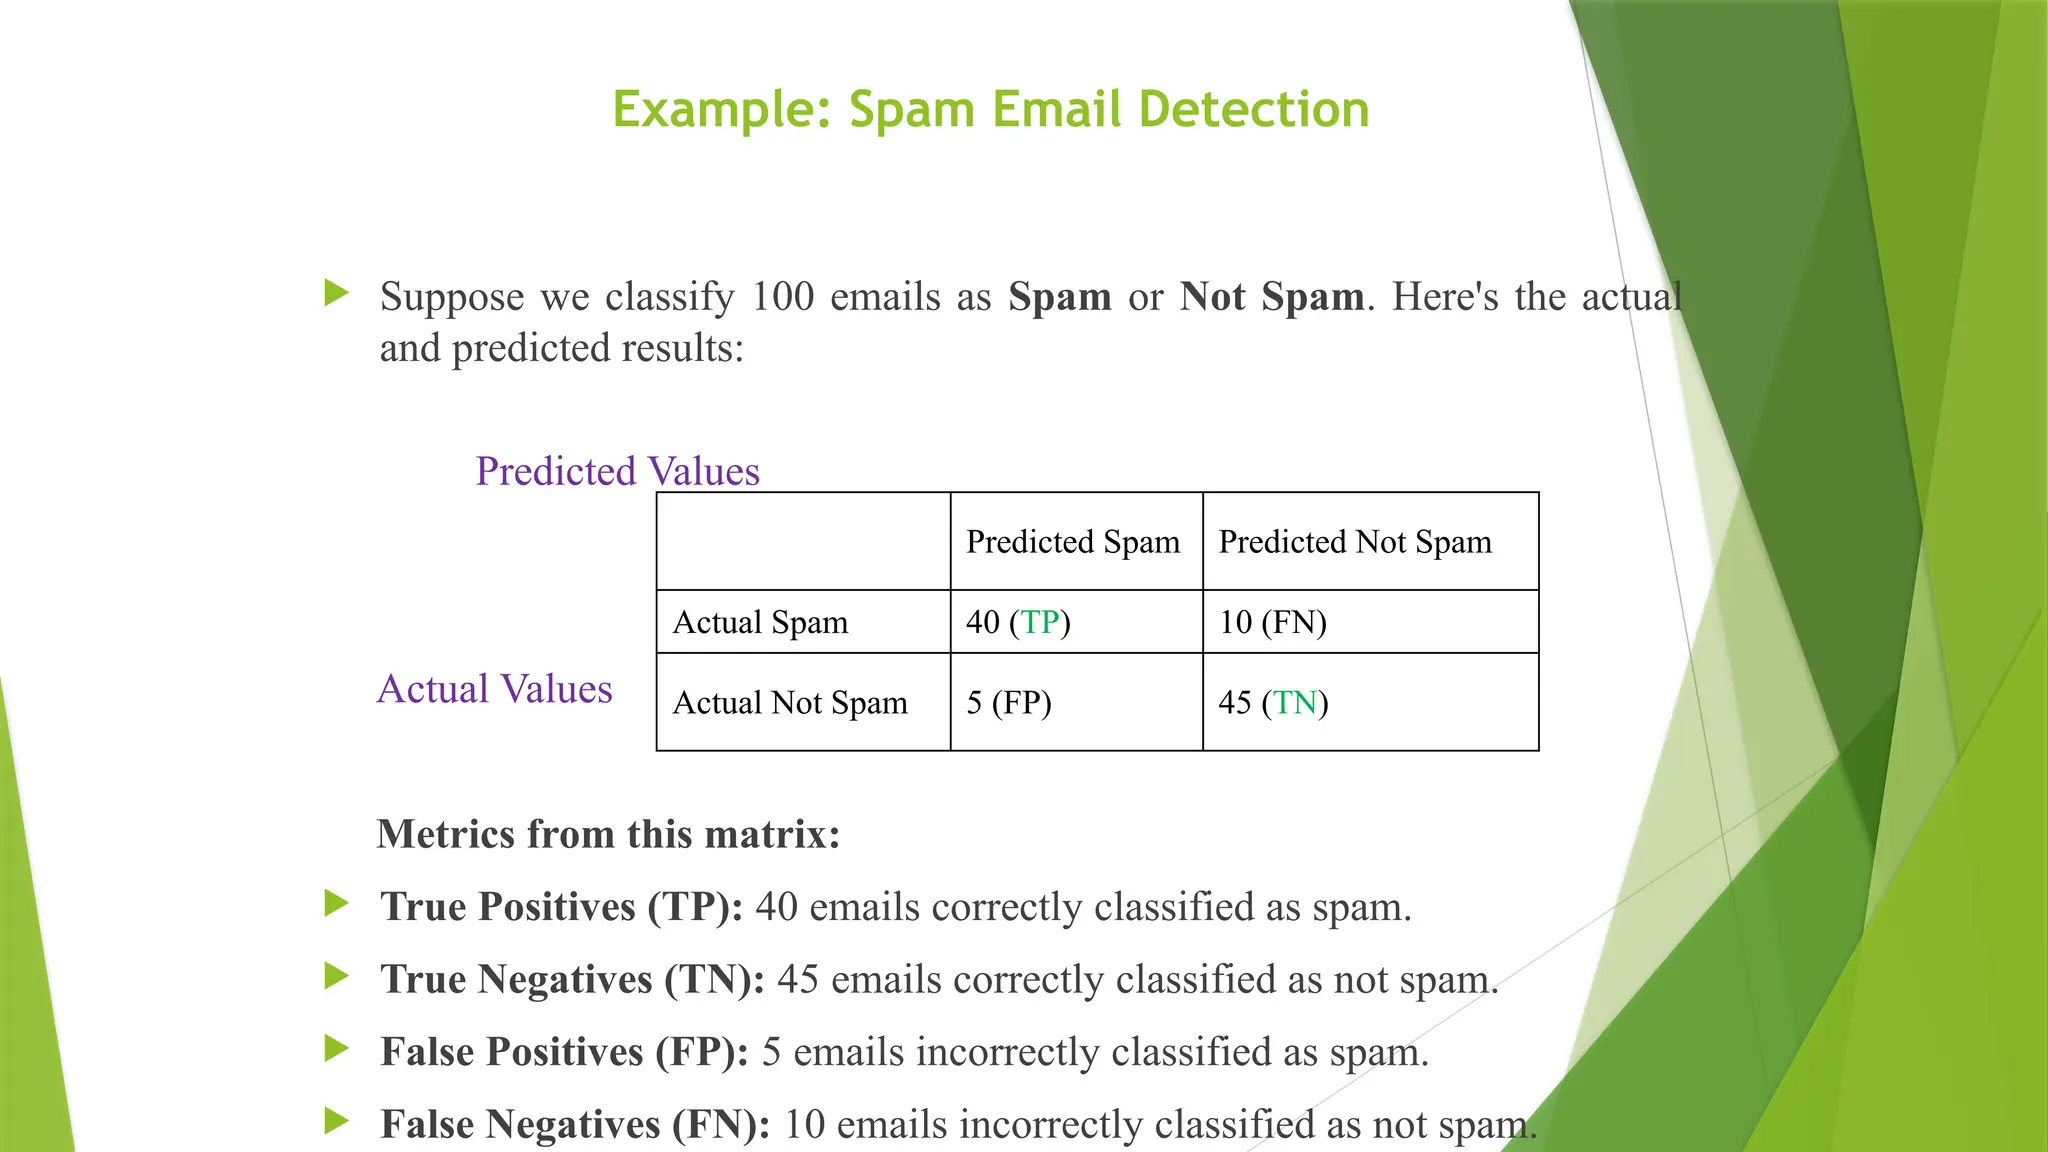
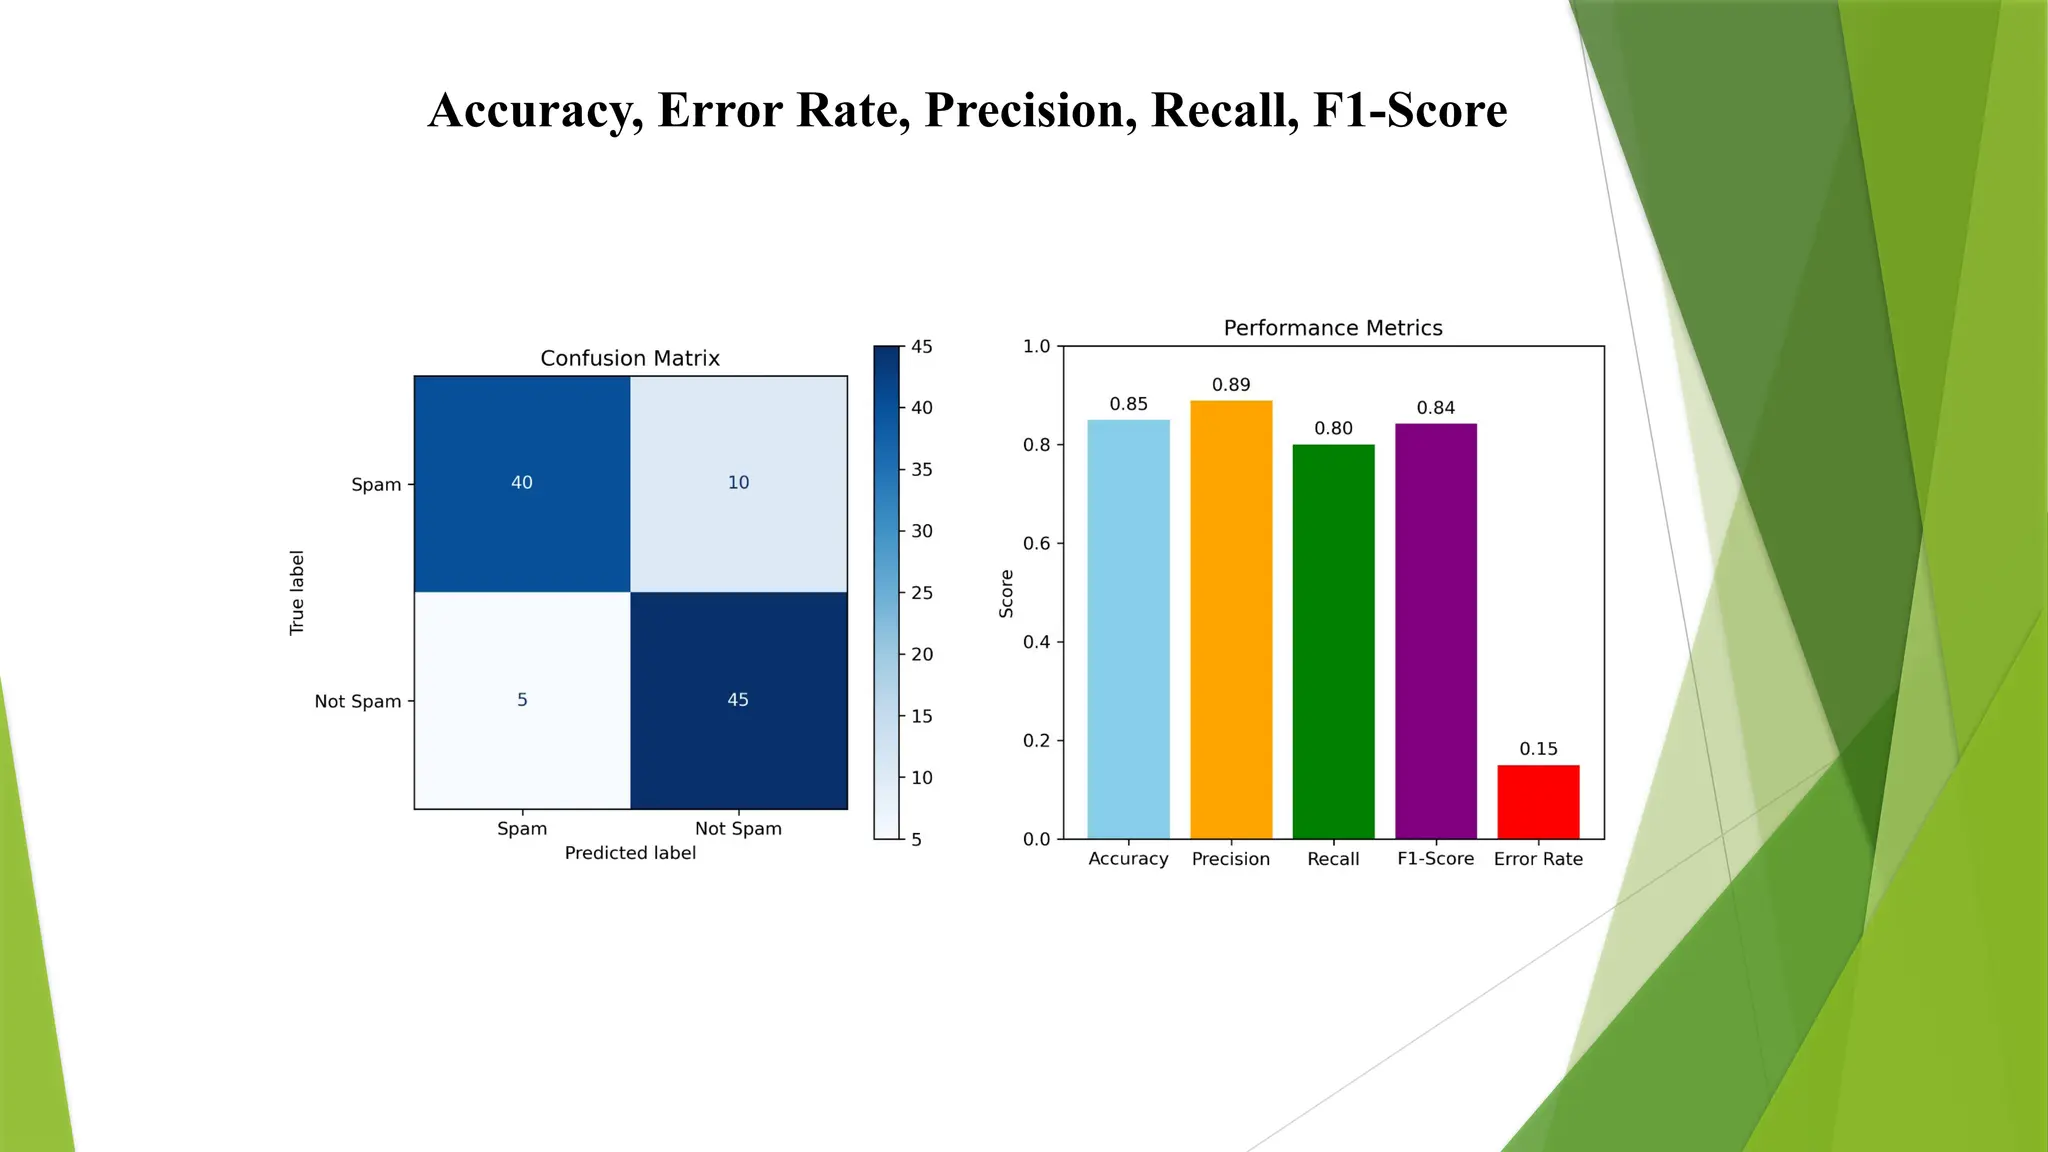
Example: Spam EmailDetection
Suppose we classify 100 emails as Spam or Not Spam. Here's the actual
and predicted results:
Predicted Values
Actual Values
Metrics from this matrix:
True Positives (TP): 40 emails correctly classified as spam.
True Negatives (TN): 45 emails correctly classified as not spam.
False Positives (FP): 5 emails incorrectly classified as spam.
False Negatives (FN): 10 emails incorrectly classified as not spam.
Predicted Spam Predicted Not Spam
Actual Spam 40 (TP) 10 (FN)
Actual Not Spam 5 (FP) 45 (TN)
7.
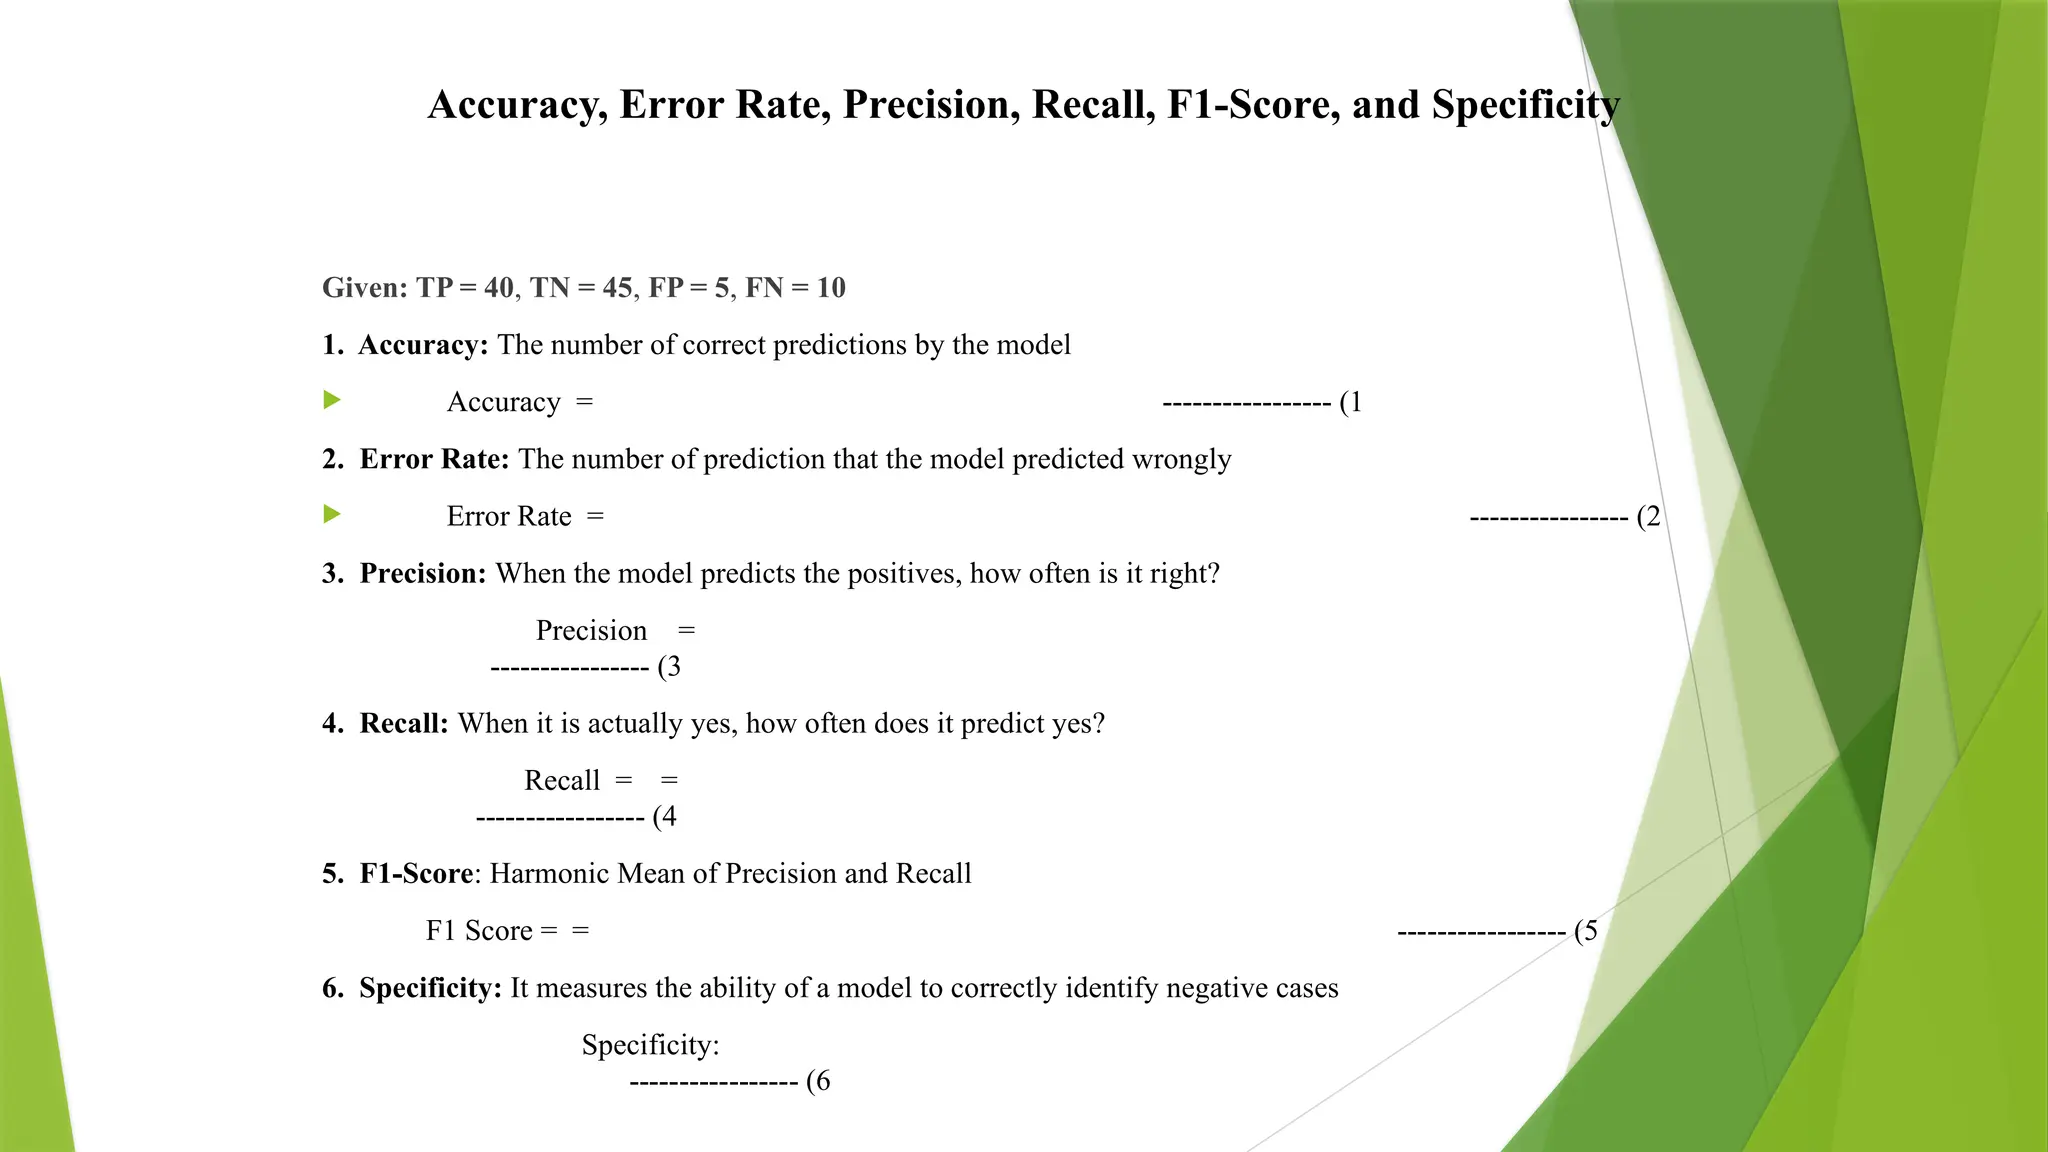
Accuracy, Error Rate,Precision, Recall, F1-Score, and Specificity
Given: TP = 40, TN = 45, FP = 5, FN = 10
1. Accuracy: The number of correct predictions by the model
Accuracy = ----------------- (1
2. Error Rate: The number of prediction that the model predicted wrongly
Error Rate = ---------------- (2
3. Precision: When the model predicts the positives, how often is it right?
Precision =
---------------- (3
4. Recall: When it is actually yes, how often does it predict yes?
Recall = =
----------------- (4
5. F1-Score: Harmonic Mean of Precision and Recall
F1 Score = = ----------------- (5
6. Specificity: It measures the ability of a model to correctly identify negative cases
Specificity:
----------------- (6
8.
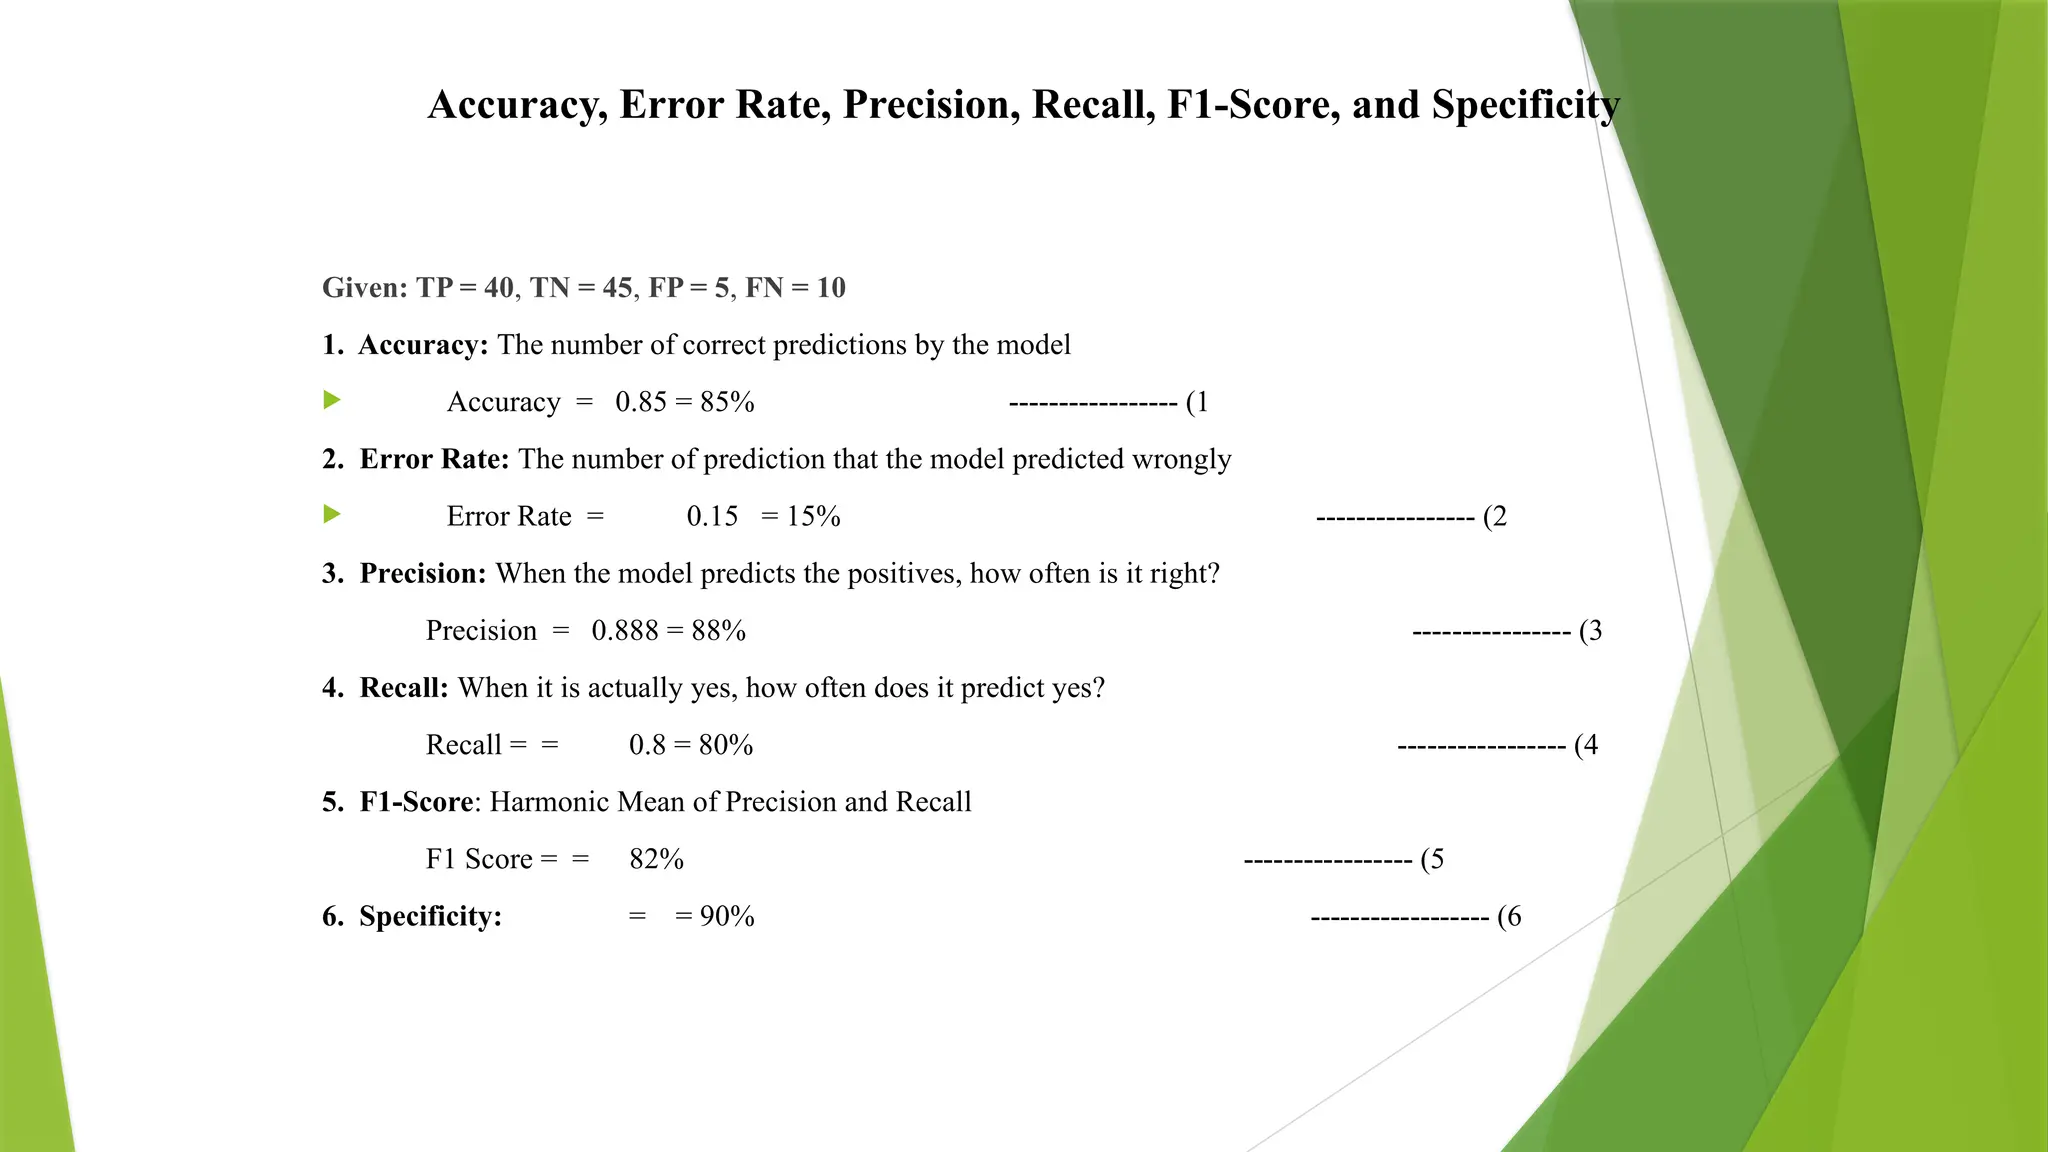
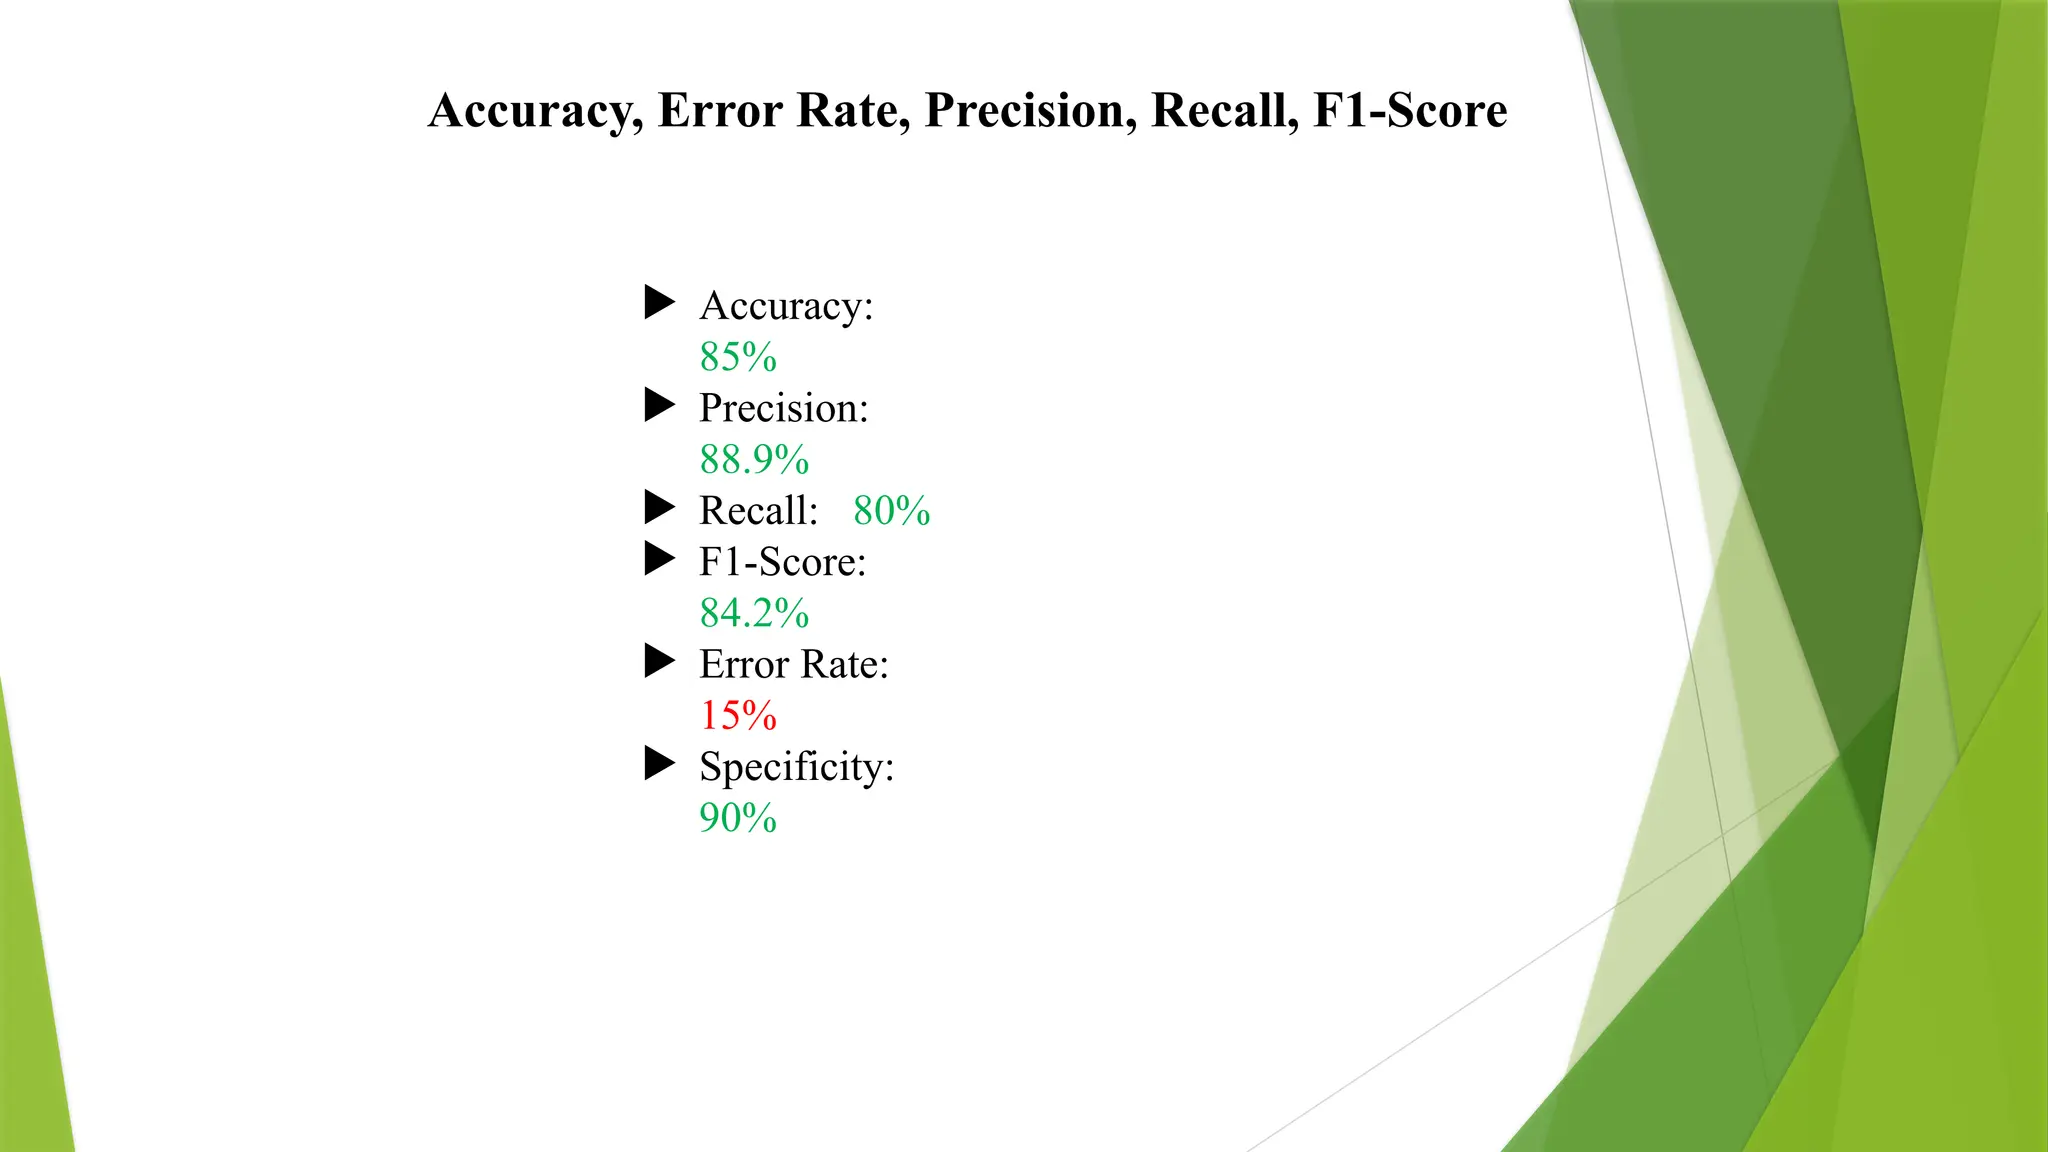
Accuracy, Error Rate,Precision, Recall, F1-Score, and Specificity
Given: TP = 40, TN = 45, FP = 5, FN = 10
1. Accuracy: The number of correct predictions by the model
Accuracy = 0.85 = 85% ----------------- (1
2. Error Rate: The number of prediction that the model predicted wrongly
Error Rate = 0.15 = 15% ---------------- (2
3. Precision: When the model predicts the positives, how often is it right?
Precision = 0.888 = 88% ---------------- (3
4. Recall: When it is actually yes, how often does it predict yes?
Recall = = 0.8 = 80% ----------------- (4
5. F1-Score: Harmonic Mean of Precision and Recall
F1 Score = = 82% ----------------- (5
6. Specificity: = = 90% ------------------ (6
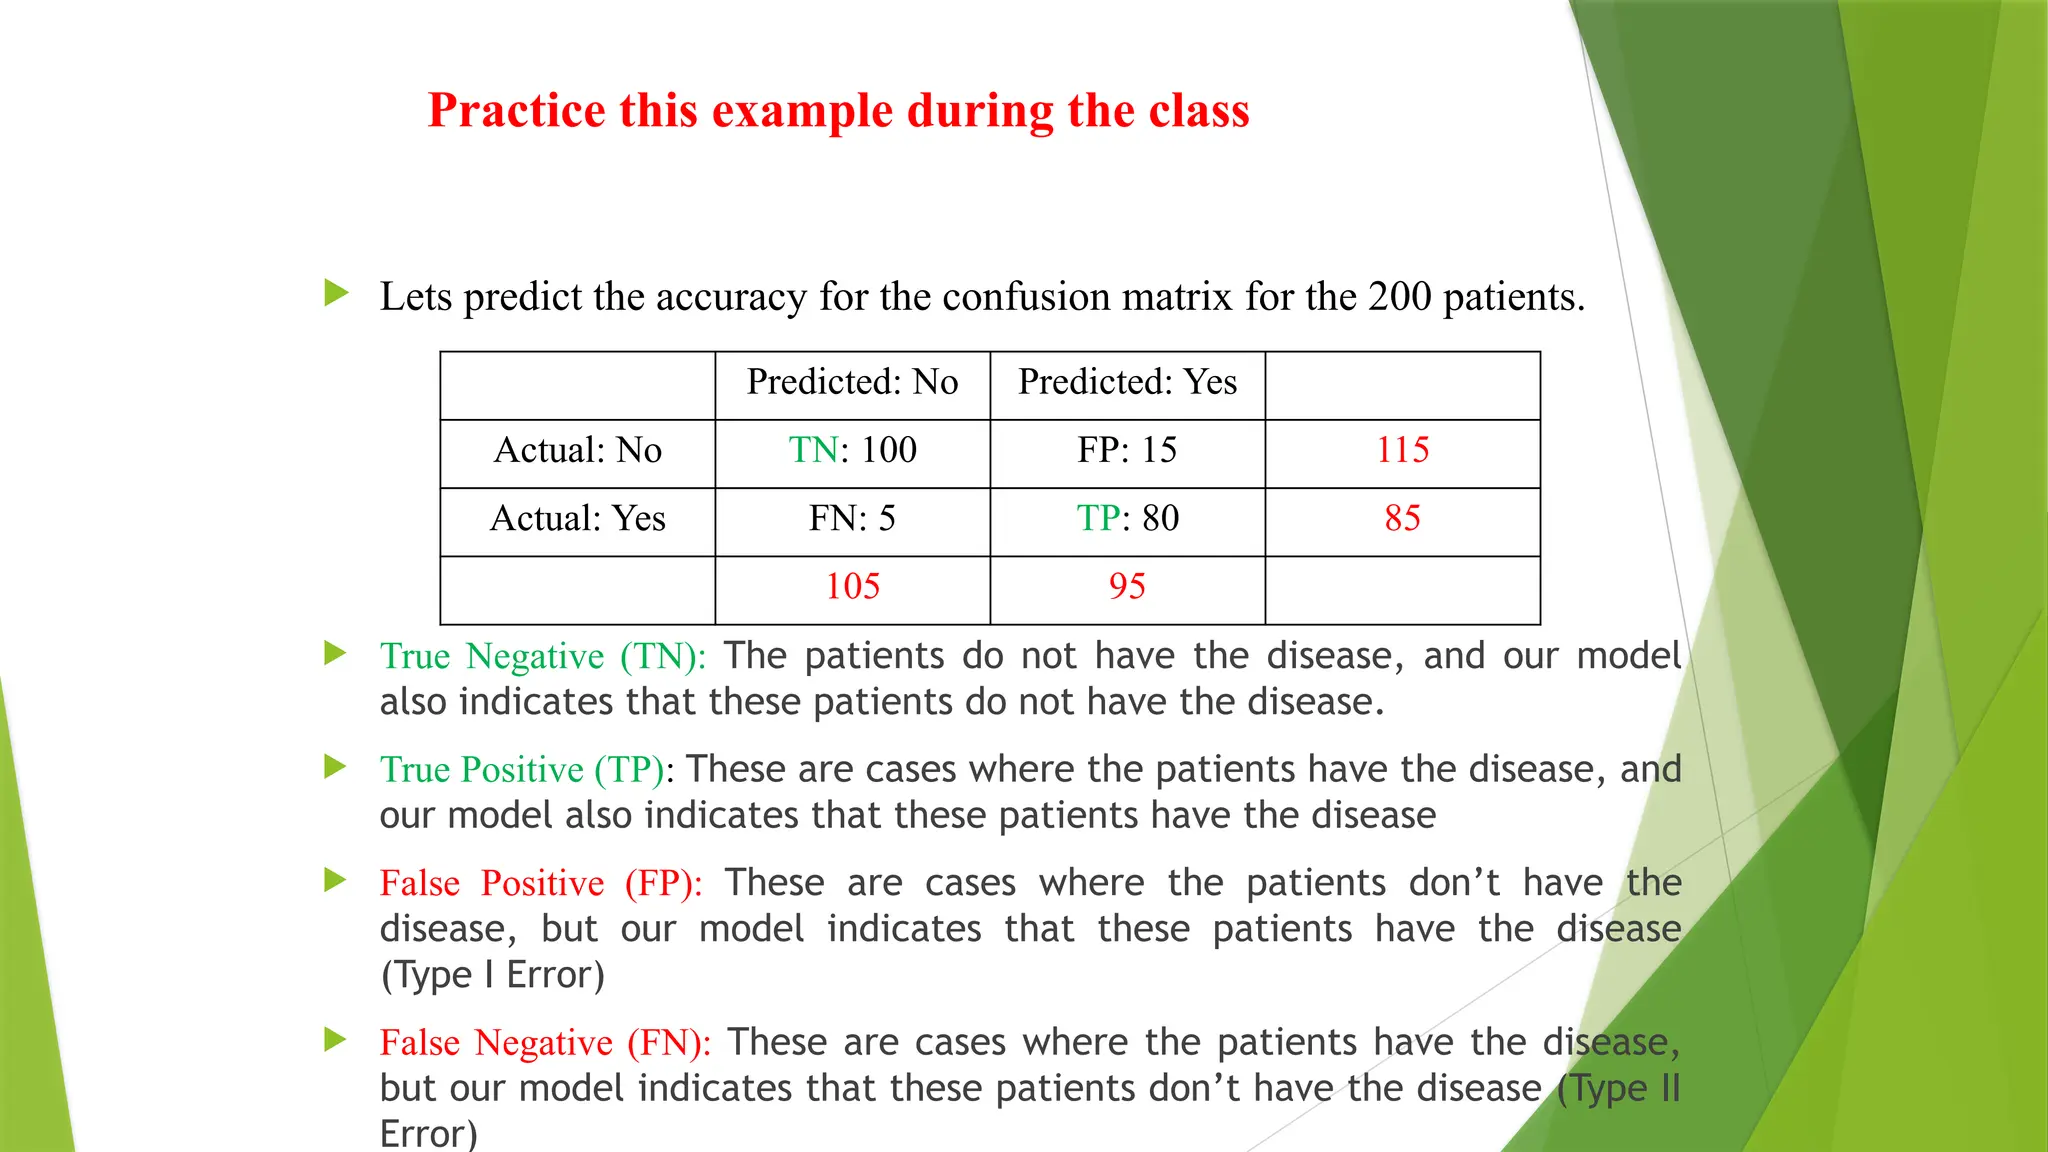
Practice this exampleduring the class
Lets predict the accuracy for the confusion matrix for the 200 patients.
True Negative (TN): The patients do not have the disease, and our model
also indicates that these patients do not have the disease.
True Positive (TP): These are cases where the patients have the disease, and
our model also indicates that these patients have the disease
False Positive (FP): These are cases where the patients don’t have the
disease, but our model indicates that these patients have the disease
(Type I Error)
False Negative (FN): These are cases where the patients have the disease,
but our model indicates that these patients don’t have the disease (Type II
Error)
Predicted: No Predicted: Yes
Actual: No TN: 100 FP: 15 115
Actual: Yes FN: 5 TP: 80 85
105 95
12.
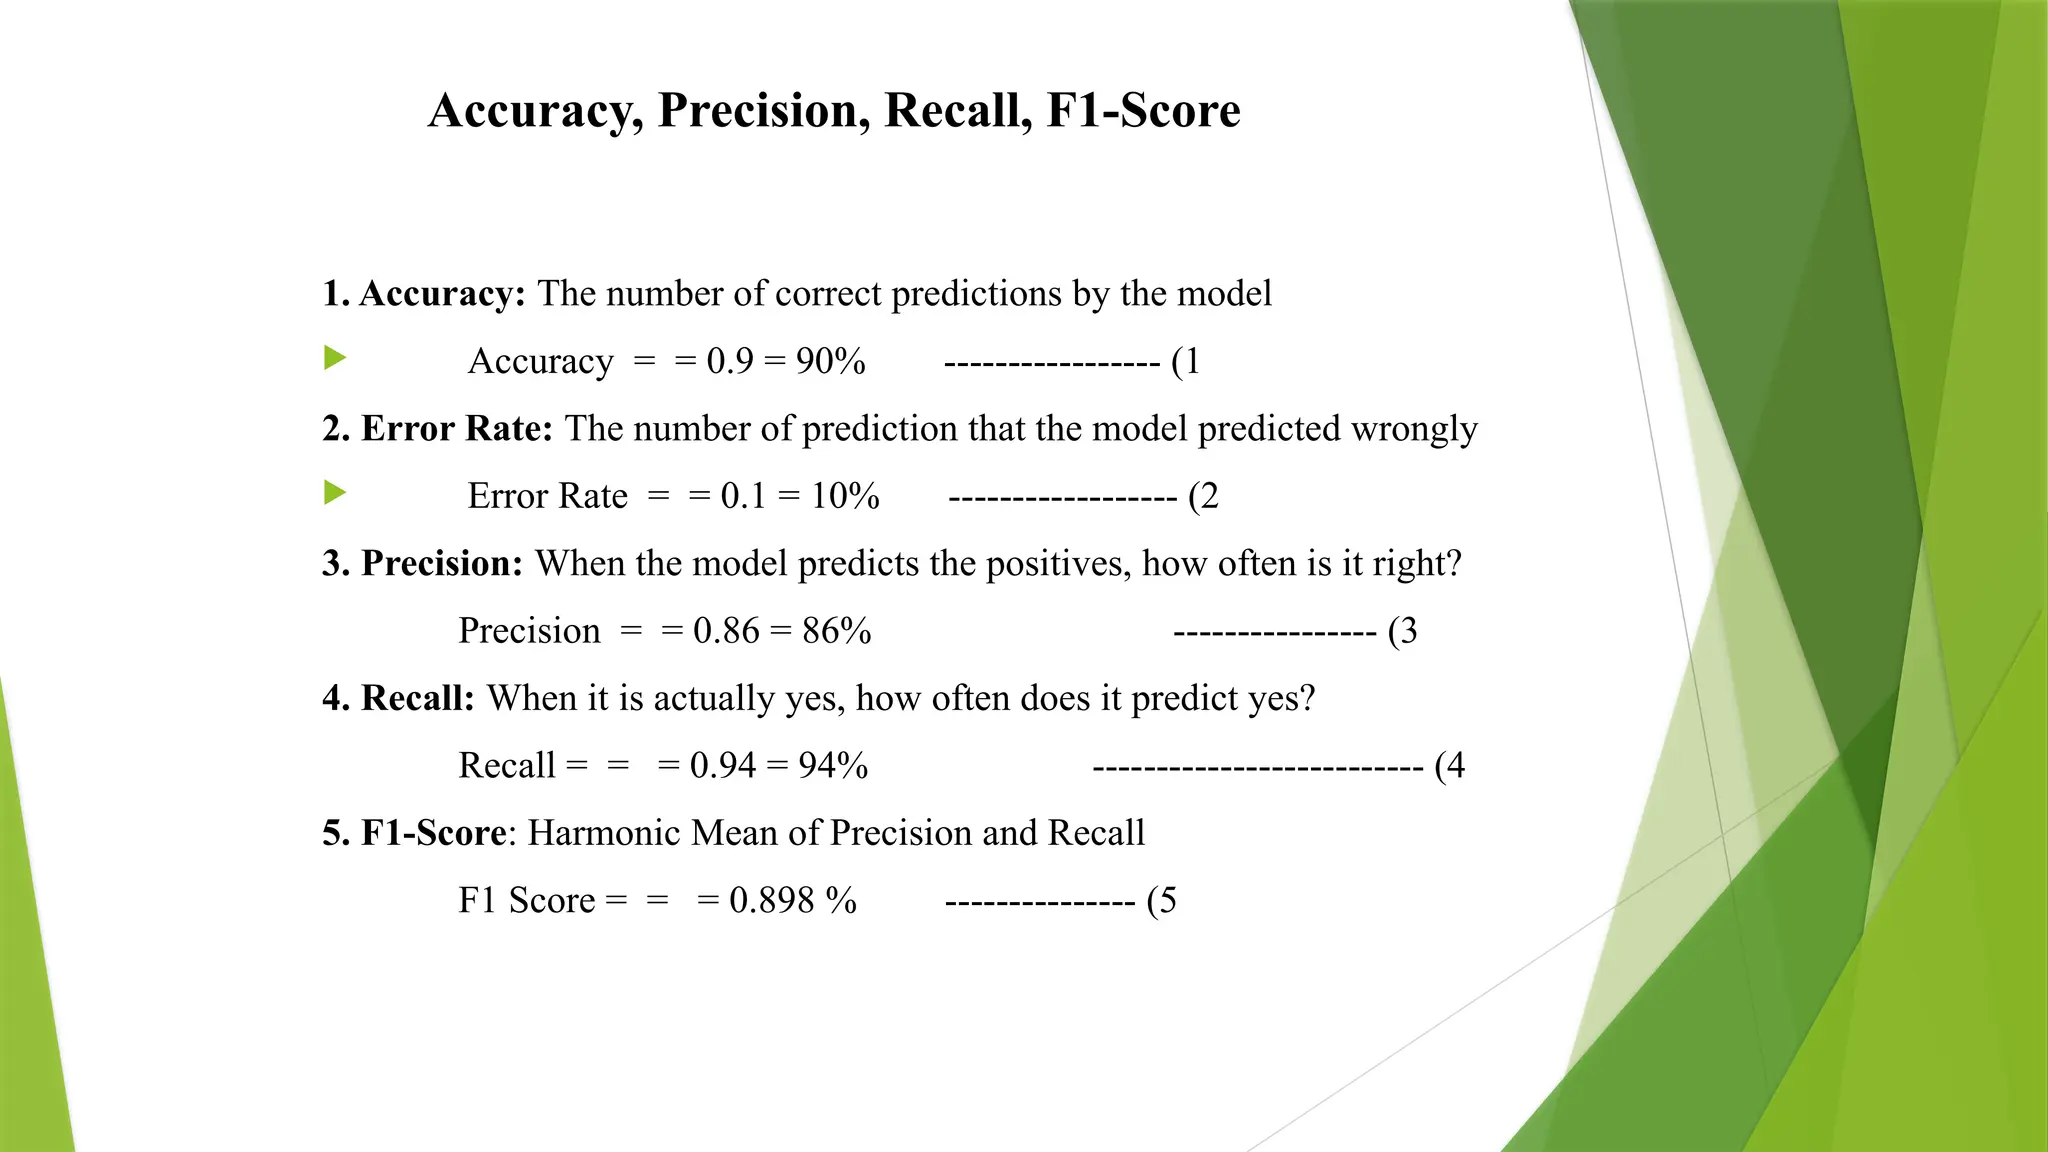
Accuracy, Precision, Recall,F1-Score
1. Accuracy: The number of correct predictions by the model
Accuracy = = 0.9 = 90% ----------------- (1
2. Error Rate: The number of prediction that the model predicted wrongly
Error Rate = = 0.1 = 10% ------------------ (2
3. Precision: When the model predicts the positives, how often is it right?
Precision = = 0.86 = 86% ---------------- (3
4. Recall: When it is actually yes, how often does it predict yes?
Recall = = = 0.94 = 94% -------------------------- (4
5. F1-Score: Harmonic Mean of Precision and Recall
F1 Score = = = 0.898 % --------------- (5
13.
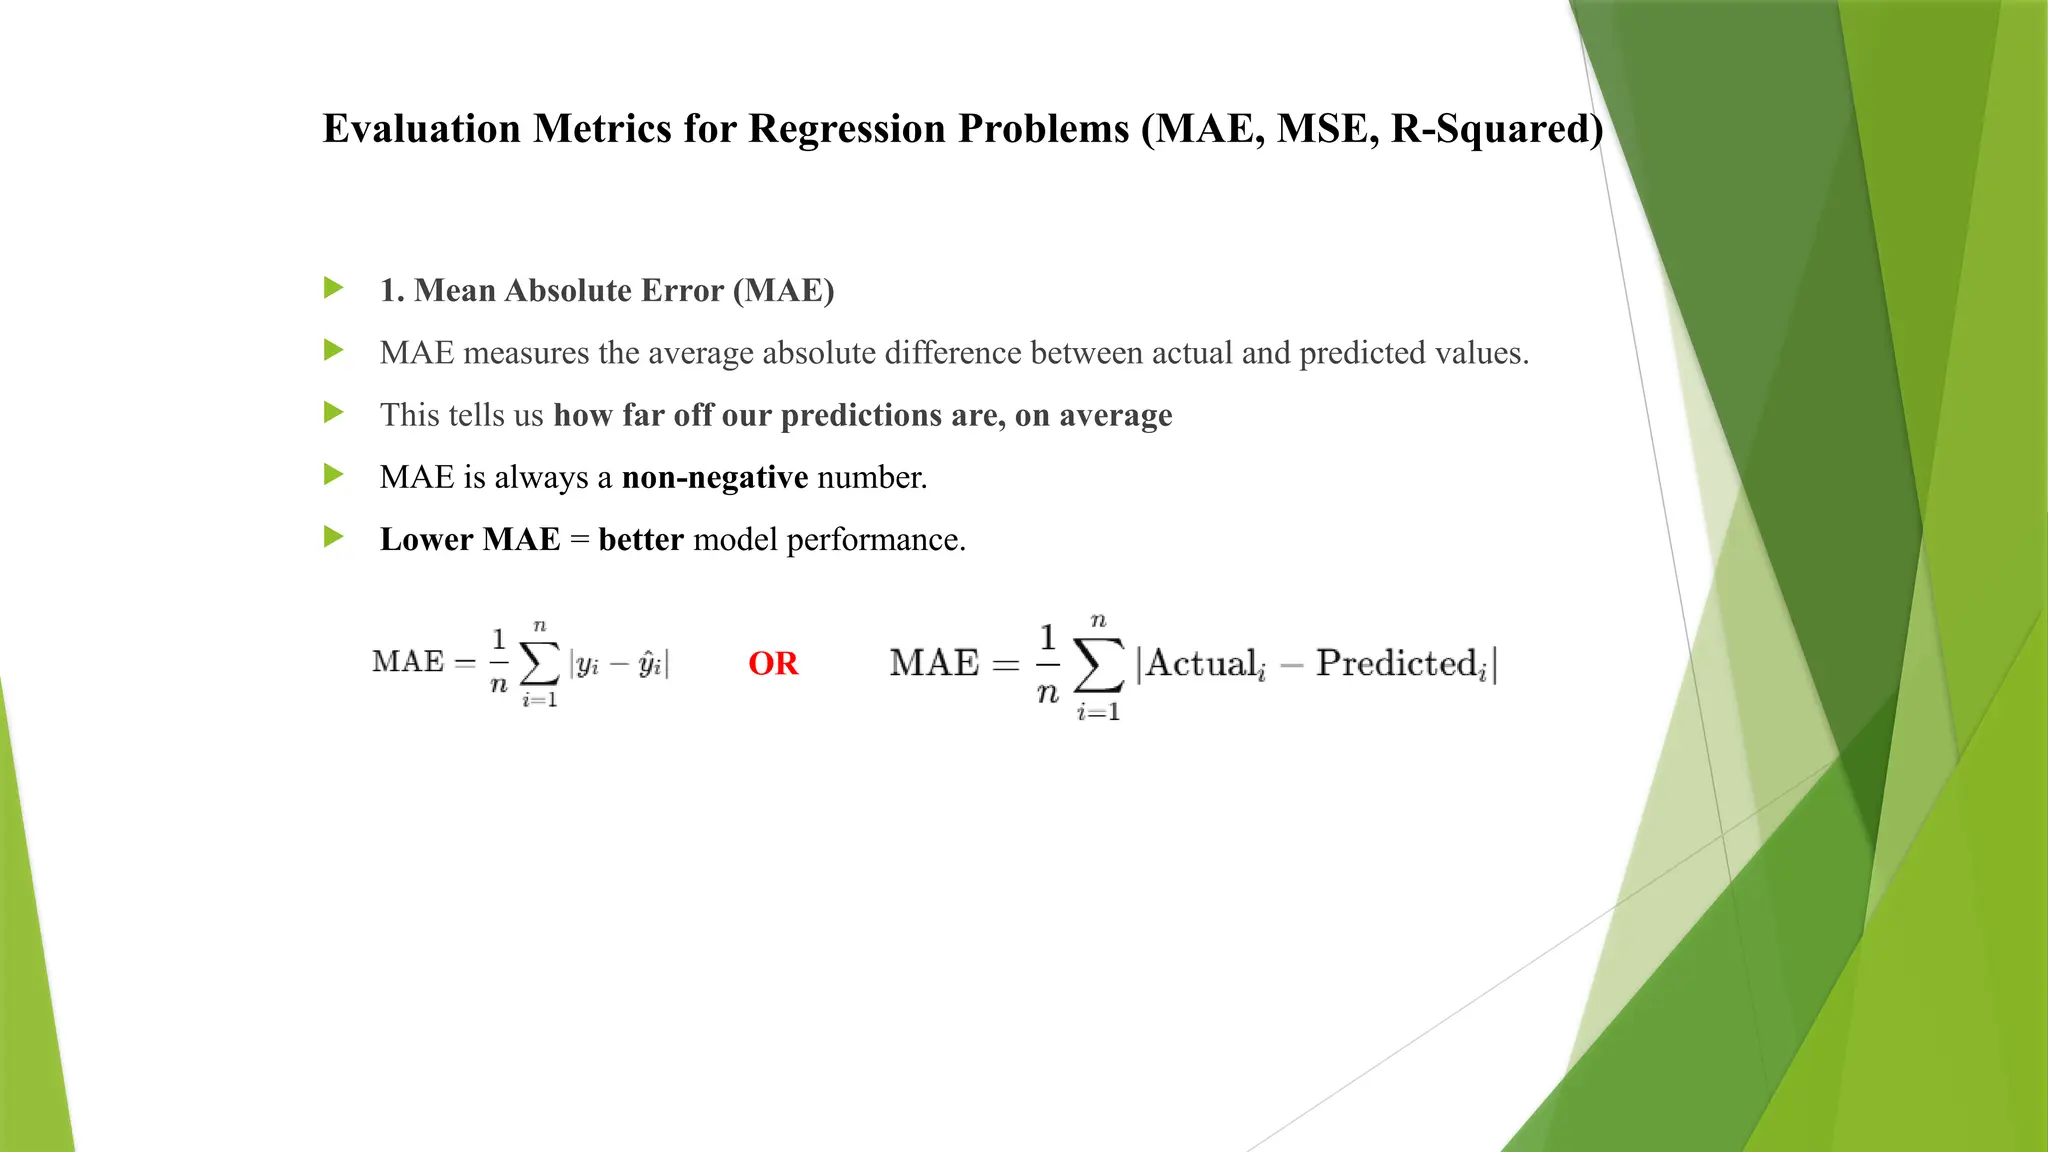
Evaluation Metrics forRegression Problems (MAE, MSE, R-Squared)
1. Mean Absolute Error (MAE)
MAE measures the average absolute difference between actual and predicted values.
This tells us how far off our predictions are, on average
MAE is always a non-negative number.
Lower MAE = better model performance.
OR
14.
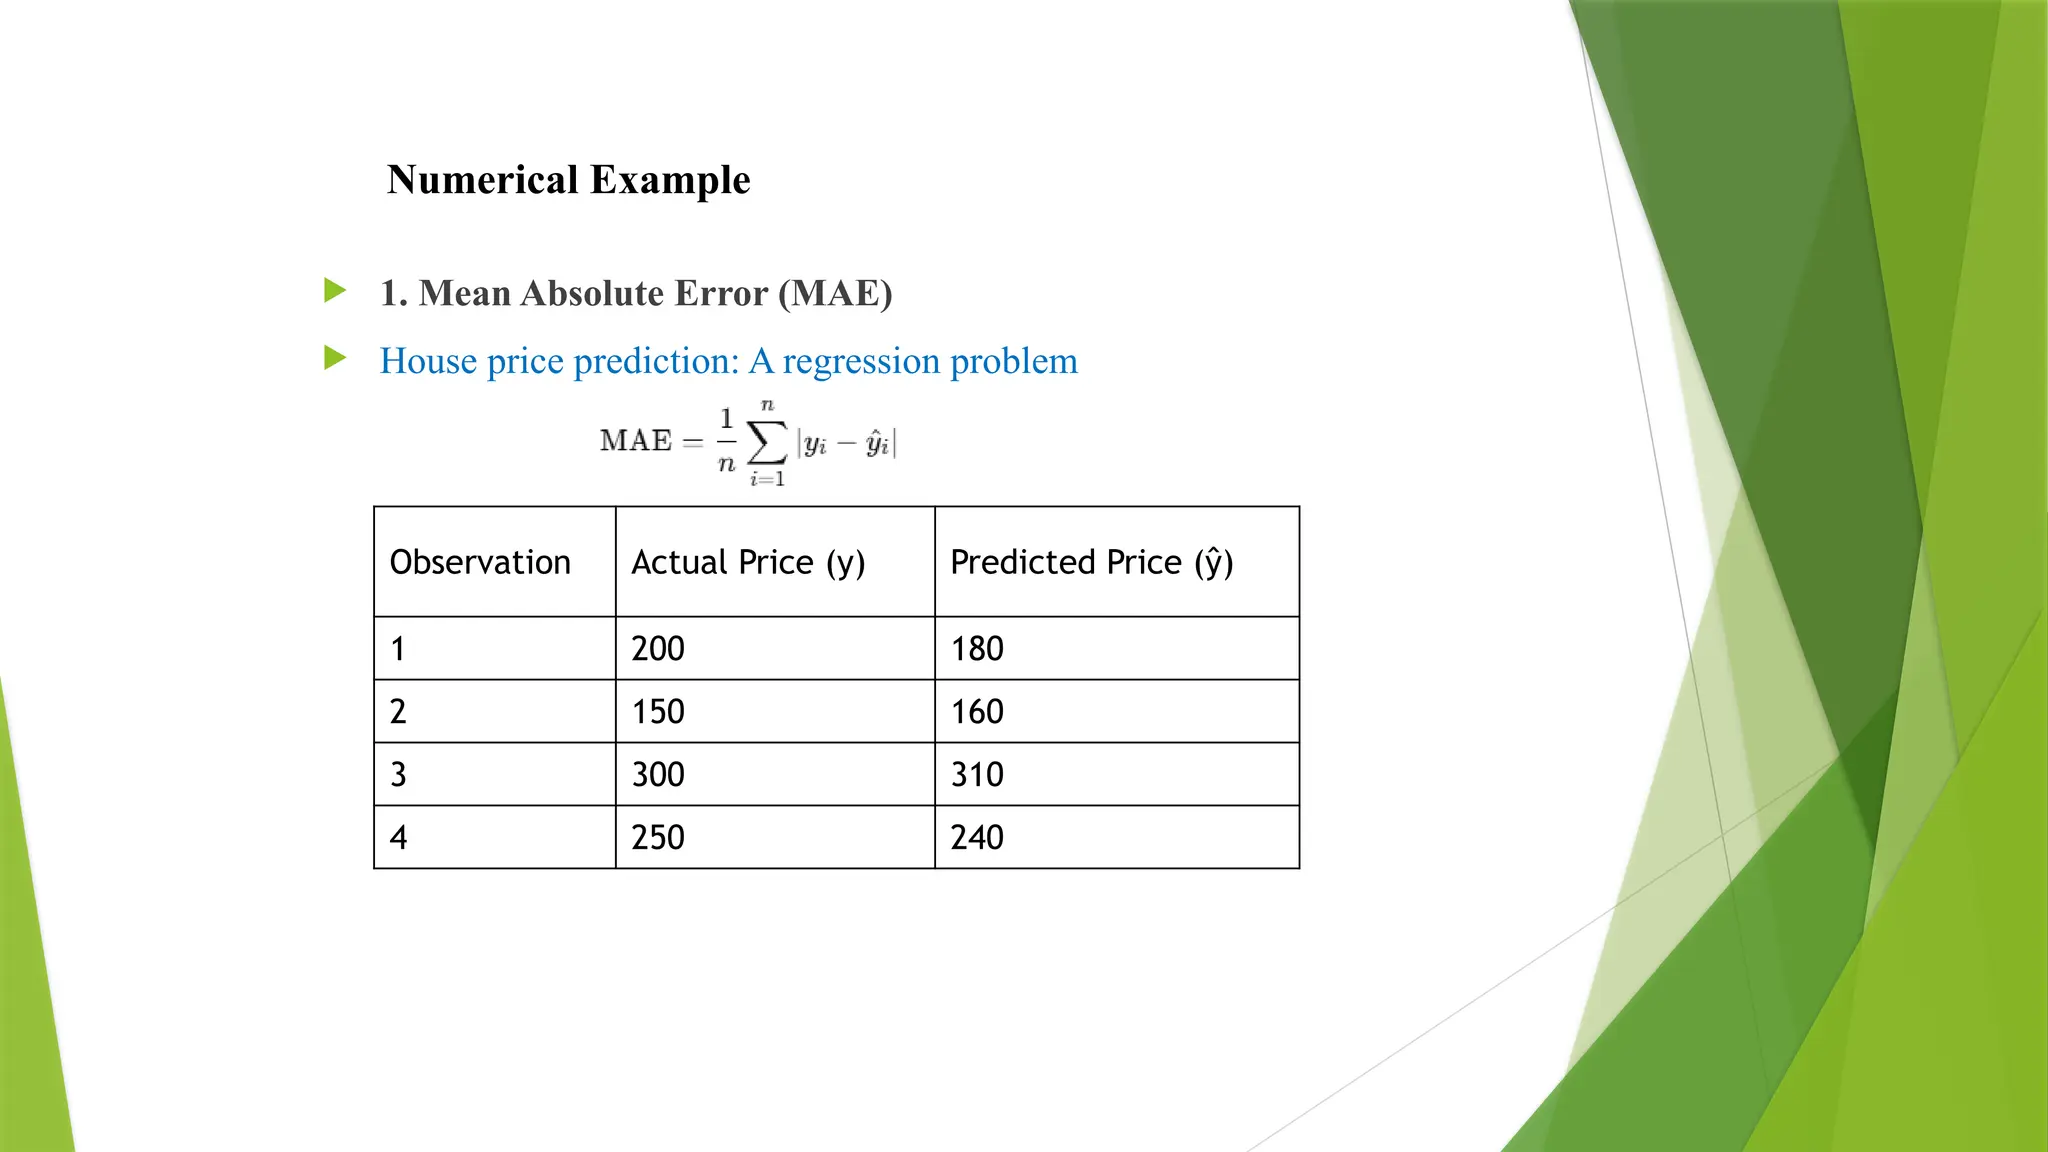
Numerical Example
1.Mean Absolute Error (MAE)
House price prediction: A regression problem
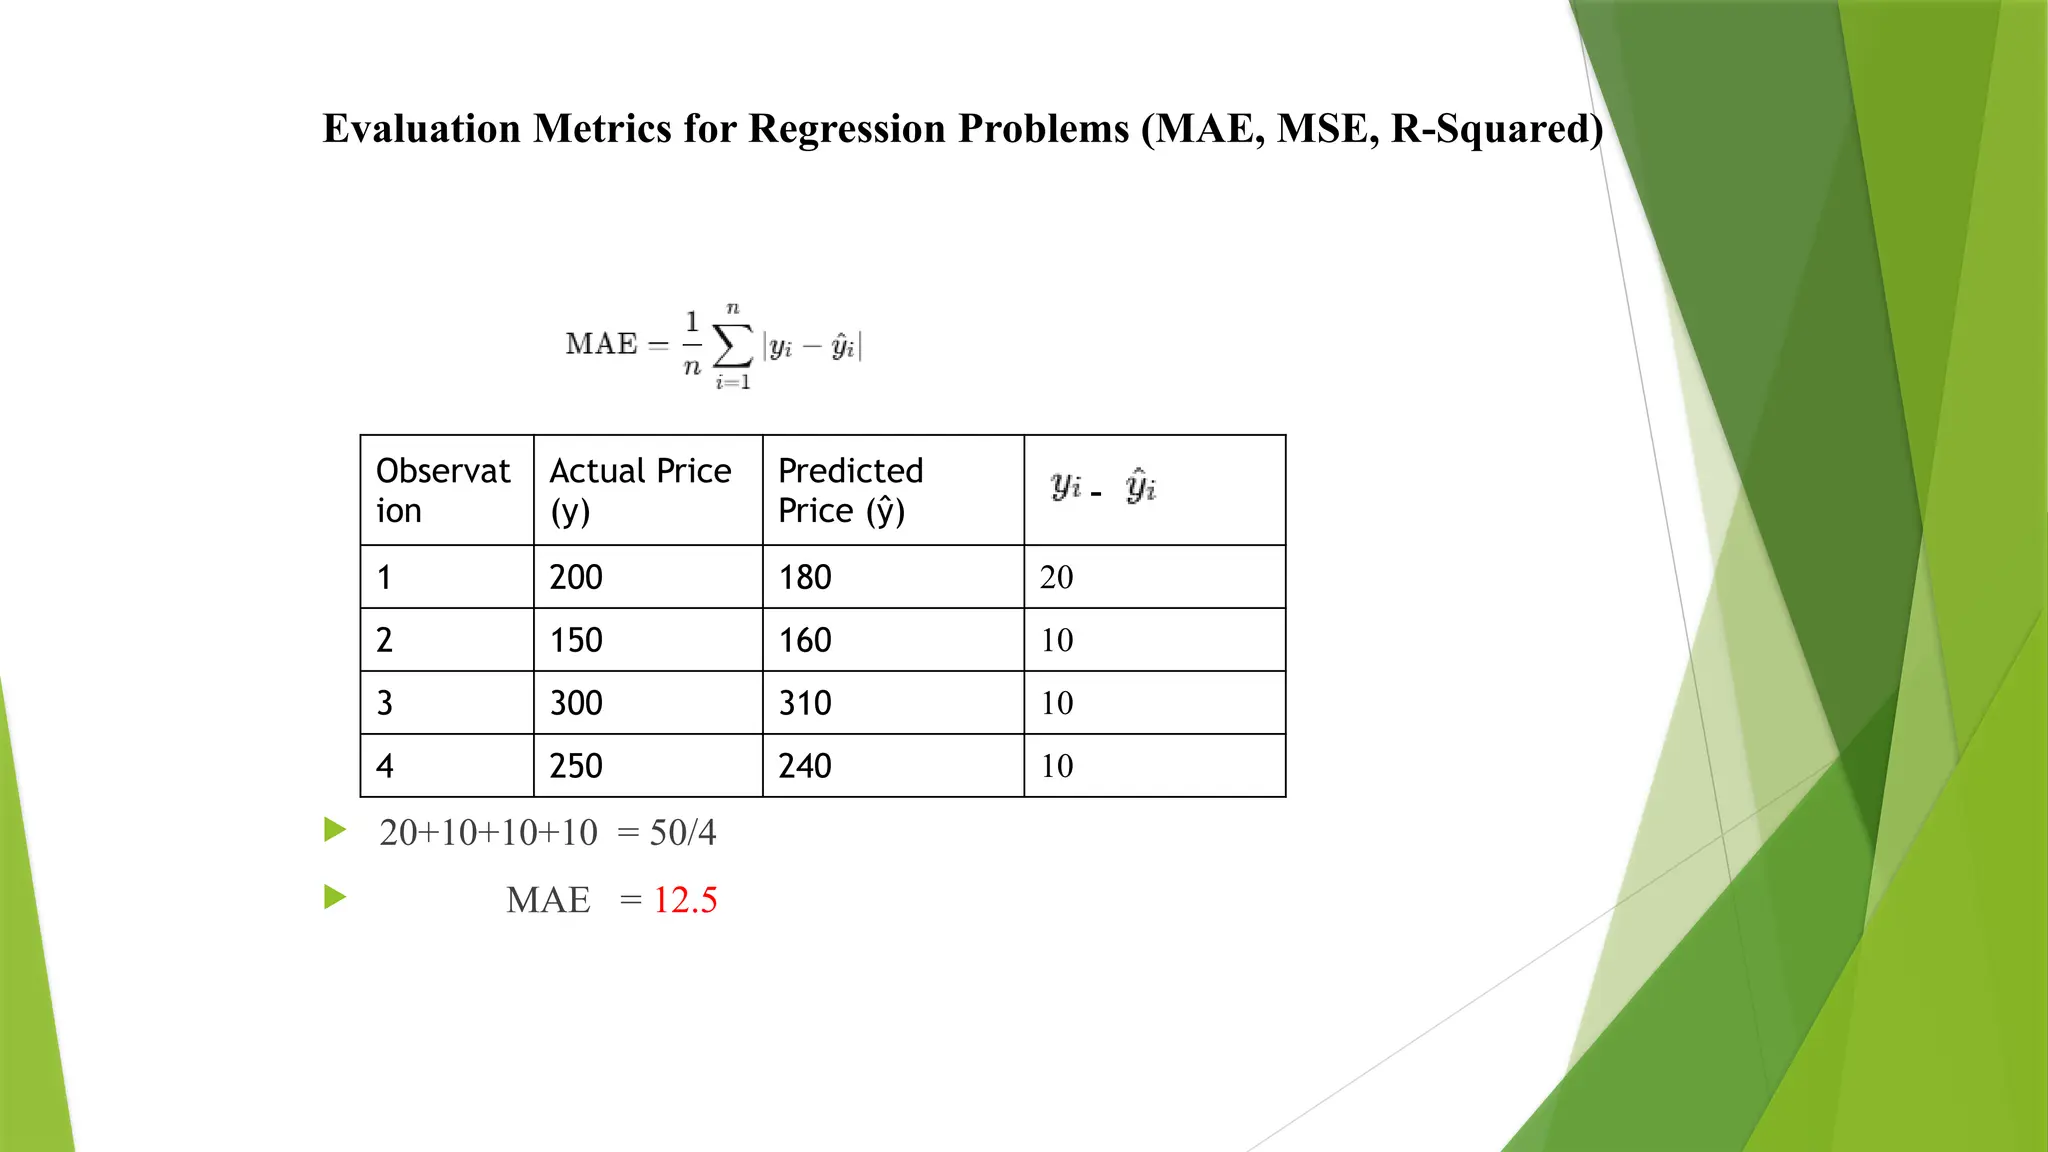
Observation Actual Price (y) Predicted Price (ŷ)
1 200 180
2 150 160
3 300 310
4 250 240
15.
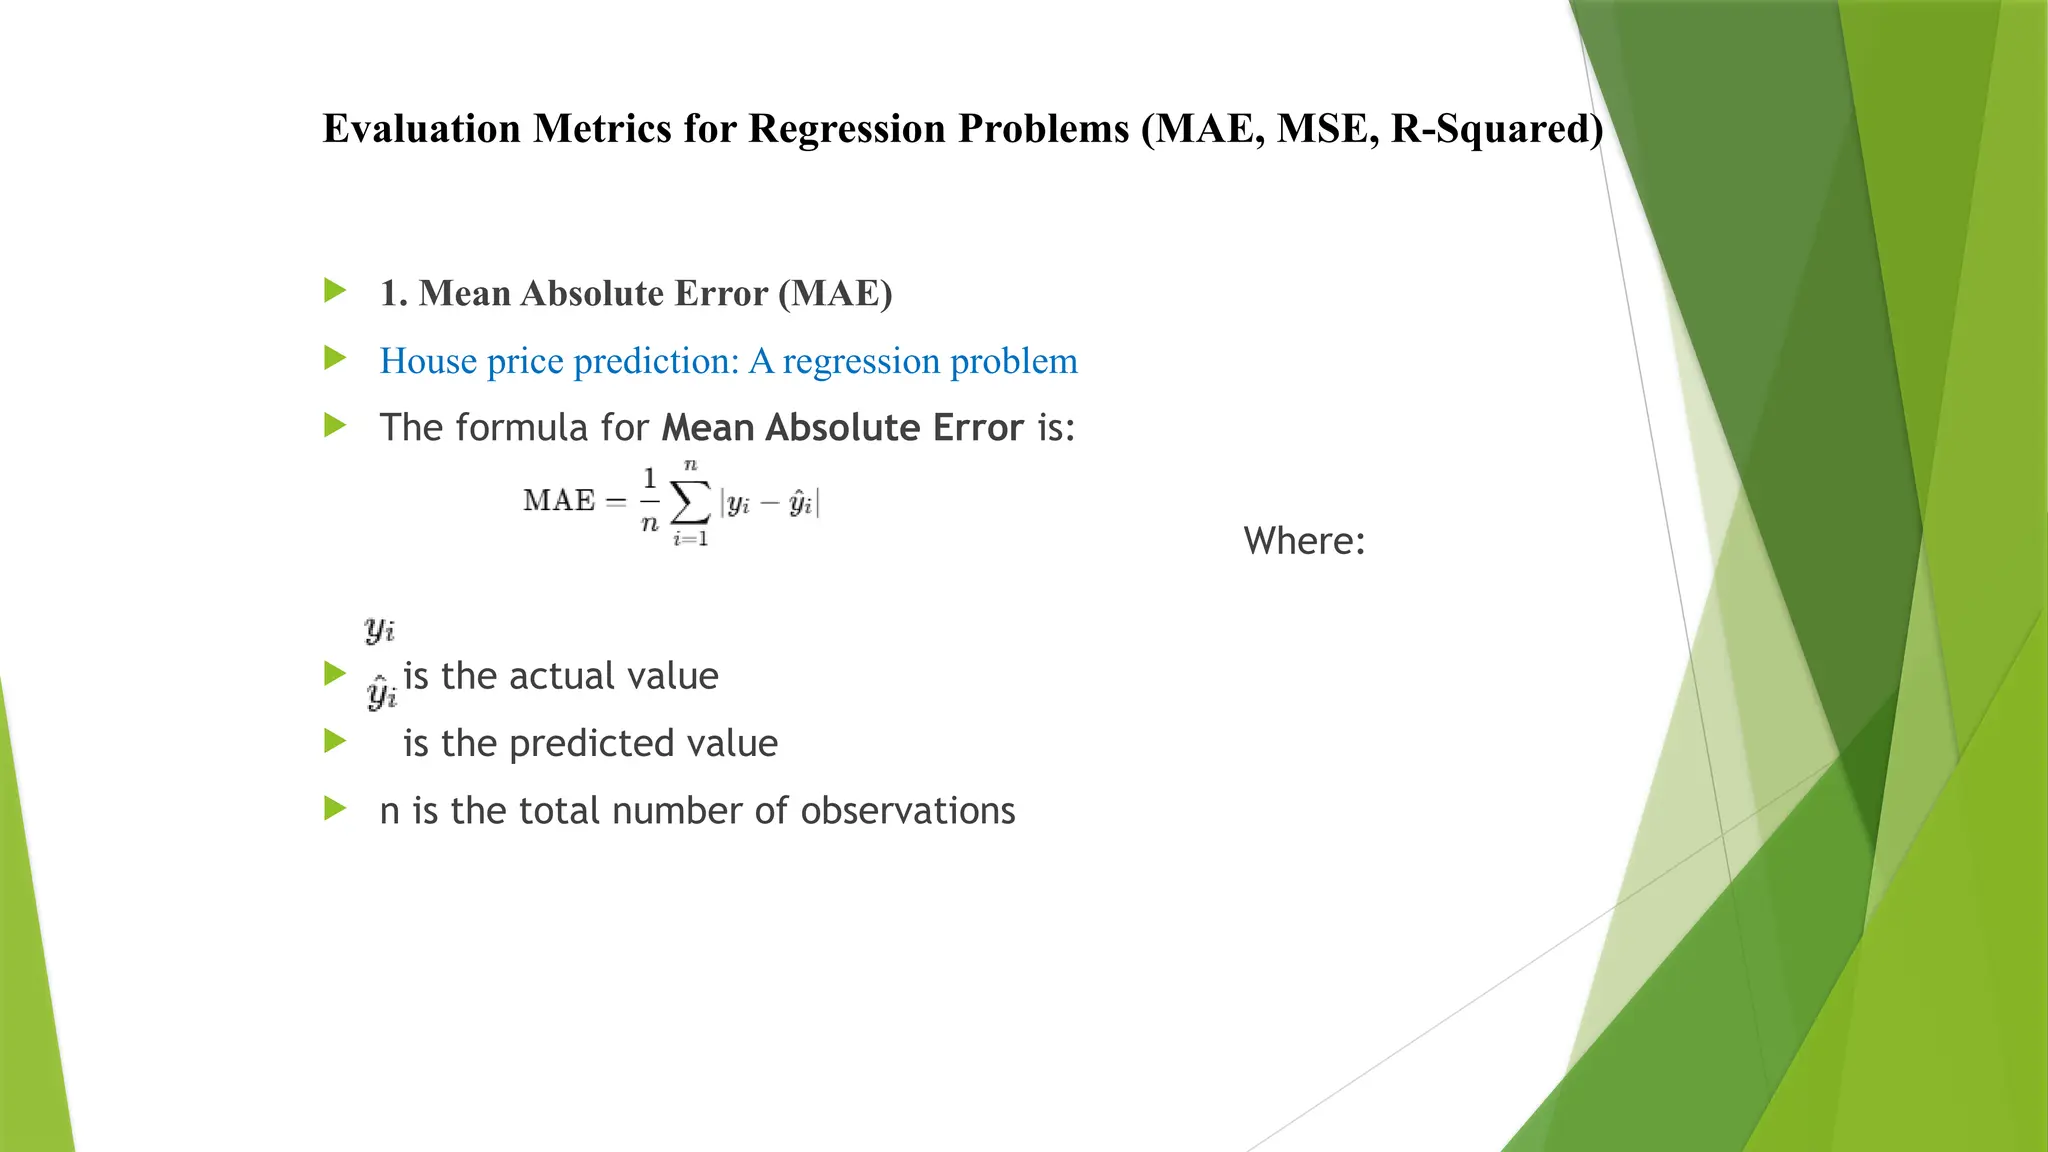
Evaluation Metrics forRegression Problems (MAE, MSE, R-Squared)
1. Mean Absolute Error (MAE)
House price prediction: A regression problem
The formula for Mean Absolute Error is:
Where:
is the actual value
is the predicted value
n is the total number of observations
Evaluation Metrics forRegression Problems (MAE, MSE, R-Squared)
from sklearn.metrics import mean_absolute_error, mean_squared_error
# Actual and predicted values
actual = [200, 150, 300, 250]
predicted = [180, 160, 310, 240]
# Calculate Mean Absolute Error (MAE)
mae = mean_absolute_error(actual, predicted)
# Calculate Mean Squared Error (MSE)
mse = mean_squared_error(actual, predicted)
print("Mean Absolute Error (MAE):", mae)
print("Mean Squared Error (MSE):", mse)
18.
Evaluation Metrics forRegression Problems (MAE, MSE, R-Squared)
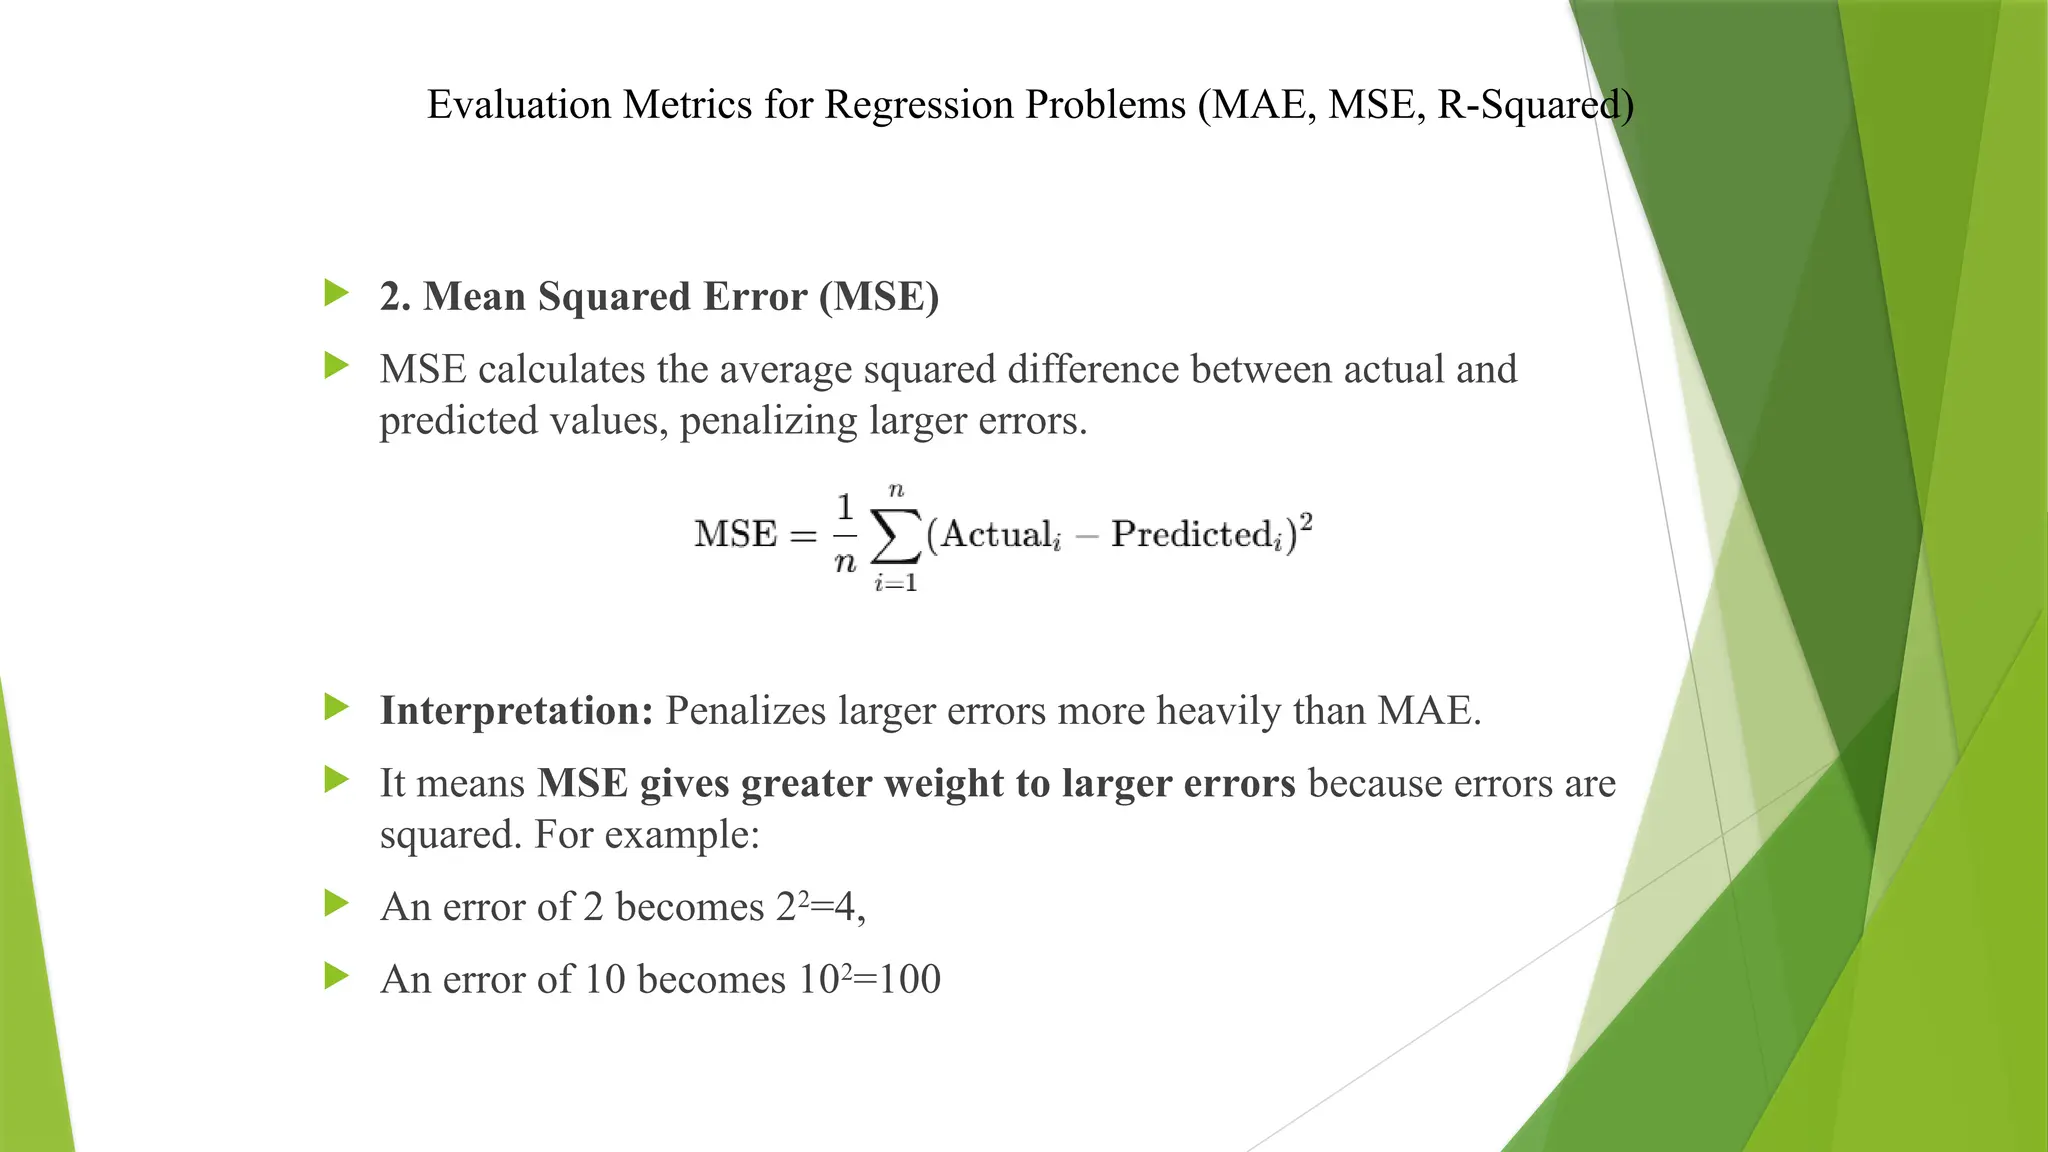
2. Mean Squared Error (MSE)
MSE calculates the average squared difference between actual and
predicted values, penalizing larger errors.
Interpretation: Penalizes larger errors more heavily than MAE.
It means MSE gives greater weight to larger errors because errors are
squared. For example:
An error of 2 becomes 22
=4,
An error of 10 becomes 102
=100
19.
Evaluation Metrics forRegression Problems (MAE, MSE, R-Squared)
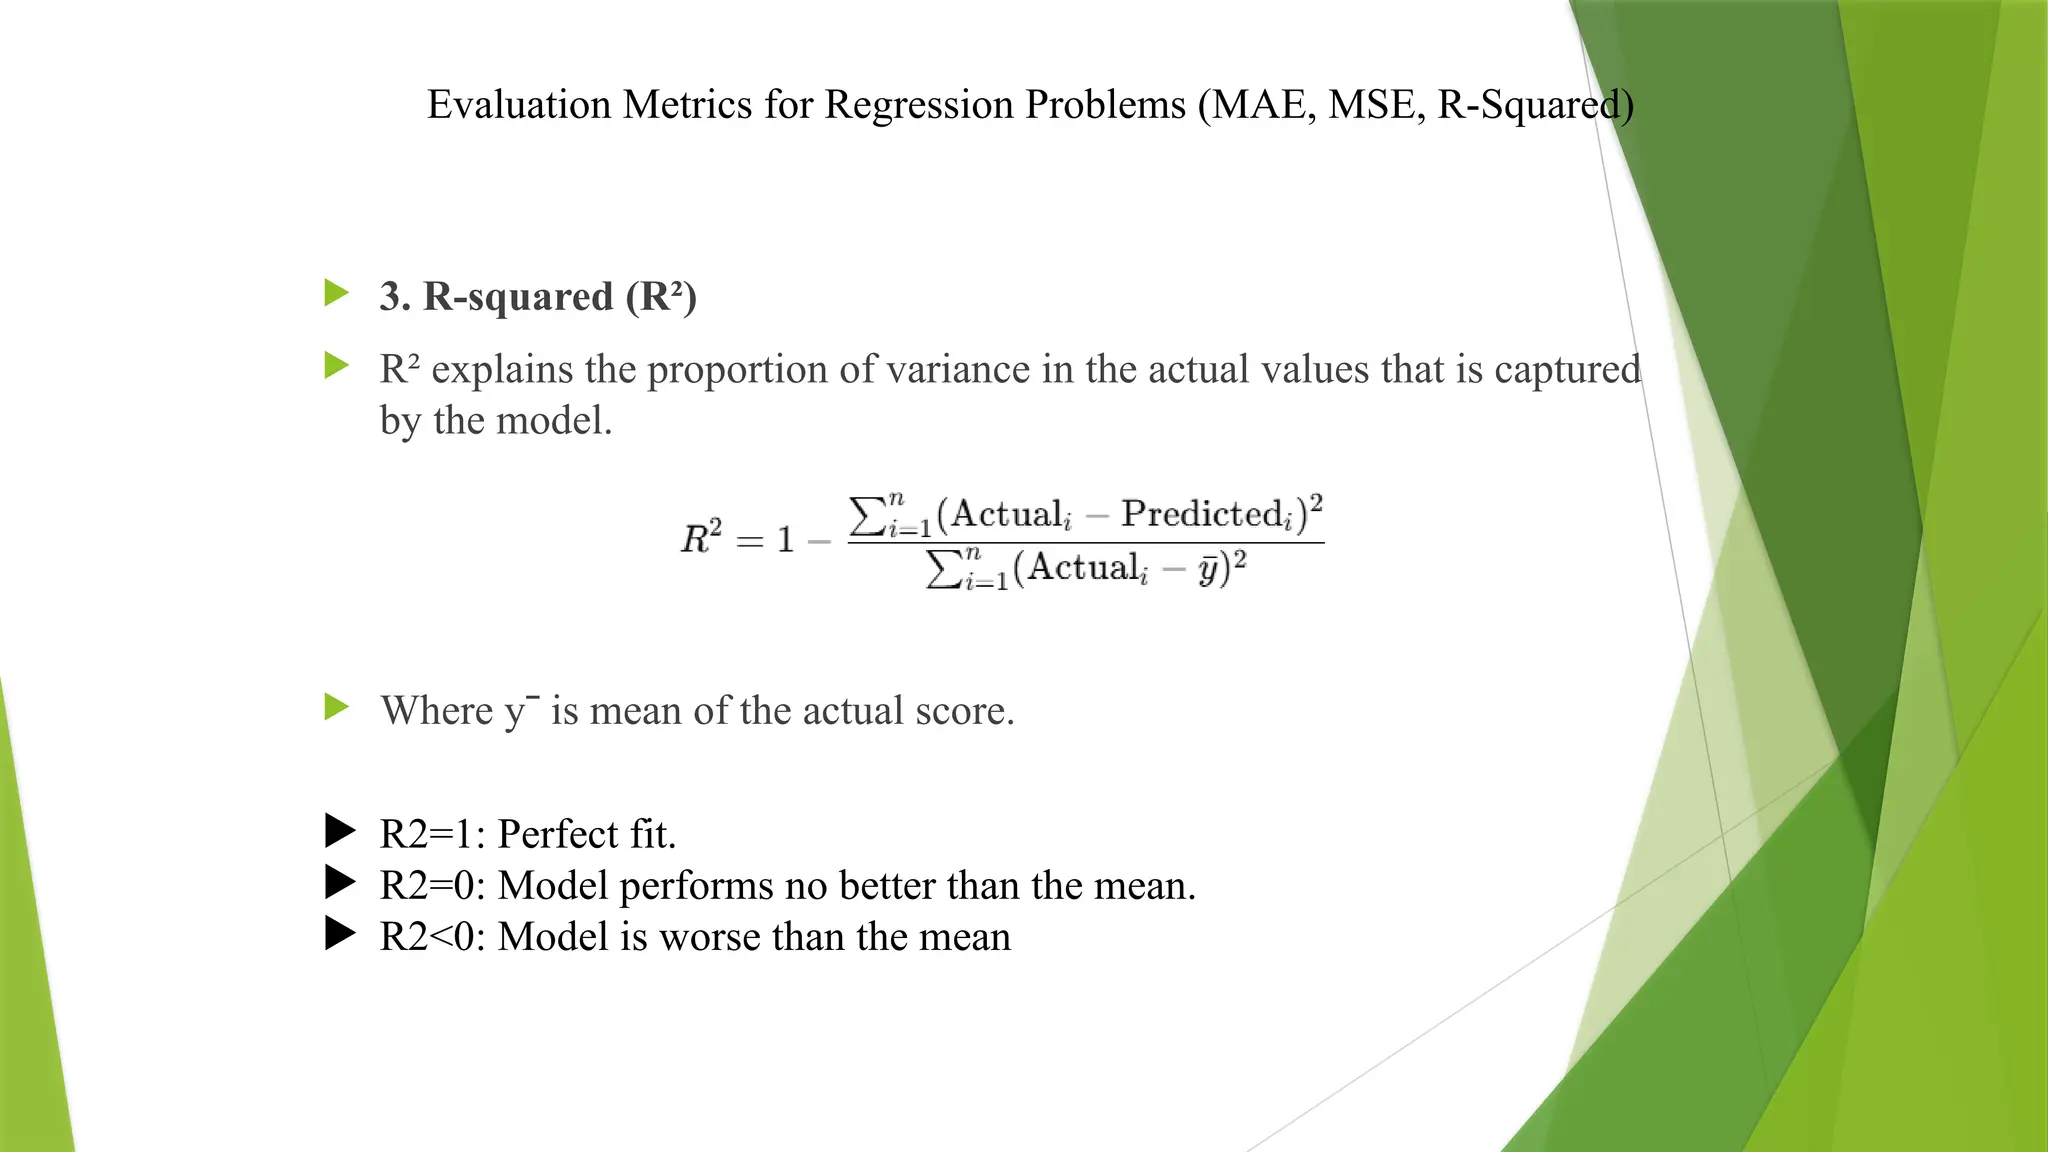
3. R-squared (R²)
R² explains the proportion of variance in the actual values that is captured
by the model.
Where yˉ is mean of the actual score.
R2=1: Perfect fit.
R2=0: Model performs no better than the mean.
R2<0: Model is worse than the mean
20.
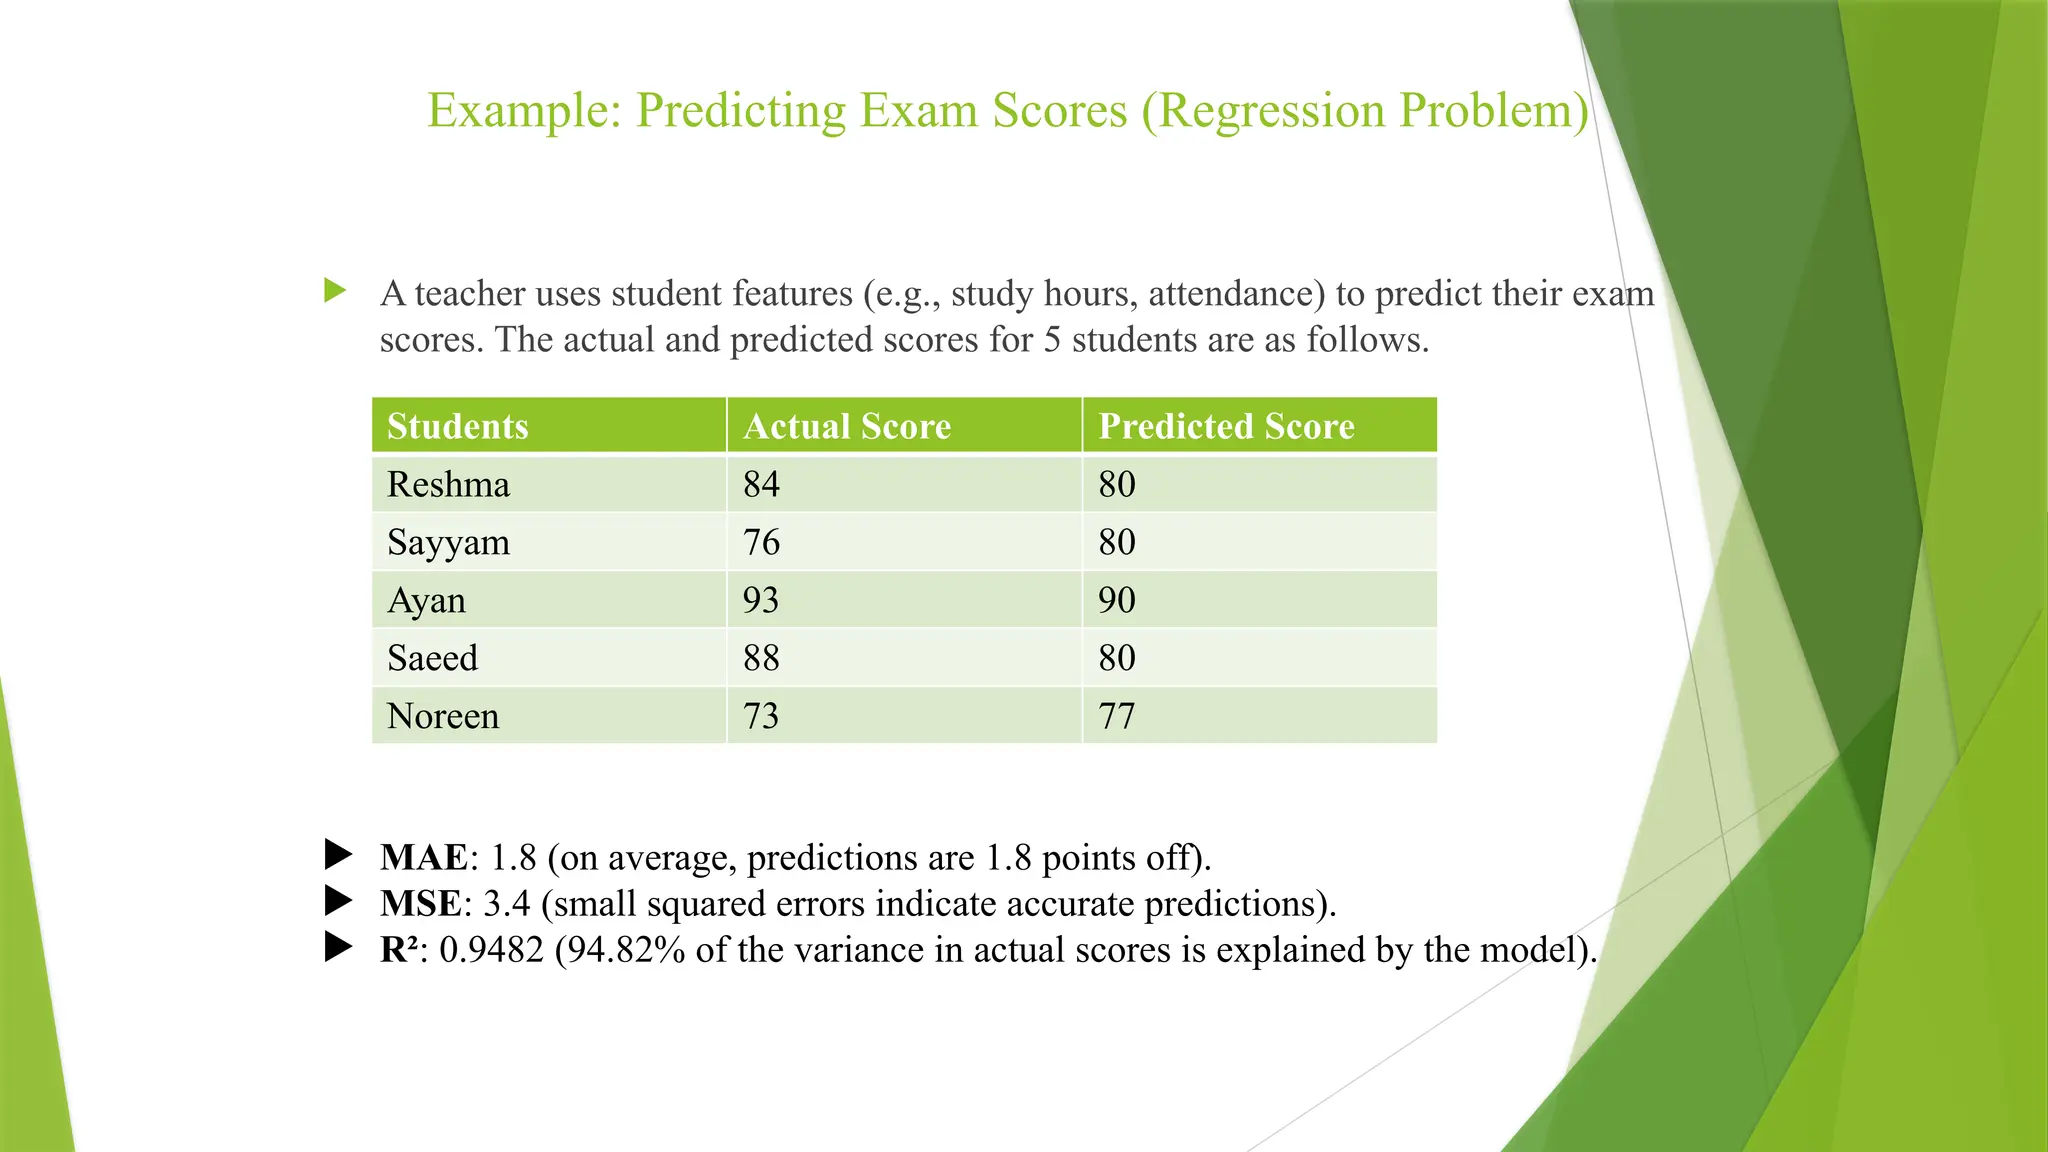
Example: Predicting ExamScores (Regression Problem)
A teacher uses student features (e.g., study hours, attendance) to predict their exam
scores. The actual and predicted scores for 5 students are as follows.
MAE: 1.8 (on average, predictions are 1.8 points off).
MSE: 3.4 (small squared errors indicate accurate predictions).
R²: 0.9482 (94.82% of the variance in actual scores is explained by the model).
Students Actual Score Predicted Score
Reshma 84 80
Sayyam 76 80
Ayan 93 90
Saeed 88 80
Noreen 73 77
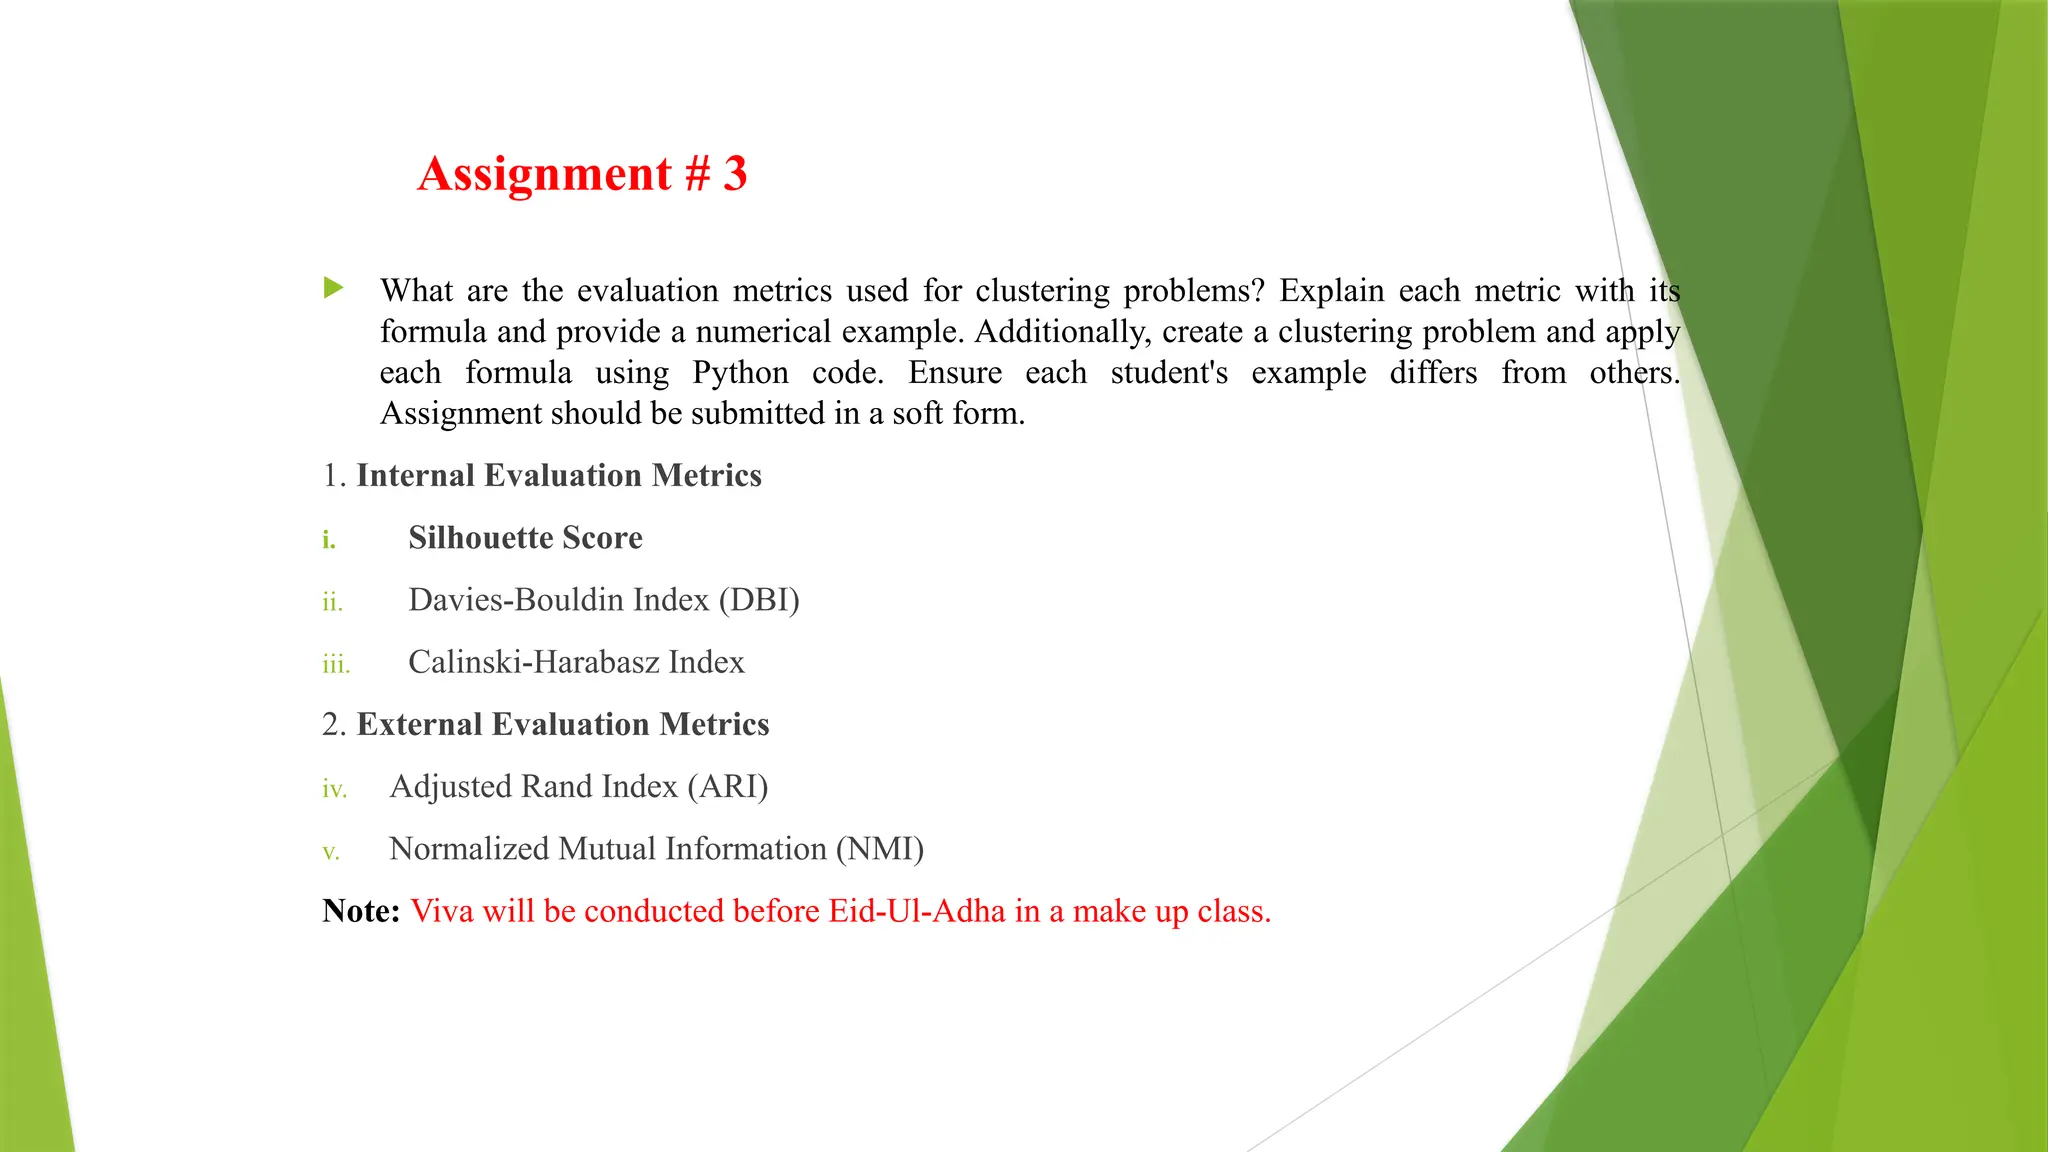
Assignment # 3
What are the evaluation metrics used for clustering problems? Explain each metric with its
formula and provide a numerical example. Additionally, create a clustering problem and apply
each formula using Python code. Ensure each student's example differs from others.
Assignment should be submitted in a soft form.
1. Internal Evaluation Metrics
i. Silhouette Score
ii. Davies-Bouldin Index (DBI)
iii. Calinski-Harabasz Index
2. External Evaluation Metrics
iv. Adjusted Rand Index (ARI)
v. Normalized Mutual Information (NMI)
Note: Viva will be conducted before Eid-Ul-Adha in a make up class.

![Evaluation Metrics for Regression Problems (MAE, MSE, R-Squared)
from sklearn.metrics import mean_absolute_error, mean_squared_error
# Actual and predicted values
actual = [200, 150, 300, 250]
predicted = [180, 160, 310, 240]
# Calculate Mean Absolute Error (MAE)
mae = mean_absolute_error(actual, predicted)
# Calculate Mean Squared Error (MSE)
mse = mean_squared_error(actual, predicted)
print("Mean Absolute Error (MAE):", mae)
print("Mean Squared Error (MSE):", mse)](https://image.slidesharecdn.com/ds-lecture-11-confusionmatrixandsampling-250602192434-25ecdde3/75/Confusion-Matrix-and-Sampling-in-ML-pptx-17-2048.jpg)
![Python code for MAE, MSE, R-Squared
import numpy as np
from sklearn.metrics import mean_absolute_error, mean_squared_error, r2_score
# Actual and predicted scores
actual_scores = np.array([85, 90, 78, 92, 70])
predicted_scores = np.array([87, 88, 80, 91, 72])
# Calculate metrics
mae = mean_absolute_error(actual_scores, predicted_scores)
mse = mean_squared_error(actual_scores, predicted_scores)
r2 = r2_score(actual_scores, predicted_scores)
# Print results
print(“Mean Absolute Error (MAE)”, mae)
print(“Mean Squared Error (MSE)”, mse)
print(“R-squared (R²)”, r2)](https://image.slidesharecdn.com/ds-lecture-11-confusionmatrixandsampling-250602192434-25ecdde3/75/Confusion-Matrix-and-Sampling-in-ML-pptx-21-2048.jpg)


![PERFORMANCE_PREDICTION__PARAMETERS[1].pptx](https://cdn.slidesharecdn.com/ss_thumbnails/performancepredictionparameters1-240130171305-9f984922-thumbnail.jpg?width=640&height=640&fit=bounds)


![Coded Agents – with UiPath SDK + LangGraph [Virtual Hands-on Workshop]](https://cdn.slidesharecdn.com/ss_thumbnails/codedagentsdeck-251215155422-5497c599-thumbnail.jpg?width=640&height=640&fit=bounds)


