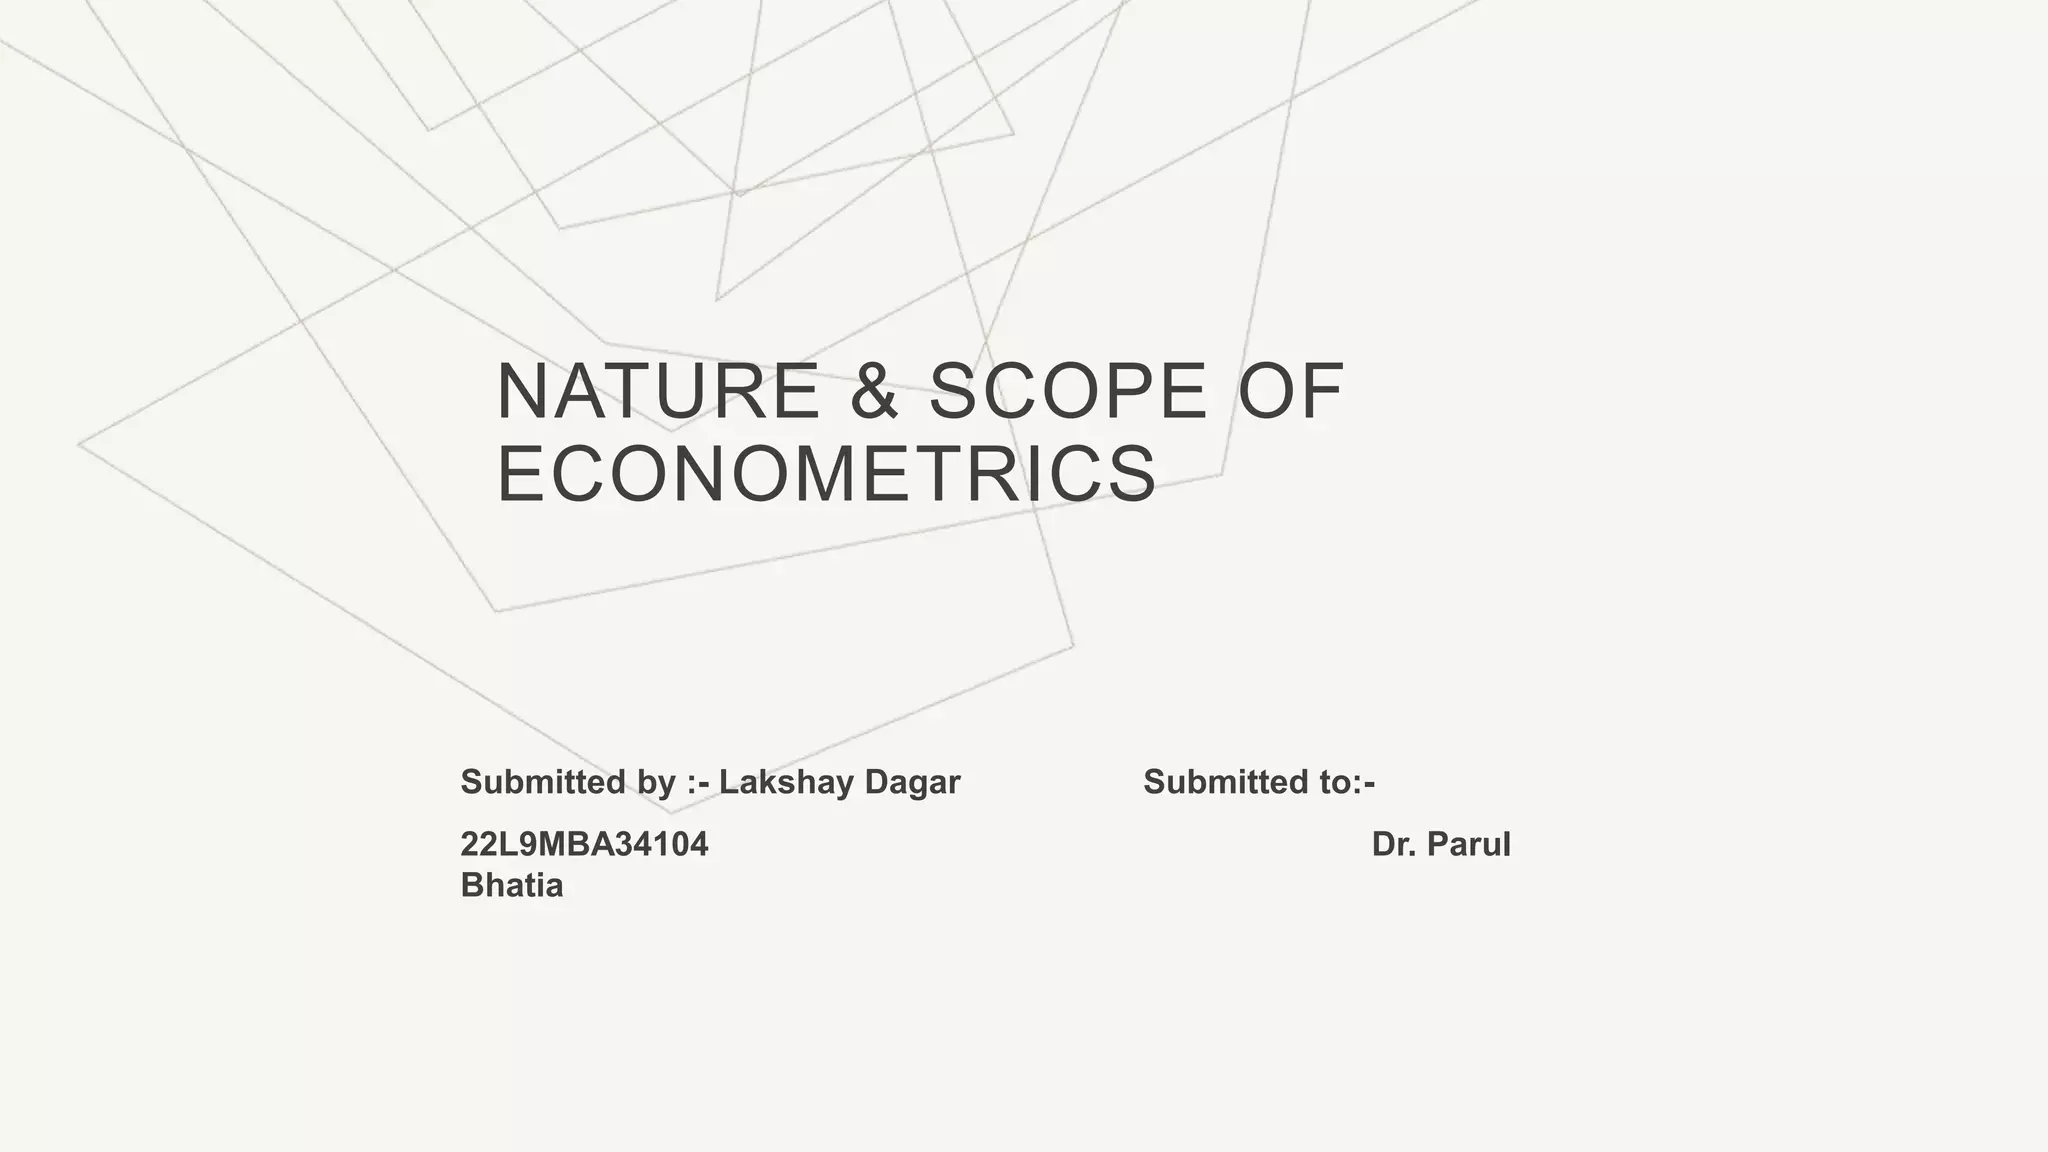
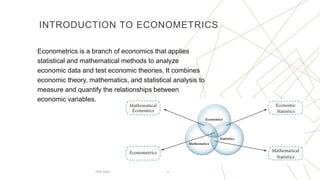
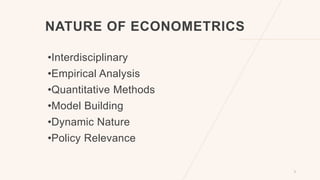
NATURE & SCOPE OF
ECONOMETRICS
Submitted by :- Lakshay Dagar Submitted to:-
22L9MBA34104 Dr. Parul
Bhatia
INTRODUCTION TO ECONOMETRICS
Pitch Deck 2
Econometrics is a branch of economics that applies
statistical and mathematical methods to analyze
economic data and test economic theories. It combines
economic theory, mathematics, and statistical analysis to
measure and quantify the relationships between
economic variables.
NATURE OF ECONOMETRICS
•Interdisciplinary
•Empirical Analysis
•Quantitative Methods
•Model Building
•Dynamic Nature
•Policy Relevance
3
SCOPE
•Statistical Analysis
•Causal Inference
•Policy Evaluation
•Forecasting
•Financial Analysis
•Academic Research
•Business Decision
Pitch Deck 4
TIME SERIES DATA
 Time series data is a sequence of
observations collected at regular intervals
over time.
 Common examples of time series data
include stock prices, economic indicators
such as GDP and unemployment rates,
weather data, and energy consumption data.
Pitch Deck 6
CROSS SECTIONAL DATA
• Cross-sectional data refers to data
collected from a group of individuals,
firms, or other entities at a specific point
in time.
Pitch Deck 7
PANEL DATA
• Panel data combines features of both
cross-sectional and time series data and
allows for the examination of both individual
and time effects on the dependent variable.
Pitch Deck 8
THANK YOU
9

intro to econometrics.pptx

  • 1.
    NATURE & SCOPEOF ECONOMETRICS Submitted by :- Lakshay Dagar Submitted to:- 22L9MBA34104 Dr. Parul Bhatia
  • 2.
    INTRODUCTION TO ECONOMETRICS PitchDeck 2 Econometrics is a branch of economics that applies statistical and mathematical methods to analyze economic data and test economic theories. It combines economic theory, mathematics, and statistical analysis to measure and quantify the relationships between economic variables.
  • 3.
    NATURE OF ECONOMETRICS •Interdisciplinary •EmpiricalAnalysis •Quantitative Methods •Model Building •Dynamic Nature •Policy Relevance 3
  • 4.
    SCOPE •Statistical Analysis •Causal Inference •PolicyEvaluation •Forecasting •Financial Analysis •Academic Research •Business Decision Pitch Deck 4
  • 6.
    TIME SERIES DATA Time series data is a sequence of observations collected at regular intervals over time.  Common examples of time series data include stock prices, economic indicators such as GDP and unemployment rates, weather data, and energy consumption data. Pitch Deck 6
  • 7.
    CROSS SECTIONAL DATA •Cross-sectional data refers to data collected from a group of individuals, firms, or other entities at a specific point in time. Pitch Deck 7
  • 8.
    PANEL DATA • Paneldata combines features of both cross-sectional and time series data and allows for the examination of both individual and time effects on the dependent variable. Pitch Deck 8
  • 9.