Download to read offline
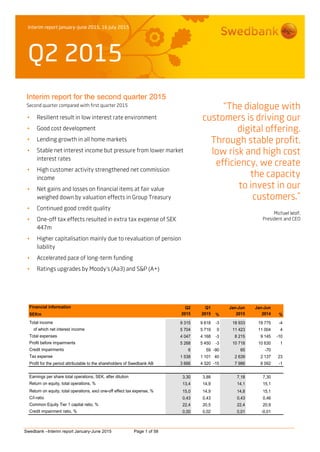


The document is Swedbank's interim report for the second quarter of 2015. It summarizes their financial results including a 1% decrease in total income and a 10% decrease in total expenses compared to the same period last year. It also discusses trends in different business segments, continued low credit impairments, and higher capital ratios. The CEO comments on market volatility, high customer activity, digital development, and maintaining a low risk profile.


