Download to read offline
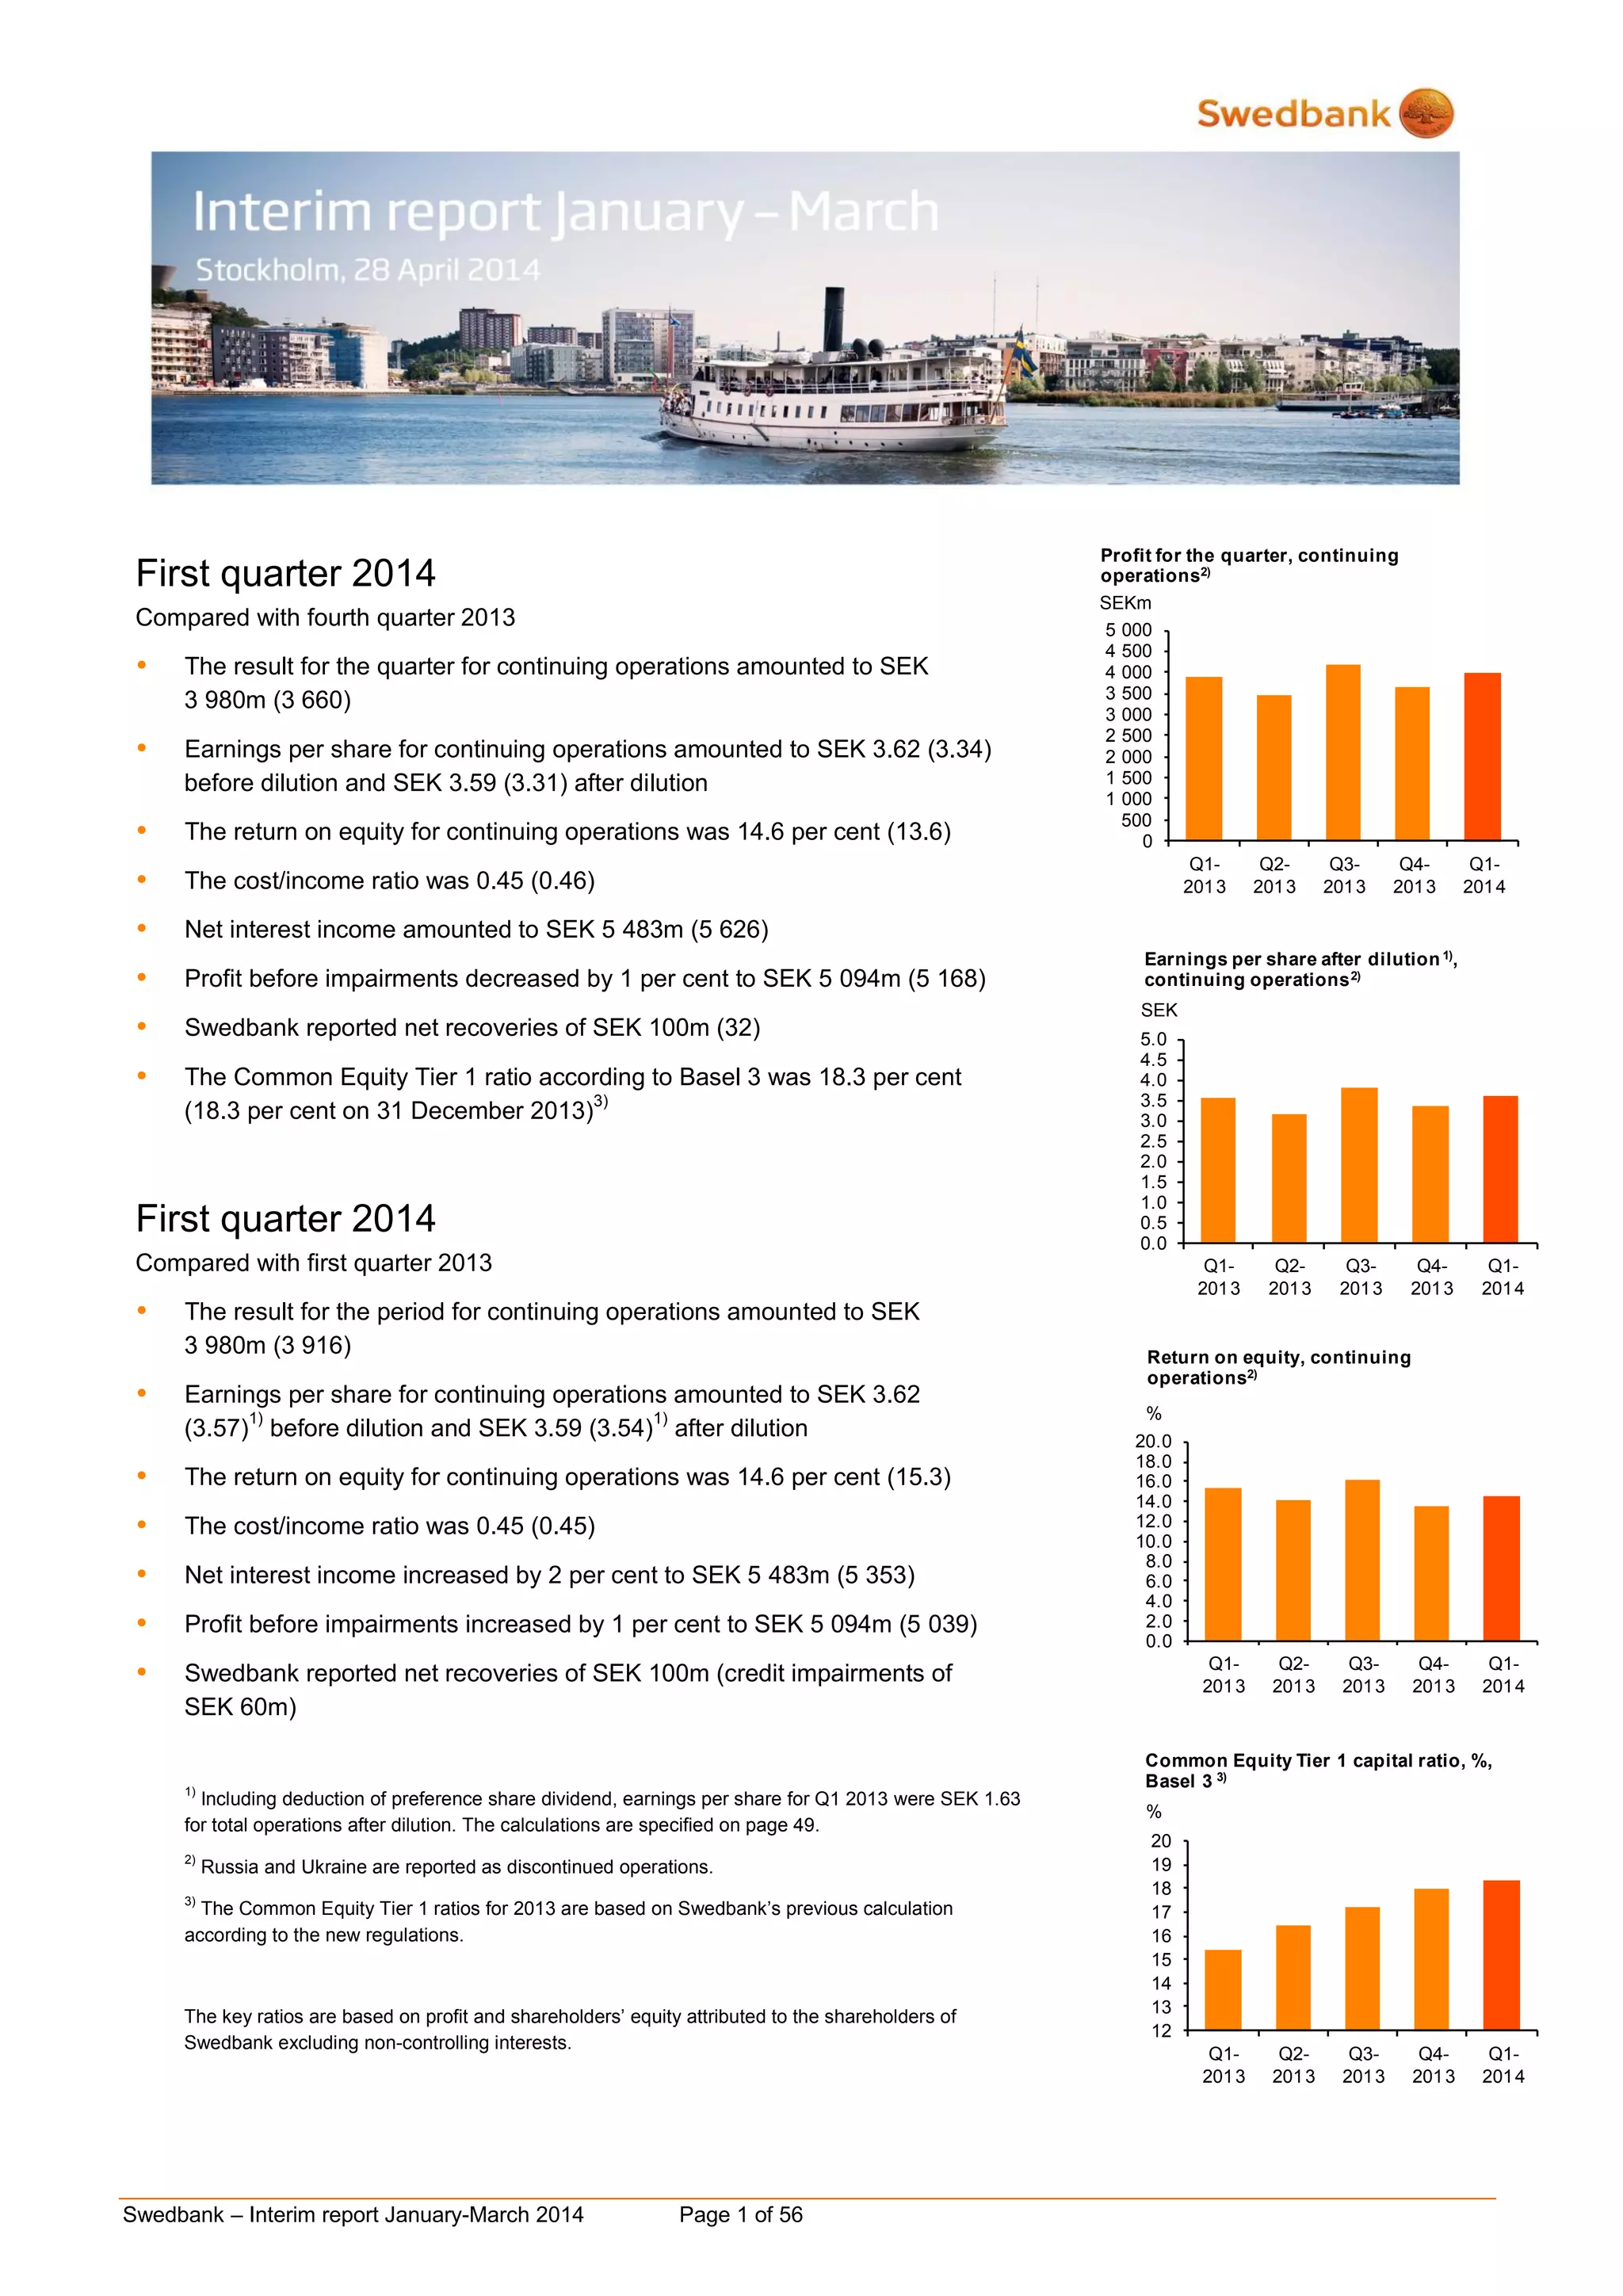
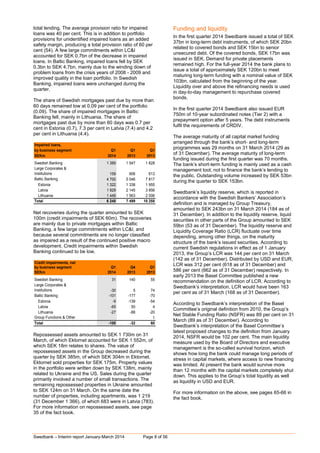
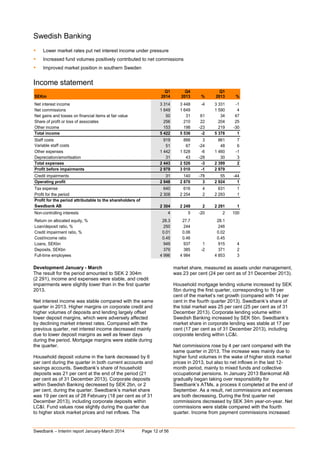
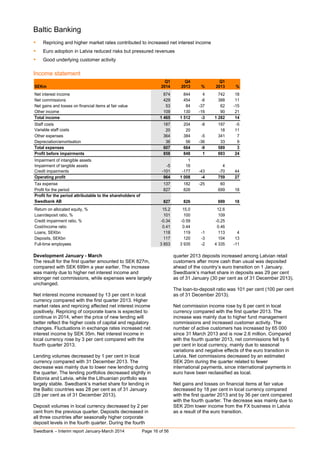
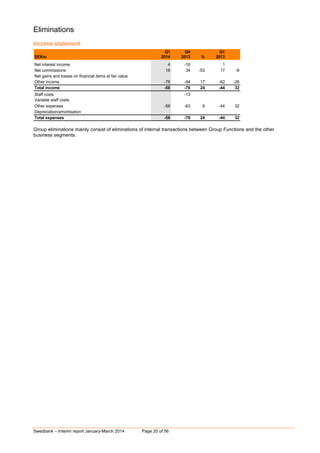
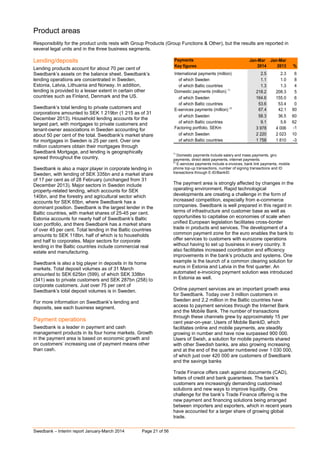
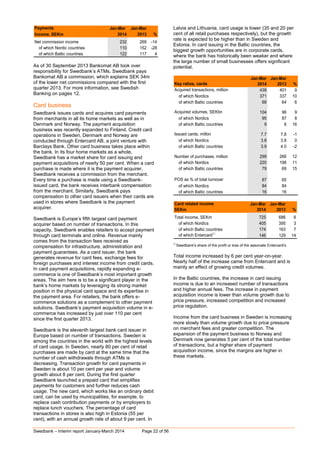
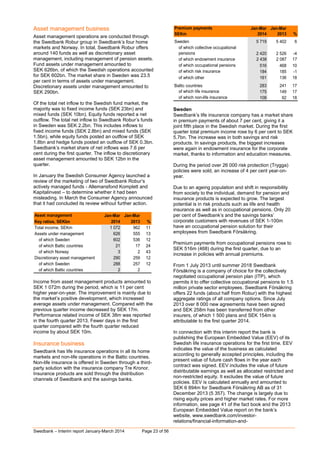
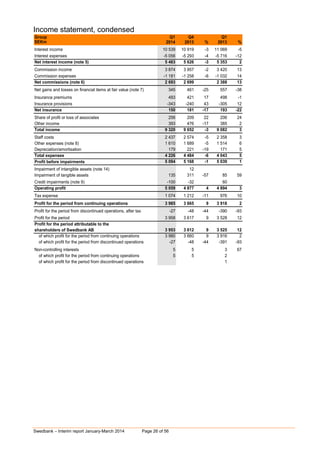
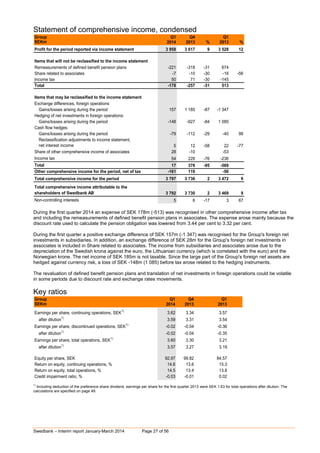
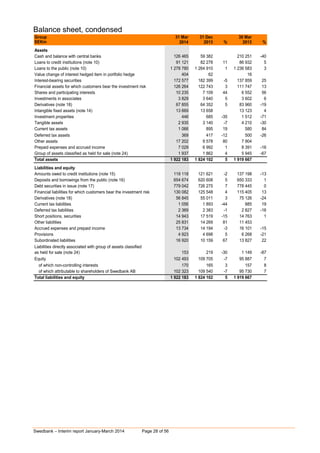
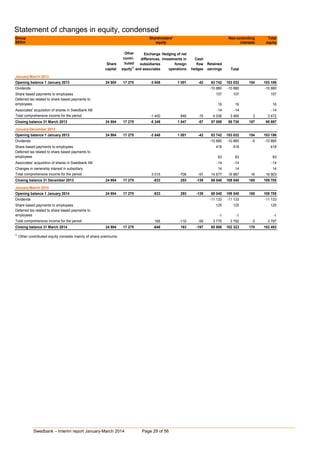
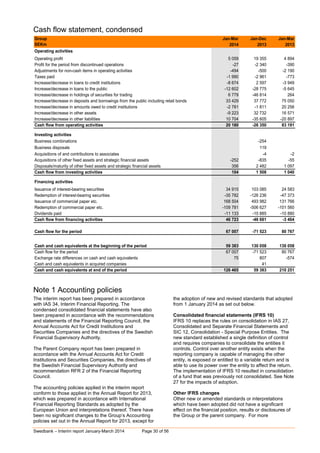
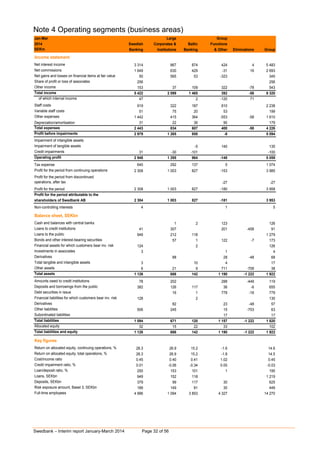
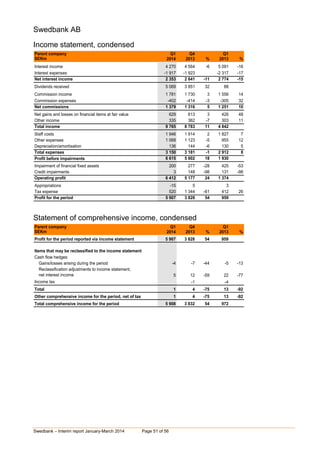

This document is Swedbank's interim report for the first quarter of 2014. It summarizes their financial performance compared to the previous quarter and the first quarter of 2013. Some key points: - Net profit for the quarter was SEK 3,980 million, unchanged from the previous quarter but up slightly from SEK 3,916 million in Q1 2013. - Earnings per share were SEK 3.62, unchanged from the previous quarter and up slightly from SEK 3.57 in Q1 2013. - Return on equity was 14.6%, unchanged from the previous quarter but down slightly from 15.3% in Q1 2013. - The bank's Common Equity Tier


