1. SELECTED FINANCIAL DATA.
The following summary of certain consolidated financial information was derived from Credco’s
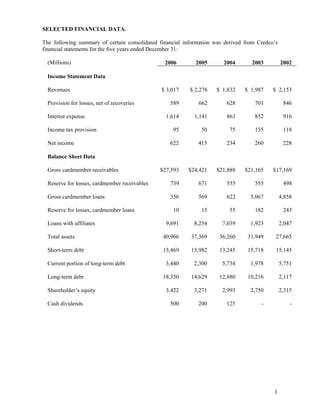
financial statements for the five years ended December 31:
(Millions) 2006 2005 2004 2003 2002
Income Statement Data
Revenues $ 3,017 $ 2,276 $ 1,832 $ 1,987 $ 2,153
Provision for losses, net of recoveries 589 662 628 701 846
Interest expense 1,614 1,141 863 852 916
Income tax provision 95 50 75 135 118
Net income 622 415 234 260 228
Balance Sheet Data
Gross cardmember receivables $27,593 $24,421 $21,888 $21,165 $17,169
Reserve for losses, cardmember receivables 739 671 555 555 498
Gross cardmember loans 356 569 622 5,067 4,858
Reserve for losses, cardmember loans 10 15 55 182 243
Loans with affiliates 9,691 8,254 7,039 1,923 2,047
Total assets 40,966 37,369 36,260 31,949 27,665
Short-term debt 15,469 15,982 13,245 15,718 15,145
Current portion of long-term debt 3,440 2,300 5,734 1,978 5,751
Long-term debt 18,350 14,629 12,880 10,216 2,117
Shareholder’s equity 3,422 3,271 2,993 2,750 2,315
Cash dividends 500 200 125 - -
1
2. MANAGEMENT’S DISCUSSION AND ANALYSIS OF FINANCIAL CONDITION AND
RESULTS OF OPERATION.
Critical Accounting Policies
American Express Credit Corporation’s (Credco) significant accounting policies are described in
Note 1 to the Consolidated Financial Statements. The following provides information about critical
accounting policies that are important to the Consolidated Financial Statements and that involve
estimates requiring significant management assumptions and judgments about the effect of matters
that are uncertain. These policies relate to reserves for cardmember losses.
Reserves for cardmember losses
Credco’s reserves for losses relating to cardmember receivables and loans represent management’s
estimate of the losses inherent in Credco’s outstanding portfolio of loans and receivables.
Management’s evaluation process requires certain estimates and judgments. Reserves for these losses
are primarily based upon models that analyze several specific portfolio statistics, including average
write-off rates for various stages of receivable aging (i.e., current, 30 days, 60 days, 90 days) over a
24-month period (loan balances are written- off when 180 days past due), and average bankruptcy and
recovery rates. Also, to a lesser extent, these reserves reflect management’s judgment regarding
overall reserve adequacy. Management considers whether to adjust reserves that are calculated by the
analytic models based on other factors, such as the level of coverage of past-due accounts, as well as
leading economic and market indicators, such as the unemployment rate, the consumer confidence
index, the purchasing manager’s index, bankruptcy filings and the legal and regulatory environment.
Receivables and loans are written-off when management deems amounts to be uncollectible, and is
generally determined by the number of days past due. In general, receivables and loans in bankruptcy
or owed by deceased individuals are written-off upon notification, or 180 days past due for lending
products and 360 days past due for charge card products. To the extent historical credit experience is
not indicative of future performance, actual loss experience could differ significantly from
management’s judgments and expectations, resulting in either higher or lower future provisions for
losses, as applicable. As of December 31, 2006, if average write-off rates were five percent higher or
lower, the reserve for losses would change by approximately $37 million.
Consolidated Capital Resources and Liquidity
Credco is committed to maintaining cost-effective, well-diversified funding programs to support
current and future asset growth in its global businesses. Credco’s funding plan is structured to meet
expected and changing business needs to fund asset balances efficiently and cost-effectively. Credco
relies on diverse sources, to help ensure the availability of financing in unexpected periods of stress
and to manage interest rate exposures. In addition to the funding plan described below, Credco has a
contingent funding strategy to allow for the continued funding of business operations through
difficult economic, financial market and business conditions when access to regular funding sources
could become diminished or interrupted.
Financing Activities
Credco’s funding requirements are met primarily by the sale of commercial paper, the issuance of
medium- and long-term notes, borrowings under long-term bank credit facilities in certain
international markets and equity capital. Credco has readily sold the volume of commercial paper
necessary to meet its funding needs as well as to cover the daily maturities of commercial paper
issued. During 2006, Credco had uninterrupted access to the commercial paper and capital markets to
fund its business operations.
2
3. The commercial paper market represents the primary source of short-term funding for Credco.
Credco’s commercial paper is a widely recognized name among short-term investors. At December
31, 2006, Credco had $5.8 billion of commercial paper outstanding. The outstanding amount
decreased $1.9 billion or 25 percent from a year ago. Average commercial paper outstanding was
$7.8 billion and $8.1 billion in 2006 and 2005, respectively. Credco currently manages the level of
short-term debt outstanding such that its total back-up liquidity, including available bank credit
facilities and term liquidity portfolio investment securities, is not less than 100 percent of net short-
term debt. Net short-term debt, which consists of commercial paper and certain other short-term
borrowings less cash and cash equivalents, was $5.1 billion at December 31, 2006. Based on the
maximum available borrowings under bank credit facilities and term liquidity portfolio investment
securities, Credco’s total back-up liquidity coverage of net short-term debt was 212 percent at
December 31, 2006.
Medium- and long-term debt is raised through the offering of debt securities in the United States and
international capital markets. Medium-term debt is generally defined as any debt with an original
maturity greater than 12 months but less than 36 months. Long-term debt is generally defined as any
debt with an original maturity greater than 36 months.
Credco had the following medium- and long-term debt outstanding at December 31:
(Billions) 2006 2005
Medium-term debt (a) $ 12.4 $ 8.6
Long-term debt 9.4 8.3
Total $ 21.8 $ 16.9
(a)
A portion of which can be extended by the holders up to an additional five years.
During 2006 and 2005, Credco’s average medium- and long-term debt outstanding was $19.2 billion
and $16.5 billion, respectively.
In 2006, United States and international fixed and floating rate medium- and long-term debt in an
aggregate principal amount of $8.4 billion with maturities ranging from two to five years was issued.
Credco, TRS, AEOCC, Centurion Bank, a wholly-owned subsidiary of TRS, and American Express
Bank Ltd., a wholly-owned subsidiary of American Express, have established a program for the
issuance, outside the U.S., of debt instruments to be listed on the Luxembourg Stock Exchange. As of
December 31, 2006, the maximum aggregate principal amount of debt instruments outstanding at any
one time under the program may not exceed $10.0 billion. The proceeds of these issuances were used
for financing operations, including the purchase of receivables and the repayment of previously
issued debt. At December 31, 2006, $4.5 billion was outstanding under this program, of which $3.2
billion were issued by Credco.
During 2005, Credco received regulatory approval in Canada for a base shelf prospectus for a
medium-term note program providing for the issuance from time to time, in Canada, of up to
approximately $3.0 billion of notes by American Express Canada Credit Corporation, a wholly-
owned subsidiary of Credco, which notes would be guaranteed by Credco. During 2006, Credco
issued and sold approximately $900 million of fixed medium-term notes due between 2008 and 2011
and approximately $400 million floating medium-term notes due 2008. At December 31, 2006,
approximately $2.0 billion of debt securities was outstanding under this program.
During the fourth quarter of 2006, Credco established a program for the issuance from time to time, in
Australia, of up to approximately $4.6 billion and issued approximately $118 million of fixed rate
notes due in 2011 and approximately $236 million of floating rate notes due in 2011. At December
3
4. 31, 2006, approximately $4.3 billion was available for issuance under this program. Proceeds of the
notes were used to repay a portion of the Australian credit facility.
Credco also has the ability to issue debt securities under shelf registrations filed with the Securities
and Exchange Commission (SEC). During the second quarter of 2006, Credco filed a shelf
registration statement with the SEC for an unspecified amount of debt securities to be issued from
time to time. At December 31, 2006, Credco had $13.4 billion of debt securities outstanding, issued
under SEC registration statements.
Credco continues to issue long-term debt with a wide range of maturities to diversify the refinancing
requirement in future periods.
Credco’s funding strategy is designed to maintain high and stable debt ratings from the major credit
rating agencies, Moody’s, Standard & Poor’s and Fitch Ratings. Maintenance of high and stable debt
ratings is critical to ensuring Credco’s continuous access to the capital and credit markets. It also
enables Credco to reduce its overall borrowing costs. At December 31, 2006, Credco’s debt ratings
were as follows:
Standard
Moody’s & Poor’s Fitch Ratings
Short-term P-1 A-1 F1
Senior unsecured Aa3 A+ A+
Rating agencies review factors such as capital adequacy with a view towards maintaining certain
levels of capital, liquidity, business volumes, asset quality and economic market trends, among
others, in assessing Credco’s and its subsidiaries’ appropriate ratings.
Credco actively manages the risk of liquidity and cost of funds resulting from Credco’s financing
activities. Management believes a decline in Credco’s long-term credit rating by two levels could
result in Credco having to significantly reduce its commercial paper and other short-term borrowings.
Remaining borrowing requirements would be addressed through other means such as the issuance of
long-term debt and the sale of investment securities or drawing on existing credit lines. This would
result in higher interest expense on Credco’s commercial paper and other debt, as well as higher fees
related to unused lines of credit. Credco believes a two level downgrade is highly unlikely due to its
capital position and growth prospects.
Credco paid cash dividends of $500 million and $200 million to TRS in 2006 and 2005, respectively.
On February 9, 2007, Credco paid a cash dividend of $150 million to TRS.
Liquidity
Credco balances the trade-offs between having too much liquidity, which can be costly and limit
financial flexibility, with having inadequate liquidity, which may result in financial distress during a
liquidity event. Credco considers various factors in determining its liquidity needs, such as economic
and financial market conditions, seasonality in business operations, cost and availability of alternative
liquidity sources, and credit rating agency considerations. In 2006, short-term debt as a percentage of
total debt decreased to 42 percent at December 31, 2006, from 49 percent at December 31, 2005.
Credco estimates it will have funding requirements of approximately $3.4 billion within the next year
related to the maturity of medium- and long-term debt obligations. Credco believes that its funding
plan is adequate to meet these requirements. In addition, alternative liquidity sources are available,
mainly in the form of the liquidity portfolio, securitization of cardmember receivables and loans
through American Express affiliates, and bank credit facilities, to provide uninterrupted funding over
a twelve-month period should access to unsecured debt sources become impaired.
4
5. Credco has developed a contingent funding plan that enables it to meet its daily funding obligations
when access to unsecured funds in the debt capital markets is impaired or unavailable. This plan is
designed to ensure that Credco could continuously maintain normal business operations for a twelve-
month period in which its access to unsecured funds is interrupted. From time to time, Credco may
increase its liquidity portfolio in order to prefund maturing debt obligations when financial market
conditions are favorable. These levels are monitored and adjusted when necessary to maintain short-
term liquidity needs in response to seasonal or changing business conditions.
The funding sources that would be relied upon depend on the exact nature of such a hypothetical
liquidity crisis; nonetheless, Credco’s liquidity sources are designed with the goal of ensuring there is
sufficient cash on hand to fund business operations over a twelve-month period regardless of whether
the liquidity crisis was caused by an external, industry or Credco-specific event. The contingent
funding plan also addresses operating flexibilities in quickly making these funding sources available
to meet all financial obligations. The simulated liquidity crisis is defined as a sudden and unexpected
event that temporarily impairs access to or makes unavailable funding in the unsecured debt markets.
The contingent funding plan includes access to diverse sources of alternative funding. Such sources
include but are not limited to its liquidity investment portfolio, committed bank lines, intercompany
borrowings and securitization of cardmember receivables and loans through American Express
affiliates. Credco estimates that, under a worst case liquidity crisis scenario, it has identified up to
$8.3 billion in alternate funding sources available to cover cash needs over the first 60 days after a
liquidity crisis has occurred.
Liquidity Investment Portfolio
During the normal course of business, funding activities may raise more proceeds than are necessary
for immediate funding needs. These amounts are invested principally in short-term overnight, highly
liquid securities. Credco also maintains a term liquidity portfolio comprised of high credit quality,
highly liquid securities. At December 31, 2006, Credco held $3.0 billion of U.S. Treasury and
government agency securities in this portfolio. The invested amounts of the term liquidity portfolio
provide back-up liquidity, primarily for Credco’s commercial paper program. U.S. Treasury and
government agency securities are the highest credit quality and most liquid of investment instruments
available. Credco can easily sell these securities or enter into sale/repurchase agreements to
immediately raise cash proceeds to meet liquidity needs.
Credco entered into securities lending agreements in June 2006 with other financial institutions to
enhance investment income. At December 31, 2006, the liquidity investment portfolio included
approximately $716 million of investment securities loaned under these agreements. See Note 2 to the
Consolidated Financial Statements for further discussion regarding Credco’s securities lending
program.
Other Investment Activities
At December 31, 2004, CRC invested $142 million and $56 million in Class B and C Notes,
respectively, issued by American Express Credit Account Master Trust, a qualified special purpose
entity. During 2005, $37 million of the Class C Notes and $142 million of Class B Notes matured. At
December 31, 2005, CRC had approximately $19 million of Class C Notes remaining. During 2006,
the remaining $19 million of the Class C Notes matured.
Committed Bank Credit Facilities
Credco maintained committed bank credit facilities with 38 large institutions totaling $10.8 billion
(including $1.2 billion available to American Express and the $3.3 billion Australian credit facility) at
December 31, 2006. Credco had $2.7 billion outstanding under these facilities, related to the
5
6. Australian credit facility. These facilities expire as follows (billions): 2009, $3.3; 2010, $4.8; and
2011, $2.7.
The availability of the credit lines is subject to compliance with certain financial covenants by
Credco, including the maintenance of a 1.25 ratio of earnings to fixed charges. The ratio of earnings
to fixed charges for Credco was 1.44, 1.41 and 1.36 in 2006, 2005 and 2004, respectively. The ratio
of earnings to fixed charges for American Express for 2006, 2005 and 2004 was 2.80, 2.83 and 3.13,
respectively.
Committed bank credit facilities do not contain material adverse change clauses, which may preclude
borrowing under the credit facilities. The facilities may not be terminated should there be a change in
Credco’s credit rating.
Results of Operations
Pretax income depends primarily on the volume of cardmember receivables and loans purchased, the
discount factor used to determine purchase price, the relationship of total discount to Credco’s
interest expense and the collectibility of cardmember receivables and loans purchased.
Credco’s consolidated net income rose 50 percent to $622 million for the year ended December 31,
2006, as compared to the year ended December 31, 2005. The year-over-year increase was primarily
due to the increase of discount revenue earned on purchased cardmember receivables and loans and
the interest income from affiliates, offset by the increase of interest expense to affiliates and others.
Discount Revenue Earned on Purchased Cardmember Receivables and Loans
Discount revenue increased 32 percent or $543 million to $2.2 billion for the year ended December
31, 2006, as compared to the same period in 2005. The year-over-year increase was primarily due to
an increase in both volume of receivables purchased and discount rates. Volume of receivables
purchased for the year ended December 31, 2006, was 8 percent higher than the same period a year
ago primarily due to an increase in cardmember spending. Discount rates, which vary over time due
to changes in market interest rates or changes in the collectibility of cardmember receivables,
increased an average of approximately 14 basis points compared to the year ended December 31,
2005.
Interest Income from Investments
Interest income from investments increased 74 percent or $93 million to $218 million for the year
ended December 31, 2006, as compared to the same period in the prior year. The year-over-year
increase was due to a higher interest rate environment as well as the replacement of matured U.S.
Treasury securities primarily with higher yielding government agency securities. The average rate on
the total investment portfolio increased 186 basis points for the year ended December 31, 2006,
compared to the year ended December 31, 2005.
Interest Income from Affiliates
Interest income from affiliates increased 32 percent or $127 million to $523 million for the year
ended December 31, 2006, as compared to the year ended December 31, 2005. The year-over-year
increase was primarily due to an increase in the volume of loans with affiliates. The average rate
charged to affiliates during the year ended December 31, 2006, was 49 basis points higher than the
average rate charged to affiliates in the same period a year ago, primarily due to the floating rate
interest-bearing borrowings with affiliates.
6
7. Provision for Losses, Net of Recoveries
The provision for losses, net of recoveries decreased 11 percent or $73 million for the year ended
December 31, 2006, as compared to the year ended December 31, 2005. The year-over-year decrease
reflects a lower loss rate and improved results from collection activities.
Interest Expense and Interest Expense to Affiliates
Interest expense and interest expense to affiliates increased 36 percent and 68 percent, respectively,
for the year ended December 31, 2006, as compared to the same period a year ago. The increase is
primarily due to higher effective cost of funds and higher debt funding levels. The average rate due to
affiliates during the year ended December 31, 2006, was 140 basis points higher than the same period
a year ago, primarily due to the fact that a high proportion of the interest-bearing borrowings due to
affiliates were at floating rate.
The following table summarizes the changes attributable to the increase (decrease) in key revenue and
expense accounts:
(Millions) 2006 2005
Discount revenue earned on purchased cardmember
receivables and loans:
Volume of receivables purchased $ 139 $ 148
Discount rates 404 266
Total $ 543 $ 414
Finance charge revenue:
Volume of loans purchased $ (17) $ (292)
Interest rates (5) 22
Total $ (22) $ (270)
Interest income from investments:
Average investments outstanding $ (1) $ (11)
Interest rates 94 32
Total $ 93 $ 21
Interest income from affiliates:
Average loans with affiliates $ 83 $ 164
Interest rates 44 113
Total $ 127 $ 277
Provision for losses, net of recoveries:
Volume of receivables purchased $ 67 $ 66
Provision rates and volume of recoveries (140) (32)
Total $ (73) $ 34
Interest expense:
Average debt outstanding $ 94 $ 58
Interest rates 244 127
Total $ 338 $ 185
Interest expense to affiliates:
Average debt outstanding $ 28 $ 12
Interest rates 107 81
Total $ 135 $ 93
Income Taxes
Credco’s effective tax rate for the years ended December 31, 2006, 2005 and 2004, was 13.2 percent,
10.8 percent and 24.3 percent, respectively. The effective tax rate was higher in 2006 compared to
7
8. 2005 primarily as a result of a decrease in the proportion of foreign subsidiary pretax income to total
pretax income. The effective tax rate was lower in 2005 as compared to 2004 primarily as a result of
ongoing benefits related to changes in international funding strategy during 2004. The shifts in
international funding strategy, which diversify funding sources and increase liquidity, are expected
also to benefit Credco’s effective tax rate and net income in future periods despite somewhat higher
related funding costs.
QUANTITATIVE AND QUALITATIVE DISCLOSURES ABOUT MARKET RISK.
Credco’s risk management objective is to monitor and control risk exposures to earn returns
commensurate with the appropriate level of risk assumed. In addition to business risk, Credco
recognizes three fundamental sources of risk: credit risk, market risk and operational risk. These
risks, which are described below, are interrelated, and management has adopted well defined risk-
taking principles to guide Credco’s business strategies and objectives. Credco views credit risk as a
component of driving profitable growth. Market risk is hedged or managed within established
parameters to sustain such earnings growth, while operational risk arising from Credco’s business
activities is carefully monitored to maintain it within acceptable limits.
Credco’s risk management oversight is performed through internal and independent oversight
functions. Risk management governance at Credco begins with the American Express Board
approved risk management policies, objectives and the American Express Board oversight of risk
management parameters. Supporting the American Express Board in its oversight function are other
risk management oversight committees, such as American Express’ Treasury Department and other
asset and liability management committees. The American Express Enterprise Risk Management
Committee (ERMC) supplements the risk management capabilities resident within American
Express’ business segments by routinely reviewing key market, credit, operational and other risk
concentrations across American Express and recommending action where appropriate. The ERMC
recommends risk limits, promotes a rigorous understanding of risks across American Express,
including Credco, and supports management in making risk-return decisions.
Credit Risk
Credit risk is defined as the risk of loss from obligor or counterparty default. Credco is exposed to
credit risk through the cardmember receivables and cardmember loans it purchases generally without
recourse, as well as through its participation interests. Since such a portfolio consists of millions of
borrowers and individual exposures, its risk is substantially reduced through diversification. A loss
distribution is characterized by a higher frequency but manageable severity that is more closely linked
to general economic and legal conditions than by borrower-specific events. Receivable and loan
purchase decisions and the related discount pricing are impacted by the overall credit risk
considerations inherent in the cardmember receivables and cardmember loans.
Credit risk associated with Credco’s derivatives is limited to the risk that a derivative counterparty
will not perform in accordance with the terms of the contract. To mitigate such risk, Credco’s
counterparties are all required to be rated as investment grade. Additionally, Credco enters into
master netting agreements with its counterparties wherever practical.
Market Risk Management Process
Market risk is the risk to earnings or value resulting from movements in market prices. Credco’s
market risk consists primarily of interest rate risk and foreign exchange risk. Market risk exposures
are monitored and managed by various risk committees, American Express’ Treasury Department as
well as by management. The American Express Board approved policies related to market risk
management and the use of derivative financial instruments have been established. With respect to
derivative financial instruments, the value of such instruments is derived from an underlying variable
8
9. or multiple variables, including commodity, equity, foreign exchange and interest rate indices or
prices. These instruments enable end users to increase, reduce, or alter exposure to various market
risks and, for that reason, are an integral component of Credco’s market risk and related asset liability
management strategy and processes. See Note 7 for additional discussion of Credco’s derivative
financial instruments.
Interest rate risk is generated by the funding of cardmember receivables and fixed rate cardmember
loan purchases through longer term variable rate borrowings. Such assets and liabilities generally do
not create naturally offsetting positions with respect to basis, re-pricing or maturity characteristics. By
using derivative financial instruments, such as interest rate swaps, the interest rate profile can be
adjusted to maintain and manage a desired profile. As of December 31, 2006 and 2005, the total
notional amount of interest rate swaps was $6 billion and $2 billion, respectively. These derivatives
generally qualify for hedge accounting. A portion of these derivatives outstanding as of December 31,
2006 extend to 2015.
In addition, foreign exchange risk is generated by cross-currency purchased cardmember receivables
and cardmember loans, foreign currency denominated balance sheet exposures and foreign currency
earnings in international units. Credco hedges this market exposure to the extent it is economically
justified through various means including local market cross-currency funding and the use of
derivative financial instruments, such as foreign exchange forward and cross-currency swap contracts,
which can help “lock in” Credco’s exposure to specific currencies. As of December 31, 2006 and
2005, the total notional amount of foreign exchange derivatives was $125 million and $27 million,
respectively. These derivatives generally do not qualify for hedge accounting.
The following discussion includes sensitivity analysis of interest rate and foreign currency risk and
estimates the effects of hypothetical sudden and sustained changes in the applicable market conditions
on the ensuing year’s earnings, based on year-end positions. The market changes, assumed to occur as
of year-end, are a 100 basis point increase in market interest rates and a 10 percent strengthening of
the U.S. dollar versus all other currencies. Computations of the prospective effects of hypothetical
interest rate and foreign exchange rate changes are based on numerous assumptions, including
relative levels of market interest rates and foreign exchange rates, as well as the levels of assets and
liabilities. The hypothetical changes and assumptions will be different from what actually occurs in
the future. Furthermore, the computations do not incorporate actions that management could take if
the hypothetical market changes actually occur, including revising the discount rate applicable to
purchases of new receivables. As a result, actual earnings consequences will differ from those
quantified. The detrimental effect on Credco’s pretax earnings of a hypothetical 100 basis point
increase in interest rates would be approximately $151 million based on the 2006 year-end positions.
This effect, which is calculated using a static asset/liability gapping model, is primarily a function of
the extent of variable rate funding of charge card and fixed rate lending products, to the degree that
interest rate exposure is not managed by derivative financial instruments. From a foreign exchange
risk perspective, based on the year-end 2006 and 2005 foreign exchange positions, the effect on
Credco’s earnings of the hypothetical 10 percent strengthening of the U.S. dollar would be
immaterial.
Operational Risk Management Process
Credco defines operational risk as the risk of not achieving business objectives due to inadequate or
failed processes, or information systems, human error or the external environment (e.g., natural
disasters) including losses due to failures to comply with laws and regulations. Operational risk is
inherent in all business activities and can impact an organization through direct or indirect financial
loss, brand damage, customer dissatisfaction, or legal or regulatory penalties. Credco is committed to
improving its ability to prioritize and manage operational risk through the delivery of a
comprehensive operational risk program. American Express has developed a comprehensive program
9
10. to identify, measure, monitor, and report inherent and emerging operational risks. However, day-to-
day management of operational risk lies with Credco. Credco continues to enhance its operational risk
management practices on an ongoing basis. The implementation of this operational risk program is
expected to result in improved operational risk intelligence and a heightened level of preparedness to
deal with operational risk events and conditions that may adversely impact Credco’s operations.
10
11. AMERICAN EXPRESS CREDIT CORPORATION
CONSOLIDATED STATEMENTS OF INCOME
Years Ended December 31, (Millions) 2006 2005 2004
Revenues
Discount revenue earned from purchased
cardmember receivables and loans $ 2,223 $ 1,680 $ 1,266
Interest income from affiliates 523 396 119
Interest income from investments 218 125 104
Finance charge revenue 47 69 339
Other 6 6 4
Total revenues 3,017 2,276 1,832
Expenses
Provision for losses, net of recoveries:
2006, $158; 2005, $172; 2004, $187 589 662 628
Interest expense 1,281 943 758
Interest expense to affiliates 333 198 105
Service fees to affiliates 93 2 25
Other 4 6 7
Total expenses 2,300 1,811 1,523
Pretax income 717 465 309
Income tax provision 95 50 75
Net income $ 622 $ 415 $ 234
See Notes to Consolidated Financial Statements.
11
12. AMERICAN EXPRESS CREDIT CORPORATION
CONSOLIDATED BALANCE SHEETS
December 31, (Millions, except share data) 2006 2005
Assets
Cash and cash equivalents $ 737 $ 1,051
Investment securities 2,299 2,996
Investment securities restricted 716 -
Cardmember receivables, less reserves:
2006, $739; 2005, $671 26,854 23,750
Cardmember loans, less reserves:
2006, $10; 2005, $15 346 554
Loans with affiliates 9,691 8,254
Deferred charges and other assets 316 764
Due from affiliates 7 -
Total assets $ 40,966 $ 37,369
Liabilities and Shareholder’s Equity
Short-term debt $ 5,883 $ 7,939
Short-term debt with affiliates 9,586 8,043
Long-term debt 21,790 16,929
Total debt 37,259 32,911
Due to affiliates - 1,021
Accrued interest and other liabilities 285 166
Total liabilities 37,544 34,098
Shareholder’s Equity
Common stock, $.10 par value, authorized 3 million shares;
issued and outstanding 1.5 million shares 1 1
Capital surplus 161 161
Retained earnings 3,202 3,080
Accumulated other comprehensive income (loss):
Net unrealized securities gains (losses), net of tax:
2006, $(3); 2005, $8 5 (16)
Net unrealized derivatives gains, net of tax:
2006, $(5); 2005, $(31) 10 57
Foreign currency translation adjustments 45 (12)
Other (2) -
Total accumulated other comprehensive income 58 29
Total shareholder’s equity 3,422 3,271
Total liabilities and shareholder’s equity $ 40,966 $ 37,369
See Notes to Consolidated Financial Statements.
12
13. AMERICAN EXPRESS CREDIT CORPORATION
CONSOLIDATED STATEMENTS OF CASH FLOWS
Years Ended December 31, (Millions) 2006 2005 2004
Cash Flows from Operating Activities
Net income $ 622 $ 415 $ 234
Adjustments to reconcile net income to net cash
provided by operating activities:
Provision for losses 747 834 815
Amortization and other 9 14 13
Deferred taxes (6) (3) 30
Changes in operating assets and liabilities:
Due to affiliates 39 57 11
Other operating assets and liabilities 258 (286) (299)
Net cash provided by operating activities 1,669 1,031 804
Cash Flows from Investing Activities
Net (increase) decrease in cardmember receivables and loans (3,643) (3,410) 2,780
Purchase of investments (3,012) (792) (2,237)
Maturity of investments 3,019 979 333
Sale of investments - - 1,244
Net increase in loans with affiliates (570) (1,524) (4,760)
Net (decrease) increase in due to affiliates (1,067) (185) 718
Net cash used in investing activities (5,273) (4,932) (1,922)
Cash Flows from Financing Activities
Net increase in short-term debt with affiliates with maturities
of ninety days or less 1,542 2,579 309
Net decrease in short-term debt with maturities
of ninety days or less (2,710) (12) (1,490)
Issuance of debt 12,208 6,636 9,538
Redemption of debt (7,250) (7,853) (4,840)
Dividends paid (500) (200) (125)
Net cash provided by financing activities 3,290 1,150 3,392
Net (decrease) increase in cash and cash equivalents (314) (2,751) 2,274
Cash and cash equivalents at beginning of year 1,051 3,802 1,528
Cash and cash equivalents at end of year $ 737 $ 1,051 $ 3,802
See Notes to Consolidated Financial Statements.
13
14. AMERICAN EXPRESS CREDIT CORPORATION
CONSOLIDATED STATEMENTS OF SHAREHOLDER’S EQUITY
Accumulated
Other
Common Capital Comprehensive Retained
Three Years Ended December 31, (Millions) Total Stock Surplus (Loss) / Income Earnings
Balances at December 31, 2003 $ 2,750 $ 1 $ 161 $ (168) $ 2,756
Comprehensive income:
Net income 234 234
Change in net unrealized securities (losses) gains (36) (36)
Change in net unrealized derivatives losses 26 26
Derivatives losses reclassified to earnings 142 142
Foreign currency translation adjustments 2 2
Total comprehensive income 368
Cash dividends paid (125) (125)
Balances at December 31, 2004 2,993 1 161 (34) 2,865
Comprehensive income:
Net income 415 415
Change in net unrealized securities losses 9 9
Change in net unrealized derivatives gains (losses) 60 60
Derivatives losses reclassified to earnings 8 8
Foreign currency translation adjustments (14) (14)
Total comprehensive income 478
Cash dividends paid (200) (200)
Balances at December 31, 2005 3,271 1 161 29 3,080
Comprehensive income:
Net income 622 622
Change in net unrealized securities gains (losses) 21 21
Change in net unrealized derivatives gains 22 22
Derivatives gains reclassified to earnings (69) (69)
Foreign currency translation adjustments 57 57
Total comprehensive income 653
Other (2) (2)
Cash dividends paid (500) (500)
Balances at December 31, 2006 $ 3,422 $1 $ 161 $ 58 $ 3,202
See Notes to Consolidated Financial Statements.
14
15. AMERICAN EXPRESS CREDIT CORPORATION
NOTES TO CONSOLIDATED FINANCIAL STATEMENTS
Note 1 Summary of Significant Accounting Policies
Basis of Presentation
American Express Credit Corporation, together with its subsidiaries (Credco), is a wholly-owned
subsidiary of American Express Travel Related Services Company, Inc. (TRS), which is a wholly-
owned subsidiary of American Express Company (American Express). American Express Overseas
Credit Corporation Limited, together with its subsidiaries (AEOCC), Credco Receivables Corporation
(CRC), Credco Finance, Inc., together with its subsidiaries (CFI), American Express Canada Credit
Corporation (AECCC) and American Express Canada Finance Limited (AECFL), American Express
Capital Australia (AECA), American Express Sterling Funding Limited Partnership, together with its
subsidiary (AESLP) and American Express Euro Funding Limited Partnership (AEELP) are wholly-
owned subsidiaries of Credco.
Principles of Consolidation
The Consolidated Financial Statements of Credco are prepared in conformity with U.S. generally
accepted accounting principles (GAAP). All significant intercompany transactions are eliminated.
Credco consolidates all non-variable interest entities in which Credco holds a greater than 50 percent
voting interest. Entities in which Credco’s voting interest exceeds 20 percent but is less than 50
percent are accounted for under the equity method. All other investments are accounted for under the
cost method unless Credco determines that it exercises significant influence over an entity by means
other than voting rights, in which case the entity is accounted for under the equity method.
Credco also consolidates all Variable Interest Entities (VIEs) for which it is considered to be the
primary beneficiary pursuant to Financial Accounting Standards Board (FASB) Interpretation No. 46
(revised December 2003), “Consolidation of Variable Interest Entities” (FIN 46(R)). The
determination of whether an entity is a VIE is based on the amount and characteristics of the entity’s
equity. In general, FIN 46(R) requires an enterprise to consolidate a VIE when it has a variable
interest and it is deemed to be the primary beneficiary (meaning that it will absorb a majority of the
VIE’s expected losses or receive a majority of the VIE’s expected residual return).
Certain reclassifications of prior period amounts have been made to conform to the current
presentation of the Consolidated Financial Statements.
Foreign Currency
Assets and liabilities denominated in foreign currencies are translated into U.S. dollars based upon
exchange rates prevailing at the end of each year. The resulting translation adjustments, along with
any related qualifying hedge and tax effects, are included in accumulated other comprehensive
income (loss), a component of shareholder’s equity. Revenues and expenses are translated at the
average month-end exchange rates during the year. Gains and losses related to non-functional
currency transactions, including non-U.S. operations where the functional currency is the U.S. dollar,
are reported net in other revenue or other expense, depending on the nature of the activity, in
Credco’s Consolidated Statements of Income. Net foreign currency transaction gains (losses) were
immaterial for the years ended 2006, 2005 and 2004.
15
16. Amounts Based on Estimates and Assumptions
Accounting estimates are an integral part of the Consolidated Financial Statements. These estimates
are based, in part, on management’s assumptions concerning future events. Among the more
significant assumptions are those that relate to reserves for cardmember losses and investment
securities valuation. These accounting estimates reflect the best judgment of management, but actual
results could differ.
Discount Revenue
Credco earns discount revenue from purchasing cardmember receivables and loans. The discount is
deferred and recognized as revenue ratably over the period that the receivables are estimated to be
outstanding. Estimates are based on the recent historical average life of cardmember receivables.
Finance Charge Revenue
Cardmember lending finance charges are assessed using the average daily balance method for
receivables owned and are recognized based upon the principal amount outstanding in accordance
with the terms of the applicable account agreement until the outstanding balance is paid or written-
off.
Interest Income from Investments
Interest income for Credco’s performing fixed-income securities is accrued as earned using the
effective interest method, which adjusts the yield for security premiums and discounts, fees and other
payments, so that the related security recognizes a constant rate of return on the outstanding balance
throughout its term.
Cash and Cash Equivalents
Credco has defined cash equivalents to include time deposits and other highly liquid investments with
original maturities of 90 days or less.
Investment Securities
Investment securities include debt and equity securities classified as Available-for-Sale investment
securities that are carried at fair value on the Consolidated Balance Sheets with unrealized gains
(losses) recorded in accumulated other comprehensive income (loss), net of income tax provisions
(benefits). Gains and losses are recognized in the Consolidated Statements of Income in other revenue
upon disposition of the securities. Gains and losses on these investments are recognized using the
specific identification method on a trade date basis. Realized losses are also recognized when
management determines that a decline in value is other-than-temporary, which requires judgment
regarding the amount and timing of recovery. Indicators of other-than-temporary impairment for debt
securities include issuer downgrade, default or bankruptcy. Credco also considers the extent to which
cost exceeds fair value, the duration and size of that gap and management’s judgment about the
issuer’s current and prospective financial condition. Credco uses quoted market prices to determine
fair value. If quoted market prices are not available, Credco estimates fair value using prices of
similar assets or the present value of estimated expected future cash flows when similar assets do not
exist.
16
17. Reserves for Losses – Cardmember Receivables and Loans
Cardmember receivables represent amounts due from American Express charge card customers and
are recorded at the time a cardmember enters into a point-of-sale transaction at a service
establishment. Cardmember receivable balances are presented on the Consolidated Balance Sheets net
of reserves for losses and typically include principal and any related accrued fees. Cardmember loans
represent amounts due from customers of American Express’ lending products, and are recorded at
the time a cardmember point-of-sale transaction is captured. These loans are presented on the
Consolidated Balance Sheets net of reserves for cardmember losses and include accrued interest
receivable and fees as of the balance sheet date. Additionally, cardmember loans include balances
with extended payment terms on certain charge card products, such as Sign & Travel® and Extended
Payment Option. Credco’s policy is to cease accruing for interest receivable once a cardmember loan
is greater than 180 days past due. Accruals that cease generally are not resumed.
Credco’s reserves for losses relating to cardmember receivables and loans represent management’s
estimate of losses inherent in Credco’s outstanding portfolio of receivables and loans. Management’s
evaluation process requires certain estimates and judgments. Reserves for these losses are primarily
based upon models that analyze specific portfolio statistics and also reflect, to a lesser extent,
management’s judgment regarding overall reserve adequacy. The analytic models take into account
several factors, including average write-off rates for various stages of receivable aging (i.e., current,
30 days, 60 days, 90 days) over a 24-month period (loan balances are written off when 180 days past
due) and average bankruptcy and recovery rates. Management considers whether to adjust the
analytic models based on other factors, such as the level of coverage of past-due accounts, as well as
leading economic and market indicators, such as the unemployment rate, the consumer confidence
index, the purchasing manager’s index, bankruptcy filings and the legal and regulatory environment.
Receivables and loans are written-off when management deems amounts to be uncollectible, which is
generally determined by the numbers of days past due. In general, receivables in bankruptcy and
deceased accounts are written-off upon notification, or when 180 days past due for lending products
and 360 days past due for charge card products. For all other accounts, write-off policy is based upon
the delinquency and product. Given both the size and the volatility of write-offs, management
continually monitors evolving trends and adjusts its business strategy accordingly. To the extent
historical credit experience is not indicative of future performance actual loss experience could differ
significantly from management’s judgments and expectations, resulting in either higher or lower
future provisions for losses, as applicable.
Derivative Financial Instruments and Hedging Activities
All derivatives are recognized at fair value as either assets or liabilities on Credco’s Consolidated
Balance Sheets. The fair value of Credco’s derivative financial instruments are determined using
either market quotes or valuation models that are based upon the net present value of estimated future
cash flows and incorporate current market data inputs. Credco reports its derivative assets and
liabilities in other assets and other liabilities, respectively, on a net by counterparty basis where
management believes it has the legal right of offset under enforceable netting arrangements. The
accounting for the change in the fair value of a derivative financial instrument depends on its intended
use and the resulting hedge designation, if any, as discussed below.
Cash flow hedges
A cash flow hedge is a derivative designated to hedge the exposure of variable future cash flows that
is attributable to a particular risk associated with an existing recognized asset or liability or a
forecasted transaction. For derivative financial instruments that qualify as cash flow hedges, the
effective portions of the gain or loss on the derivatives are recorded in accumulated other
comprehensive income (loss) and reclassified into earnings when the hedged item or transactions
impact earnings. The amount that is reclassified into earnings is presented in the Consolidated
Statement of Income with the hedged instrument or transaction impact, generally, in interest expense.
17
18. Any ineffective portion of the gain or loss, as determined by the accounting requirements, is reported
as a component of other revenue. If a hedge is de-designated or terminated prior to maturity, the
amount previously recorded in accumulated other comprehensive income (loss) is recognized into
earnings over the period that the hedged item impacts earnings. If a hedge relationship is discontinued
because it is probable that the forecasted transaction will not occur according to the original strategy,
any related amounts previously recorded in accumulated other comprehensive income (loss) are
recognized into earnings immediately.
Fair value hedges
A fair value hedge is a derivative designated to hedge the exposure of future changes in the fair value
of an asset or liability, or an identified portion thereof that is attributable to a particular risk. For
derivative financial instruments that qualify as fair value hedges, changes in the fair value of the
derivatives, as well as of the corresponding hedged assets, liabilities or firm commitments, are
recorded in earnings as a component of other revenue. If a fair value hedge is de-designated or
terminated prior to maturity, previous adjustments to the carrying value of the hedged item are
recognized into earnings to match the earnings pattern of the hedged item.
Net investment hedges in foreign operations
A net investment hedge in foreign operations is a derivative used to hedge future changes in currency
exposure of a net investment in a foreign operation. For derivative financial instruments that qualify
as net investment hedges in foreign operations, the effective portions of the change in fair value of the
derivatives are recorded in accumulated other comprehensive income (loss) as part of the cumulative
translation adjustment. Any ineffective portions of net investment hedges are recognized in other
revenue during the period of change.
Non-designated derivatives
For derivative financial instruments that do not qualify for hedge accounting or are not designated as
hedges, changes in fair value are reported in current period earnings generally as a component of
other revenue, other operating expenses or interest expense, depending on the type of derivative
instrument and the nature of the transaction.
Derivative financial instruments that qualify for hedge accounting
Derivative financial instruments that are entered into for hedging purposes are designated as such
when Credco enters into the contract. For all derivative financial instruments that are designated for
hedging activities, Credco formally documents all of the hedging relationships between the hedge
instruments and the hedged items at the inception of the relationships. Management also formally
documents its risk management objectives and strategies for entering into the hedge transactions.
Credco formally assesses, at inception and on a quarterly basis, whether derivatives designated as
hedges are highly effective in offsetting the fair value or cash flows of hedged items. These
assessments usually are made through the application of statistical measures. Credco only applies the
“short cut” method of hedge accounting in very limited cases when this method’s requirements are
strictly met. Beginning in 2006, Credco discontinued using the “short cut” method on any new
transactions. In accordance with its risk management policies, Credco generally structures its hedges
with very similar terms to the hedged items. Therefore, when applying the accounting requirements,
Credco generally recognizes insignificant amounts of ineffectiveness through earnings. If it is
determined that a derivative is not highly effective as a hedge, Credco will discontinue the application
of hedge accounting.
Recently Issued Accounting Standards
SFAS No. 158, “Employers' Accounting for Defined Benefit Pension and Other Postretirement Plans
- an amendment of the FASB Statements No. 87, 88, 106, and 132(R)” (SFAS No. 158), requires the
funded status of pension and other postretirement plans to be recorded on the balance sheet as of
December 31, 2006 with a corresponding offset, net of tax effects, recorded in accumulated other
comprehensive income (loss) within shareholder's equity. Effective for years ending after December
18
19. 15, 2008, the measurement date for the benefit obligation and plan assets is required to align with a
company’s fiscal year end.
Credco participates in a multi-employer plan and recognizes the cost of pension expense based on
contributions into the plan.
As Credco participates in a multi-employer plan, the adoption of the provisions included in SFAS No.
158 did not have a material impact on Credco’s Consolidated Financial Statements.
SFAS No. 156, “Accounting for Servicing of Financial Assets – an amendment of FASB Statement
No. 140” (SFAS No. 156), requires all separately recognized servicing assets and servicing liabilities
to be initially measured at fair value, if practicable. Subsequent accounting may be elected under
either the amortization method, which systematically amortizes the servicing asset or liability to
income, or the fair value measurement method, which remeasures the servicing asset or liability at
fair value with the changes recorded in income. Election of the fair value method is made on a class-
by-class basis for each separately recognized servicing asset and liability. SFAS No. 156 applies to all
financial instruments acquired or issued after December 31, 2006. Credco does not expect any impact
to its Consolidated Financial Statements.
SFAS No. 155, “Accounting for Certain Hybrid Financial Instruments – an amendment of FASB
Statement No. 133 and 140” (SFAS No. 155), ends the temporary exemption of beneficial interests in
securitized assets from the bifurcation requirements of SFAS No. 133, “Accounting for Derivative
Instruments and Hedging Activities.” SFAS No. 155 permits fair value remeasurement of any hybrid
financial instrument that contains an embedded derivative that otherwise would require bifurcation.
SFAS No. 155 applies to all financial instruments acquired or issued after December 31, 2006.
Credco does not expect any impact to its Consolidated Financial Statements.
The FASB has recently issued the following accounting standards, which are effective after
December 31, 2006. Credco is currently evaluating the impact of these recently issued accounting
standards on Credco’s Consolidated Financial Statements:
• FASB Interpretation No. 48, “Accounting for Uncertainty in Income Taxes – an
interpretation of FASB Statement No. 109” (FIN 48), is an interpretation that clarifies the
accounting for tax positions accounted for under FASB Statement No. 109, “Accounting for
Income Taxes. ” FIN 48 prescribes a recognition threshold and measurement attribute for the
financial statement recognition and measurement of benefits associated with tax positions
taken or expected to be taken in a tax return. For any amount of those benefits to be
recognized, a tax position must be more-likely-than-not to be sustained upon examination by
taxing authorities based on the technical merits of the position. The amount of benefit
recognized is based on the Company’s assertion of the most likely outcome resulting from an
examination. FIN 48 is applicable to all tax positions as of January 1, 2007. The initial effect
of adoption will be reflected in first quarter 2007 as a cumulative effect adjustment to income
taxes payable (in other liabilities) and retained earnings. Credco expects that the cumulative
effect of the adoption of FIN 48 will result in an immaterial reduction to total shareholder’s
equity. Subsequent to the adoption of FIN 48, all increases and decreases in Credco’s
estimated recognizable tax benefits will be recorded as a benefit/provision for income taxes.
• SFAS No. 157, “Fair Value Measurements” (SFAS No. 157), establishes a framework for
measuring fair value and applies broadly to financial and non-financial assets and liabilities
measured at fair value under existing authoritative accounting pronouncements. SFAS No.
157 establishes a fair value hierarchy that prioritizes inputs to valuation techniques used for
financial instruments without active markets, and for non-financial assets and liabilities.
SFAS No. 157 also expands disclosure requirements regarding methods used to measure fair
value and the effects on earnings. SFAS No. 157 is effective as of the first quarter of 2008.
19
20. • SFAS No. 159, “The Fair Value Option for Financial Assets and Financial Liabilities –
Including an amendment of FASB Statements No. 115” (SFAS No. 159), provides companies
with an option to report selected financial assets and liabilities at fair value. SFAS No. 159 is
effective as of the first quarter of 2008.
Note 2 Investment Securities
The following is a summary of investment securities classified as Available-for-Sale at December 31:
2006 2005
Gross Gross Gross Gross
Unrealized Unrealized Fair Unrealized Unrealized Fair
(Millions) Cost Gains Losses Value Cost Gains Losses Value
American Express Credit
Account Master Trust Class C
$ - $ - $ -$ - $ 19 $ - $ -$ 19
Notes
U.S. Treasury and government
2,294 7 (2) 2,299 3,001 - (24) 2,977
agency securities
U.S. Treasury and government
714 2 - 716 - - - -
agency securities – restricted (a)
$ 3,008 $ 9 $ (2) $ 3,015 $ 3,020 $ - $ (24) $ 2,996
Total
(a)
U.S. Treasury and government agency securities - restricted at December 31, 2006, represented $716 million of securities loaned out
on an overnight basis to financial institutions under the securities lending program described on page F-15. At December 31, 2005,
there were no securities loaned out.
The following tables provide information about Available-for-Sale investment securities with gross
unrealized losses and the length of time that individual securities have been in a continuous
unrealized loss position as of December 31, 2006 and 2005:
As of December 31, 2006 (Millions) Less than 12 months 12 months or more Total
Gross Gross Gross
Fair Unrealized Fair Unrealized Fair Unrealized
Description of Securities Value Losses Value Losses Value Losses
U.S. Treasury and government agency
securities $ 1,006 $ (2) $ - $ - $ 1,006 $ (2)
Total $ 1,006 $ (2) $ - $ - $ 1,006 $ (2)
During 2006 U.S. Treasury and government agency securities - restricted were in an insignificant
continuous unrealized loss position of less than twelve months.
As of December 31, 2005 (Millions) Less than 12 months 12 months or more Total
Gross Gross Gross
Fair Unrealized Fair Unrealized Fair Unrealized
Description of Securities Value Losses Value Losses Value Losses
U.S. Treasury and government agency
securities $ 397 $ - $ 2,183 $ (24) $ 2,580 $ (24)
Total $ 397 $ - $ 2,183 $ (24) $ 2,580 $ (24)
Credco reviews and evaluates investment securities on a quarterly basis to identify investment
securities that have indications of possible other-than-temporary impairments. Accordingly, Credco
20
21. considers the extent to which amortized cost exceeds fair value and the duration and size of that
difference. A key metric in performing this evaluation is the ratio of fair value to amortized cost.
The following table summarizes the unrealized losses of temporary impairments by ratio of fair value
to amortized cost as of December 31, 2006:
(Millions, except
number of securities) Less than 12 months 12 months or more Total
Gross Gross Gross
Ratio of Fair Value to Number of Fair Unrealized Number of Fair Unrealized Number of Fair Unrealized
Amortized Cost Securities Value Losses Securities Value Losses Securities Value Losses
95%–100% 3 $ 1,006 $ (2) - $ - $ - 3 $ 1,006 $ (2)
Total 3 $ 1,006 $ (2) - $ - $ - 3 $ 1,006 $ (2)
Credco has the ability and the intent to hold these securities for a time sufficient to recover the
unrealized losses and expects that contractual principal and interest will be received on these
securities.
The change in net unrealized securities gains (losses) in other comprehensive income (loss) includes
two components: (i) holding gains (losses), which are unrealized gains (losses) that arose from
changes in market value of securities that were held during the period; and (ii) reclassification for
realized (gains) losses, which are gains (losses) that were previously unrealized, but have been
recognized in current period net income due to sales of Available-for-Sale securities.
The following table presents the components of the change in other comprehensive income (loss) for
the years ended December 31:
(Millions, net of tax) 2006 2005 2004
Unrealized gains (losses) $ 5 $ (16) $ (25)
Reclassification for realized losses (gains) 16 25 (11)
Net unrealized securities gains (losses) in
other comprehensive income (loss) $ 21 $ 9 $ (36)
The following is a distribution of Available-for-Sale investment securities by maturity as of
December 31, 2006:
Cost Fair Value
(Millions)
Due after 1 year through 5 years $ 3,008 $ 3,015
Total $ 3,008 $ 3,015
The table below includes purchases, sales and maturities of investments classified as Available-for-
Sale for the years ended December 31:
2006 2005
(Millions)
Purchases $ 792
$ 3,012
Sales $ - $ -
Maturities $ 979
$ 3,019
During 2006, $19 million of Class C Notes and $3.0 billion of U.S. Treasury securities matured,
respectively.
21
22. In conjunction with its liquidity investment portfolio, Credco entered into securities lending
agreements in June 2006 with other financial institutions. Under these agreements, certain investment
securities are loaned on an overnight basis to financial institutions and are secured by collateral equal
to at least 102 percent of the fair market value of the investment securities lent. Collateral received by
Credco can be in the form of cash or marketable U.S. Treasury or government agency securities.
Credco may only retain or sell these securities in the event of a borrower default. Credco’s loaned
investment securities are considered restricted and pledged assets and, therefore, have been
reclassified as investment securities restricted on the Consolidated Balance Sheet. The marketable
securities received as collateral are not recorded in its Consolidated Balance Sheet, as Credco is not
permitted to sell or repledge these securities absent a borrower default. Fees received from the
securities lending transactions are recorded as interest income from investments. At December 31,
2006, approximately $716 million of investment securities were loaned under these agreements.
Note 3 Cardmember Receivables and Loans
At December 31, 2006 and 2005, Credco owned $27.6 billion and $24.4 billion, respectively, of
cardmember receivables and participation interests in cardmember receivables. For the years ended
December 31, 2006 and 2005, Credco purchased $279.9 billion and $258.7 billion, respectively, of
cardmember receivables.
Participation interests in cardmember receivables represent undivided interests in the cash flows of
the non-interest-bearing cardmember receivables and are purchased without recourse by CRC from
American Express Receivables Financing Corporation V LLC (RFC V). During May 2005, TRS
established the American Express Issuance Trust (AEIT), which is used to securitize cardmember
receivables originated by TRS and its subsidiaries. AEIT is a non-qualifying special purpose entity
that is consolidated by RFC V. RFC V, in turn, is consolidated by TRS. Beginning in May 2005,
CRC purchased participation interests held by AEIT from RFC V. Prior to May 2005, CRC
purchased participation interests without recourse from American Express Receivables Financing
Corporation (RFC). These participation interests represented undivided interests in cardmember
receivables transferred to American Express Master Trust (AEMT) by TRS, which together with its
subsidiaries originated the receivables. AEMT was a non-qualifying special purpose entity that was
consolidated by TRS. AEMT was dissolved during the third quarter of 2005. At December 31, 2006
and 2005, CRC owned approximately $8.2 billion and $8.6 billion, respectively, of participation
interests purchased from RFC V.
At December 31, 2006 and 2005, Credco owned cardmember loans totaling $0.3 billion and $0.6
billion, respectively, including certain interest-bearing and discounted extended payment plan
receivables comprised principally of American Express credit card, Sign & Travel® and Extended
Payment Option receivables and lines of credit and loans to American Express Bank Ltd. customers.
For the years ended December 31, 2006 and 2005, Credco purchased $1.1 billion and $1.2 billion,
respectively, of cardmember loans. At December 31, 2006, CRC did not own any participation
interests in cardmember loans.
22
23. The following table presents the changes in the reserve for losses related to cardmember receivables
and loans:
Years Ended December 31, (Millions) 2006 2005 2004
Reserve for losses:
Balance at beginning of year $ 686 $ 610 $ 737
Additions:
Provision for losses charged to income (1) 747 834 815
Other credits (2) 11 552 53
Deductions:
Accounts written-off 690 772 841
Other charges (3) 5 538 154
Balance at end of year $ 749 $ 686 $ 610
Reserve for losses as a percentage of gross
cardmember receivables and loans owned at
year-end 2.66% 2.73% 2.70%
(1)
Does not include recoveries on accounts previously written-off of $158 million, $172 million and $187 million in
2006, 2005 and 2004, respectively.
(2)
Reserve balances applicable to new groups of cardmember receivables and loans purchased from TRS and certain of
its subsidiaries and participation interests purchased from affiliates.
(3)
Primarily relates to reserve balances applicable to certain groups of cardmember receivables and loans and
participation interests sold to affiliates.
At December 31, 2006 and 2005, Credco had loans to affiliates outstanding of $9.7 billion and $8.3
billion. Such amounts represent intercompany borrowings by other wholly-owned TRS subsidiaries
and American Express. Of the $9.7 billion outstanding as of December 31, 2006, $6.9 billion is
collateralized by third party assets owned by American Express or TRS and its subsidiaries. Loss
reserves related to these amounts are established on a specific identification basis. See Note 9 for
further discussion regarding loans to affiliates.
Note 4 Short-Term Debt
Credco’s short-term debt outstanding, defined as debt with original maturities of less than one year, at
December 31, was as follows:
(Millions) 2006 2005
Year-End Year-End
Year-End Effective Year-End Effective
Notional Stated Interest Notional Stated Interest
Outstanding Amount Rate on Rate with Maturity Outstandin Amount Rate on Rate with Maturity
Debt (a) Swaps (a) Debt (a) Swaps (a)
Balance of Swaps of Swaps g Balance of Swaps of Swaps
Commercial paper $ 5,782 $ - 5.23% - $ 7,742 $ - 4.19% - -
-
Other notes payable 101 - 5.18% - 197 - 4.40% - -
-
$ 5,883 5.23% $ 7,939 $ - 4.20%
Total $-
(a)
For floating rate debt issuances, the stated and effective interest rates were based on the respective rates at December 31, 2006 and 2005.
These rates are not an indication of future interest rates.
As of December 31, 2006, there were no derivative financial instruments outstanding designated as
hedges of the outstanding commercial paper. Credco has designated the interest rate risk associated
with cash flows of future commercial paper issuances as part of its ongoing hedging program. The
notional amount as of December 31, 2006, of such designated derivative financial instruments was
$1.0 billion, reflecting the hedge of future cash flows of anticipated issuances in 2007 through 2008.
See Note 7 for additional discussion of Credco’s cash flow hedging strategies.
23
24. At December 31, 2006 and 2005, short-term debt with affiliates was $9.6 billion and $8.0 billion,
respectively.
Credco has various facilities available to obtain short-term funding, including the issuance of
commercial paper and agreements with banks. At December 31, 2006, there were no short-term
borrowings under uncommitted lines of credit. At December 31, 2005, Credco, through AEOCC,
had short-term borrowings under uncommitted lines of credit totaling $41 million. Unused lines of
credit available to support commercial paper borrowings were approximately $8.1 billion and $9.3
billion at December 31, 2006 and 2005, respectively. Credco pays fees to the financial institutions
that provide these credit line facilities.
Credco paid $615 million, $494 million and $480 million of interest on short-term debt obligations in
2006, 2005 and 2004, respectively.
Note 5 Long-Term Debt
Credco’s long-term debt outstanding, defined as debt with original maturities of one year or greater,
at December 31 was as follows:
(Millions) 2006 2005
Year-End Year-End
Notional Year-End Effective Year-End Effective
Amount Stated Interest Notional Stated Interest
Outstanding of Rate on Rate with Maturity Outstanding Amount Rate on Rate with Maturity
Debt (a) Swaps (a) Debt (a) Swaps (a)
Balance Swaps of Swaps Balance of Swaps of Swaps
Fixed and Floating Rate
Senior and Medium-Term $ 19,037 $ 4,161 5.10% 5.10% 2008 - $ 13,600 $ 6,350 4.48% 2.99% 2006-
Notes due 2007-2017 (b) 2015 2015
Borrowings under Bank 2007- 2006-
Credit Facilities due 2009 2,753 916 6.69% 6.49% 2010 3,329 2,023 5.25% 5.52% 2010
$ 21,790 $ 5,077 5.30% $ 16,929 $ 8,373 4.64%
Total
(a)
For floating rate debt issuances, the stated and effective interest rates were based on the respective rates at December 31, 2006 and 2005.
These rates are not indicative of future interest rates.
(b)
These balances include $2 billion and $1 billion notes which are subject to extension by the holders through March 5, 2008 and June 20,
2011, respectively.
The above table includes the current portion of long-term debt of $3.4 billion and $2.3 billion at
December 31, 2006 and 2005, respectively. Aggregate annual maturities of long-term debt are as
follows (billions): 2007, $3.4; 2008, $7.3; 2009, $7.2; 2010, $2.0; 2011, $1.5 and thereafter, $0.4.
As of December 31, 2006, in addition to the hedges of existing long-term debt, Credco has designated
the interest rate risk associated with cash flows related to future long-term debt issuances as part of its
hedging program. The notional amount of such designated derivative financial instruments was $40
million, reflecting the hedge of future cash flows of anticipated issuances in 2008 through 2010. See
Note 7 for additional discussion of Credco’s cash flow hedging strategies.
Credco paid interest on long-term debt obligations of $930 million, $603 million and $319 million in
2006, 2005 and 2004, respectively.
Other financial institutions have committed to extend lines of credit to Credco of $10.8 billion and
$12.6 billion at December 31, 2006 and 2005, respectively. Of these amounts, $8.1 billion and $9.3
billion remained available for use as of December 31, 2006 and 2005, respectively.
Note 6 Restrictions as to Dividends and Limitations on Indebtedness
The most restrictive limitation on dividends imposed by the debt instruments issued by Credco is the
requirement that Credco maintain a minimum consolidated net worth of $50 million. There are no
limitations on the amount of debt that can be issued by Credco.
24
25. Note 7 Derivatives and Hedging Activities
Credco uses derivative financial instruments to manage exposure to various market risks. The value
of derivative instruments is derived from an underlying variable or multiple variables, including
commodity, equity, foreign exchange and interest rate indices or prices. Credco does not engage in
any trading activities. Credit risk associated with Credco’s derivatives is limited to the risk that a
derivative counterparty will not perform in accordance with the terms of the contract. To mitigate that
risk, Credco’s counterparties are all required to be pre-approved and rated as investment grade or
higher. Additionally, Credco enters into master netting agreements with its counterparties wherever
practical.
The following table summarizes the total fair value, excluding accruals, of derivative product assets
and liabilities at December 31:
(Millions) 2006 2005
Assets Liabilities Assets Liabilities
Cash flow hedges $ 26.9 $ 11.1 $ 91.2 $ 2.2
Fair value hedges - 3.8 4.3 -
Derivatives not designated as hedges 1.5 14.0 15.1 5.3
Total fair value, excluding accruals $ 28.4 $ 28.9 $ 110.6 $ 7.5
The following table summarizes the income effects of derivatives for the years ended December 31:
(Millions) 2006 2005 2004
Cash flow hedges (a):
Ineffective net (losses) gains $ (0.7) $ 0.8 $ 0.7
Gains on forecasted transactions no longer probable to occur $ - $ - $ 16
Reclassification of realized gains (losses) from other
comprehensive income (loss), net of tax of $37, $(4), and
$(76), respectively $ 69 $ (8) $ (142)
(a)
There were no (losses) gains due to exclusion from the assessment of hedge effectiveness for 2006, 2005 and 2004.
For fair value hedges, there were no gains or losses on derivative transactions or portions thereof that
were excluded from the assessment of hedge effectiveness and no hedge ineffectiveness was
recognized for the years ended December 31, 2006, 2005 and 2004.
25
26. The following table summarizes the net change in accumulated other comprehensive income (loss) of
derivatives for the years ended December 31:
(Millions) 2006 2005 2004
Cash flow hedges:
Unrealized gains, net of tax of $12, $32 and $14, respectively $ 22 $ 60 $ 26
Reclassification for realized (gains) losses, net of tax of $(37),
$4 and $76, respectively (69) 8 142
Net change in accumulated other comprehensive income (loss) $ (47) $ 68 $ 168
Net investment hedges:
Net losses related to hedges in cumulative translation
adjustment $ (15) $ - $ -
Net change in accumulated other comprehensive income
(loss) $ (15) $ - $ -
Cash Flow Hedges
A cash flow hedge is a derivative designated to hedge the exposure of variable future cash flows that
is attributable to a particular risk associated with an existing recognized asset or liability or a
forecasted transaction. Credco uses interest rate products (primarily interest rate swaps) to manage
funding costs and interest rate risk. These swaps are used to achieve a targeted mix of fixed and
floating rate funding, as well as to protect Credco from interest rate risk by hedging existing long-
term debt, the rollover of short-term borrowings primarily commercial paper, and the anticipated
forecasted issuance of additional funding. See Notes 4 and 5 for additional discussion of the cash flow
hedging strategies related to short- and long-term debt.
As of December 31, 2006 and 2005, net unrealized derivatives gains, net of tax, reflected in
accumulated other comprehensive income were $10 million and $57 million, respectively.
At December 31, 2006, Credco expects to reclassify $10 million of net pretax gains on derivative
instruments from accumulated other comprehensive income (loss) to earnings during the next twelve
months. In the event that cash flow hedge accounting is no longer applied (i.e. Credco de-designates a
derivative as hedge, a hedge is no longer considered to be highly effective, or the forecasted
transaction being hedged is no longer probable of occurring), the reclassification from accumulated
other comprehensive income (loss) into earnings may be accelerated and all future market value
fluctuations of the derivative will be reflected in earnings.
Currently, the longest period of time over which Credco is hedging exposure to variability in future
cash flows is approximately four years, which is related to long-term debt.
Fair Value Hedges
A fair value hedge is a derivative designated to hedge the exposure of future changes in the fair value
of an asset or a liability, or an identified portion thereof that is attributable to a particular risk. Credco
is exposed to interest rate risk associated with fixed-rate debt and, from time to time, uses interest rate
swaps to convert certain fixed-rate debt to floating-rate.
Net Investment Hedges
A net investment hedge in a foreign operation is a derivative used to hedge future changes in currency
exposure of a net investment in a foreign operation. Credco designates foreign currency derivatives,
primarily forward agreements, as hedges of net investments in certain foreign operations. These
derivatives reduce exposure to changes in currency exchange rates on Credco’s investments in non-
U.S. subsidiaries.
26
27. Derivatives not Designated as Hedges
Credco has economic hedges that either do not qualify or are not designated for hedge accounting
treatment. Foreign currency transactions and non-U.S. dollar cash flow exposures are economically
hedged, where practical, through foreign currency contracts, primarily forward contracts, foreign
currency options and cross-currency swaps, and generally mature within one year. Foreign currency
contracts involve the purchase and sale of a designated currency at an agreed upon rate for settlement
on a specified date. The following table provides the total fair value, excluding accruals, of these
derivative products assets and liabilities as of December 31:
(Millions) 2006 2005
Assets Liabilities Assets Liabilities
Foreign currency transactions $ 1.5 $ 10.1 $ 5.5 $ 2.1
Interest rate swaps - 3.9 9.6 3.2
Total fair value, excluding accruals $ 1.5 $ 14.0 $ 15.1 $ 5.3
Note 8 Variable Interest Entities
During the second quarter of 2004, Credco established a variable interest entity (American Express
Canada Credit Corporation) used primarily to loan funds to affiliates, which are funded by third party
borrowings. Credco is considered the primary beneficiary of the entity and, therefore, consolidates the
entity. Total assets as of December 31, 2006 and 2005 were $2.2 billion and $1.8 billion,
respectively. Total liabilities as of December 31, 2006 and 2005 were $2.0 billion and $1.7 billion,
respectively. Credco has no significant interest in a VIE for which it is not considered the primary
beneficiary.
Note 9 Transactions with Affiliates
In 2006, 2005 and 2004, Credco purchased cardmember receivables and loans without recourse from
TRS and certain of its subsidiaries totaling approximately $281.0 billion, $259.9 billion and $240.1
billion, respectively. The agreements require TRS and other Card Issuers, at their expense, to
perform accounting, clerical and other services necessary to bill and collect all cardmember
receivables owned by Credco. Since settlements under the agreements occur monthly, an amount due
from, or payable to, such affiliates may arise at the end of each month.
At December 31, 2005, CRC held American Express Credit Account Master Trust Class C Notes with
a fair value of $19 million. During 2006, the remaining Class C Notes matured.
At December 31, 2006 and 2005, CRC owned approximately $8.2 billion and $8.6 billion,
respectively, of participation interests purchased from RFC V, representing approximately 29 percent
and 34 percent of Credco’s total cardmember receivables and loans, respectively. At December 31,
2006 and 2005, there was no participation interest in cardmember loans owned by CRC.
27