SlideShare a Scribd company logo
1 of 57
Download to read offline
Profit for the quarter, continuing
operations**
SEKm

Third quarter 2013
Compared with second quarter 2013



The result for the quarter for continuing operations was SEK 4 187m
(3 478)



Earnings per share for continuing operations amounted to SEK 3.82 (3.16)
before dilution and SEK 3.79 (3.15) after dilution



The return on equity for continuing operations was 16.2 per cent (14.1)



The cost/income ratio was 0.43 (0.46)



Net interest income amounted to SEK 5 641m (5 409)



Profit before impairments increased by 8 per cent to SEK 5 230m (4 853)



Swedbank reported net recoveries of SEK 56m (credit impairments of
SEK 88m)



The Common Equity Tier 1 ratio was 18.8 per cent according to Basel 2
(16.7 per cent on 31 December 2012). The Common Equity Tier 1 ratio
according to Basel 3 was 18.0*** per cent (15.4 per cent on 31 December
2012).

5 000
4 500
4 000
3 500
3 000
2 500
2 000
1 500
1 000
500
0
Q32012

Q42012

Q12013

Q22013

Q32013

Earnings per share after dilution*,
continuing operations**

SEK
5,0
4,5
4,0
3,5
3,0
2,5
2,0
1,5
1,0
0,5
0,0
Q32012

January-September 2013

Q42012

Q12013

Q22013

Q32013

Compared with January-September 2012



The result for the period for continuing operations amounted to
SEK 11 581m (10 872)



Earnings per share for continuing operations amounted to SEK 10.55*
(9.91) before dilution and SEK 10.48* (9.87) after dilution



The return on equity for continuing operations was 15.2 per cent (15.0)



The cost/income ratio was 0.45 (0.46)



Net interest income increased by 9 per cent to SEK 16 403m (15 015)



Swedbank reported net credit impairments of SEK 92m (net recoveries of
SEK 109m).

%
20,0
18,0
16,0
14,0
12,0
10,0
8,0
6,0
4,0
2,0
0,0

Profit before impairments increased by 5 per cent to SEK 15 122m (14 413)



Return on equity, continuing
operations**

Q32012

Q42012

Q12013

Q22013

Q32013

Common Equity Tier 1 ratio, %,
Basel 3***
%

* Without deducting the preference share dividend, earnings per share for the first quarter 2013
were SEK 1.99 for continuing operations after dilution. The calculations are specified on page 49.
** Russia and Ukraine are reported as discontinued operations.
*** According to Swedbank’s interpretation of future regulations.

Swedbank – Interim report January-September 2013

Page 1 of 57

20,0
19,0
18,0
17,0
16,0
15,0
14,0
13,0
12,0
Q32012

Q42012

Q12013

Q22013

Q32013
CEO Comment
The global economy continued to show positive, though
faint, signs during the third quarter. Optimism in the
market has begun to take root. In our home markets,
economic conditions remain stable. Going forward,
however, development and credit demand will be
affected by how well our operating environment
recovers. Major structural challenges remain in many
countries where government debts and budget deficits
are creating imbalances. In Sweden, insufficient supply
of housing has created a structural challenge that has
caused upward pressure on household debt for an
extended period of time.
Continued stable results
Swedbank is again reporting robust results. The return
on equity for continuing operations was 16.2 per cent for
the third quarter. Higher net interest income and solid
cost efficiencies contributed positively. In the Swedish
mortgage market, our new lending did well during the
quarter. Mortgage margins vis-à-vis customers were
lower, following the same pattern from the second
quarter: stable for the mortgage portfolio as a whole, but
with slightly lower margins on new lending. The result in
our Baltic operations was positively affected by the
repricing of the corporate portfolio that has begun. In the
LC&I business area, our market position has improved
for the customer groups we focus on. The result from
equity and fixed income trading was weaker, however.
The Group’s net commission income was stable with
good activity in cards and funds. Credit quality remains
good.
Better preconditions for us to serve our customers
The measures we are taking to adapt to gradually
changing customer behaviour are continuing. Several
areas deserve mention. One obvious example is how
efficiency improvements during the third quarter have
led to improved response times in our Swedish
telephone bank. The use of digital channels is not only
growing but it is also clear that customers prefer a totally
new, more active way of banking. Mobile Bank users log
in nearly twice as frequently as users of the Internet
Bank. That does not include the over 15 million times
every month that mobile phone users check an account
balance by simply shaking their phone. We are also
seeing a clear trend in the Baltic countries, where the
number of cash transactions and payments in branches
is declining significantly – for example, the number of
manual cash transactions by tellers at our branches in
Latvia has dropped by 25 per cent this year. As part of
our measures to enhance the customer experience, we
opened two pilot branches in Karlstad and Nässjö in
September. With a more modern way of working and a
new customer environment that includes video-based
customer meetings, we can be wherever our customers
want to meet us.
We are giving individual advisors more opportunity to
make decisions. Competence development and
decentralised authority allow our employees to make the
decisions necessary to satisfy each customer’s needs
directly during the meeting.

* According to Swedbank’s interpretation of future regulations.

Swedbank – Interim report January-September 2013

Page 2 of 57

Openness and transparency
In early October Swedbank won an award presented by
NASDAQ OMX for best annual report in the category
large companies. This is further recognition of our work
to openly inform and build credibility among customers,
shareholders and other stakeholders. It also spurs us on
in our continued work.
We face a significant challenge with respect to customer
satisfaction in Sweden. This year’s Swedish Quality
Index survey is discouraging reading for banks,
including ourselves. We have a big job ahead of us, and
the goal is crystal clear. We will raise customer
satisfaction through improved business acumen and
local decision-making, as well as digital and physical
meeting places that meet customer needs.
Increased capitalisation and regulation
Our Common Equity Tier 1 ratio was further
strengthened during the quarter to 18.0 per cent (Basel
3*). We are awaiting approval from the Swedish
Financial Supervisory Authority to use an advanced
model to calculate risk weights on Swedish corporate
lending, which will further improve our capital ratios. In
order to set a new internal capital target, we need a
clear ruling from the authorities on future capital
requirements for Swedish banks. Swedbank’s solid
capitalisation was underscored by Standard & Poor's,
which raised our credit rating outlook to stable during
the third quarter. In addition to our strong balance sheet,
S&P stressed our solid profitability.
We welcome the increased regulation of the financial
sector which in recent years has produced a more
sustainable international banking system. At the same
time we must state, from a Swedish perspective, that
increased capital requirements on banks will never
solve the imbalances in the housing market. We want to
help our customers to buy a home and will gladly
provide financing for new construction. But we are not
willing to take part when the same properties are
mortgaged at ever increasing levels. In our view, the
increased capital requirements on banks are not an
optimal way to provide a solution to Sweden’s problem
of too little housing, which dampens potential growth.
Outlook
We continue to plan for an environment with low interest
rates and relatively weak credit demand at the same
time that we see a brighter outlook. We are striving to
keep our total costs for 2013 at the same level as for
2012. We are focused on profitability and capital
efficiency while investing in a better customer
experience and our employees’ development.

Michael Wolf
President and CEO
Table of contents
Page
Financial summary

4

Overview

5

Market

5

Important events during the quarter

5

Third quarter 2013 compared with second quarter 2013

5

Result

5

January-September 2013 compared with January-September 2012

6

Result

6

Credit and asset quality

7

Funding and liquidity

8

Ratings

8

Capital and capital adequacy

8

Market risk

10

Operational risks

10

Other events

10

Events after 30 September 2013

10

Business areas
Retail

11

Large Corporates & Institutions

13

Baltic Banking

15

Group Functions & Other

17

Eliminations

19

Product areas

20

Financial information
Group
Income statement, condensed
Statement of comprehensive income, condensed

25
26

Key ratios

26

Balance sheet, condensed

27

Statement of changes in equity, condensed

28

Cash flow statement, condensed

29

Notes

29

Parent company

52

Signatures of the Board of Directors and the President

56

Review report

56

Contact information

57

More detailed information can be found in Swedbank’s fact book, www.swedbank.com/ir, under Financial information and
publications.

Swedbank – Interim report January-September 2013

Page 3 of 57
Financial summary
Income statement
SEKm

Q3
2013

Q2
2013

%

Q3
2012

%

Net interest income
Net commissions
Net gains and losses on financial items at fair value
Other income
Total income

5 641
2 520
170
894
9 225

5 409
2 525
296
749
8 979

4
0
-43
19
3

5 085
2 375
687
824
8 971

11
6
-75
8
3

16 403
7 433
1 023
2 427
27 286

15 015
7 112
2 243
2 461
26 831

9
5
-54
-1
2

Staff costs
Other expenses
Total expenses
Profit before impairments

2 328
1 667
3 995
5 230

2 391
1 735
4 126
4 853

-3
-4
-3
8

2 229
1 691
3 920
5 051

4
-1
2
4

7 077
5 087
12 164
15 122

6 974
5 444
12 418
14 413

1
-7
-2
5

Impairment of intangible assets
Impairment of tangible assets
Credit impairments
Operating profit

0
95
-56
5 191

170
202
88
4 393

6

170
382
92
14 478

3
266
-109
14 253

998

913

-18

2 887

3 371

-14
7

Tax expense
Profit for the period from continuing operations

18

-1
102
36
4 914

9

1 216

-53

-7

Jan-Sep Jan-Sep
2013
2012

%

44
2

4 193

3 480

20

3 698

13

11 591

10 882

Profit for the period from discontinued operations, after tax

-15

-1 887

-99

-203

-93

-2 292

-823

Profit for the period
Profit for the period attributable to the shareholders of
Swedbank AB

4 178

1 593

3 495

20

9 299

10 059

-8

4 172

1 592

3 495

19

9 289

10 052

-8

Key ratios and data per share

Q3
2013

Q2
2013

Q3
2012

Return on equity, continuing operations, %
Return on equity, total operations, %

16.2
16.1

14.1
6.5

15.2
14.3

15.2
12.2

15.0
13.8

3.82

3.16

3.38

10.55

9.91

3.79

3.15

3.36

10.48

9.87

0.43

0.46

0.44

0.45

0.46

202

186

194

202

194

18.0
19.3
20.4

17.2
18.6
19.6

15.4
16.9
18.0

18.0
19.3
20.4

15.4
16.9
18.0

18.8
19.7
20.2

18.0
19.0
19.5

16.7
18.2
18.6

18.8
19.7
20.2

16.7
18.2
18.6

-0.02
0.69
53

0.03
0.76
54

0.01
1.32
65

0.01
0.69
53

-0.01
1.32
65

30 Sep
2013

31 Dec
2012

%

30 Sep
2012

%

1 248
624
106
1 832

1 239
580
103
1 847

1
8
3
-1

1 251
631
99
1 965

0
-1
7
-7

446
442

487
464

-8
-5

498
476

-10
-7

Earnings per share before dilution,
continuing operations, SEK 1)
Earnings per share after dilution,
continuing operations, SEK 1)
Cost/income ratio
Loan/deposit ratio, %
Common Equity Tier 1 ratio, %, Basel 3
Tier 1 capital ratio, %, Basel 3 2)
Capital adequacy ratio, %, Basel 3 2)

2)

Common Equity Tier 1 ratio, %, Basel 2
Tier 1 capital ratio, %, Basel 2
Capital adequacy ratio, %, Basel 2
Credit impairment ratio, %
Share of impaired loans, gross, %
Total provision ratio for impaired loans, %

Balance sheet data
SEKbn
Loans to the public
Deposits and borrowings from the public
Shareholders' equity
Total assets
Risk weighted assets, Basel 3 2)
Risk weighted assets, Basel 2
1)

Jan-Sep Jan-Sep
2013
2012

After deducting the preference share dividend, earnings per share for the first quarter 2013 were SEK 1.99 for continuing operations after dilution. The
calculations are specified on page 49.
2)
According to Swedbank’s interpretation of future regulations.
The key ratios are based on profit and shareholders’ equity allocated to shareholders of Swedbank.

Swedbank – Interim report January-September 2013

Page 4 of 57
Overview

Profit before
impairments
by business area
SEKm

Market
The Swedish economy shrunk by 0.2 per cent during
the second quarter compared with the first quarter.
Lower exports and investment were the biggest reason
for the decrease, while private consumption and
inventories continued to rise. However, the GDP decline
has not prevented employment from growing, although
the impact on unemployment has been small due to the
increased labour supply. During the third quarter
household and business sentiment improved in
Sweden. Pending income tax cuts, low inflation and
rising asset prices are boosting household purchasing
power. Although industrial confidence indicators have
risen, there are no signs yet of a recovery in exports and
industrial production owing to weak external demand.
There are also indications that it will take time before
business investment accelerates.
During the second quarter GDP in Latvia rose by 4.3 per
cent at an annual rate, while growth in Lithuania was 4.2
per cent. The Estonian economy grew during the same
period by only 1.0 per cent due to low investments and
a decline in net exports. Inflation continued to fall in the
Baltic economies and in September was 0.4 per cent in
Lithuania and 2 per cent in Estonia. In Latvia the
inflation rate was negative (-0.4 per cent) for the first
time since the recession year of 2010.
Uncertainly about US fiscal policy and the Federal
Reserve’s surprising decision in September not to taper
its bond purchases have pressed long-term bond yields
downward after having risen continuously since last
spring. The Riksbank maintained the repo rate at 1 per
cent at its most recent monetary meeting in September,
citing the high level of household indebtedness as the
main reason.
The Stockholm stock exchange (OMXSPI) gained 16
per cent during the first nine months of the year. The
Tallinn stock exchange (OMXTGI) rose by 14 per cent,
the Riga stock exchange (OMXRGI) by 15 per cent and
the Vilnius stock exchange (OMXVGI) by 19 per cent.

Important events during the quarter
On 19 July S&P revised Swedbank’s outlook from
negative to stable. For more information, see page 8

Third quarter 2013
Compared with second quarter 2013
Result
Profit before impairments increased by 8 per cent to
SEK 5 230m (4 853). Retail, Baltic Banking, and Group
Treasury within Group Functions & Other all contributed
to the increase, while profit before impairments within
LC&I fell.

Retail
Large Corporates &
Institutions
Baltic Banking
Group Functions & Other
Total excl FX effects
FX effects
Total

Q3
2013

Q2
2013

Q3
2012

3 102

2 914

2 936

996
849
283
5 230

1 086
800
61
4 861
-8
4 853

925
758
455
5 074
-23
5 051

5 230

The third quarter result amounted to SEK 4 172m
(1 592) and the result for continuing operations was
SEK 4 187m (3 478). The result for discontinued
operations was SEK -15m (-1 887) and consists mainly
of the result from the Russian operations. The Ukrainian
operations were sold during the second quarter.
Net recoveries amounted to SEK 56m (credit
impairments of 88), mainly due to higher net recoveries
within Baltic Banking. Retail reported higher credit
impairments than in the second quarter, while credit
impairments within LC&I decreased.
Tangible asset writedowns amounted to SEK 95m (202)
and mainly relate to the writedown of Ektornet’s property
values. There were no intangible asset writedowns
during the quarter (SEK 170m).
The return on equity was 16.2 per cent for continuing
operations (14.1). The cost/income ratio was 0.43
(0.46).
Income increased by 3 per cent to SEK 9 225m (8 979).
Net interest income accounted for the largest increase,
while net gains and losses on financial items at fair
value decreased. Other income rose due to increased
proceeds from property sales by Ektornet as well as a
higher share of profit of associates.
Net interest income increased by 4 per cent to SEK
5 641m (5 409). Retail and Group Treasury within
Group Functions & Other posted the largest increase.
Positive contributions came from higher lending
volumes and the difference in the maturity structure
between lending and deposits, where lending matures
on a continuous basis but funding matures on specific
dates. Mortgage margins displayed the same pattern as
in the second quarter: stable for the mortgage portfolio
as a whole, but with slightly lower margins on new
lending.
Net commission income was unchanged at SEK 2 520m
(2 525). Net commission income within Retail
contributed positively as a result of higher average
assets under management following a rise in equity
prices. Net commission income within LC&I was
seasonally lower. The outsourcing of Retail’s ATMs has
reduced both net commission income and expenses.
For more information, see page 12.
Net gains and losses on financial items at fair value fell
by 43 per cent to SEK 170m (296). LC&I reported a
lower result and was negatively affected by low risk
utilisation. Group Treasury had a continued negative
effect in the quarter.

Swedbank – Interim report January-September 2013

Page 5 of 57
Expenses decreased by 3 per cent compared with the
previous quarter and amounted to SEK 3 995m (4 126)
mainly due to seasonally lower expenses for staffing,
travel, marketing and consultants.
Expense analysis
Group
SEKm
Retail
Large Corporates &
Institutions
Baltic Banking
Group Functions & Other
and Eliminations
Total excl FX effects
FX effects
Total expenses

Q3
2013

Q2
2013

Q3
2012

2 389

2 398

2 477

759
604

833
603

720
575

243
3 995

302
4 137
-11

163
3 935
-15

3 995

4 126

3 920

The number of full-time positions decreased during the
quarter by 87, to 14 264. Baltic Banking decreased by
222. Group Functions & Other increased by 54, Retail
by 48 and Large corporates & Institutions by 33.
The tax expense amounted to SEK 998m (913),
corresponding to an effective tax rate of 19.2 per cent
(20.8). The relatively higher effective rate in the second
quarter is due to a non-deductible property writedown of
SEK 200m by Ektornet. No deferred tax assets were
booked in connection with the writedown.

January-September 2013
Compared with January-September 2012

For the first nine months of 2013 credit impairments of
SEK 92m were reported (net recoveries of 109m). LC&I
and Retail reported credit impairments, while Baltic
Banking reported net recoveries. Tangible asset
writedowns increased by SEK 116m to SEK 382m,
where SEK 375m related to Ektornet. Intangible asset
writedowns amounted to SEK 170m (3) and mainly
related to the writedown of IT systems within Swedbank
Finance AB and LC&I during the second quarter.
Fluctuations in exchange rates, primarily the
strengthening of the Swedish krona against the euro
and the Baltic currencies, reduced profit by SEK 61m.
The return on equity was 12.2 per cent (13.8). The
return on equity for continuing operations was 15.2 per
cent (15.0). The cost/income ratio was 0.45 (0.46).
Income increased by 2 per cent to SEK 27 286m
(26 831). Income in Retail, Baltic Banking and LC&I was
stable compared with the same period previous year.
Group Treasury reported higher income year-on-year.
Fluctuations in exchange rates reduced income by SEK
112m.
Net interest income increased by 9 per cent to SEK
16 403m (15 015). The repricing of corporate lending
within Retail and LC&I positively affected net interest
income. Treasury’s net interest income has been
temporarily strengthened by positions that have
benefited from falling market interest rates. The fee for
government guaranteed funding decreased by SEK
197m. Lower deposit margins due to falling Stibor and
Euribor rates as well as increased competition for
deposits in Sweden negatively affected net interest
income. Fluctuations in exchange rates reduced net
interest income by SEK 63m.

Results
Profit before impairments increased by 5 per cent to
SEK 15 122m (14 413). The first quarter 2012 was
negatively affected by a one-off adjustment of SEK
250m within Group Treasury. Stronger net interest
income, higher commission income and lower expenses
positively affected profit, while net gains and losses on
financial items at fair value were lower year-on-year.
Profit before
impairments
by business area
SEKm
Retail
Large Corporates &
Institutions
Baltic Banking
Group Functions & Other
Total excl FX effects
FX effects
Total

Jan-Sep Jan-Sep
2013
2012

∆
SEKm

8 987

8 794

193

3 168
2 329
638
15 122

3 068
2 386
121
14 370
43
14 413

100
-57
517
752
-43
709

15 122

The result for the period decreased by 8 per cent to
SEK 9 289m (10 052). The result for continuing
operations was SEK 11 581m (10 872). The result for
discontinued operations was SEK -2 292m (-820), of
which SEK 1 875m is a cumulative negative exchange
rate difference that was reclassified to the income
statement from other comprehensive income in the
second quarter in connection with the sale of the
Ukrainian operations. For more information, see note
24.

Swedbank – Interim report January-September 2013

Page 6 of 57

Net commission income improved to SEK 7 433m
(7 112). Higher commission income from asset
management from increased assets under
management, higher income from card operations and
increased activity in financing solutions positively
affected net commission income, while corporate
finance income was lower. The outsourcing of ATMs by
Retail has reduced net commission income as well as
expenses. For more information, see page 12.
Net gains and losses on financial items at fair value
decreased by 54 per cent to SEK 1 023m (2 243). The
first quarter 2012 was negatively affected by SEK 250m
by a one-off adjustment within Group Treasury. The
repurchase of government guaranteed bonds during the
second quarter 2013 and a relatively fast pace of
covered bond repurchases during the first nine months
of 2013 negatively affected net gains and losses on
financial items at fair value. The results from equity,
fixed income and currency trading were lower than in
the same period in 2012, when the first-quarter results
were very strong due to favourable market conditions.
Expenses decreased by 2 per cent to SEK 12 164m
(12 418). The largest decrease was in depreciation and
amortisation, mainly from a reclassification within
Swedbank Finance AB (Group Functions & Other), but
also within Ektornet. The reclassification in Swedbank
Finance AB at the same time reduced net interest
income. Expenses for transport and security fell by SEK
109m, telephone and postage expenses by SEK 61m
and other expenses by SEK 107m. Variable staff costs
increased by SEK 89m to SEK 670m due to the addition
of a new share-based programme for 2013 to the
accruals of previous share-based programmes for 2010,
2011 and 2012. Since 1 July 2010 Swedbank pays part
of its variable remuneration in the form of shares. This
remuneration is accrued as an expense until the shares
are settled. As a result, variable remuneration allocated
to employees during the period differs from the
recognised amount. A more detailed analysis of variable
1
remuneration is provided on page 14 of the fact book .
Changes in exchange rates reduced expenses by SEK
68m.
Expense analysis
Group
SEKm
Retail
Large Corporates & Institutions
Baltic Banking
Group Functions & Other
and Eliminations
Total excl FX effects
FX effects
Total expenses

Jan-Sep
2013

Jan-Sep
2012

∆
SEKm

7 193
2 327
1 783

7 317
2 217
1 751

-124
110
32

861
12 164

1 065
12 350
68

-204
-186
-68

12 164

12 418

-254

The number of full-time positions has decreased in one
year by 1 031, of which 585 were in Ukraine and
Russia, 317 in Baltic Banking and 345 in Ektornet
(Group Functions & Other). The number of full-time
positions in Retail increased by 73.
The tax expense amounted to SEK 2 887m (3 371),
corresponding to an effective tax rate of 19.9 per cent
(23.7). The lower effective tax rate in 2013 is mainly due
to a reduction of the Swedish corporate tax rate as of 1
January 2013.

Credit and asset quality
The bank’s credit portfolio is stable, with a low number
of customers with payment problems as well as low
credit impairments. The low credit risk in the mortgage
portfolio is also underscored by Swedbank’s internal
stress tests and is maintained through active and
continuous customer monitoring. This is confirmed by
the Riksbank’s latest stability report, where Swedbank is
the only one of the four major Swedish banks with a
positive result throughout the scenario period and
whose Common Equity Tier 1 ratio did not decrease.
The quality of the credit portfolio in the Baltic countries
increased during the nine-month period, with a lower
percentage of credit impairments and an improved risk
profile among customers. Credit demand remained low
in all of the bank’s home markets.
Swedbank’s lending increased during the first nine
months of the year by SEK 11bn to SEK 1 195bn, with
currency effects reducing the increase by SEK 2bn.
Lending to Swedish mortgage customers (including
tenant-owner associations) rose by SEK 9bn. Corporate
lending within LC&I and Retail increased marginally.
The lending portfolio in Baltic Banking rose slightly in
local currency, mainly due to a few large corporate
customers with low risk. The discontinuation of the
operations in Russia and sale of the Ukrainian
operations have reduced lending volume by SEK 4.2bn.
The average loan-to-value ratio of Swedbank’s
mortgages in Sweden was 62.6 per cent (63.5) as of 30
September, based on property level. The corresponding
1

More detailed information can be found in Swedbank’s fact book,
www.swedbank.com/ir, under Financial information and publications.

Swedbank – Interim report January-September 2013

Page 7 of 57

figure for new mortgages in Sweden was 69.7 per cent.
House prices in major Baltic cities have stabilised, with
a clear rise in Estonia. The average loan-to-value ratio
in Baltic Banking was 86.2 per cent, while the ratio for
new lending was about 70 per cent.
Impaired loans fell by SEK 5bn during the first nine
months to SEK 9bn. The sale of the Ukrainian
operations and discontinuation of operations in Russia
accounted for SEK 3bn of the decrease. In Baltic
Banking, impaired loans fell by SEK 3bn, mainly due to
write-offs and improved quality in the loan portfolio.
Impaired loans within LC&I increased by SEK 1bn
related to a few large commitments, while in Retail they
were unchanged during the period. Impaired loans to
private customers decreased during the nine-month
period. The share of Swedish mortgages past due by
more than 60 days was stable at 0.11 per cent of the
portfolio (0.13). The share of impaired mortgages in
Baltic Banking fell, with the largest decrease in Latvia.
The share of mortgages past due by more than 60 days
was 0.82 per cent in Estonia (1.1), 9.2 per cent in Latvia
(10.5) and 5.4 per cent in Lithuania (5.4). Further
improvements are expected this year.
Credit impairments for the first nine months of the year
amounted to SEK 92m (recoveries of SEK 109m).
Credit impairments within Retail and LC&I remained low
and were related to a few corporate commitments. The
recoveries in the Baltic countries primarily relate to a
limited number of corporate commitments.
Credit impairments, net
by business area
SEKm
Retail
Large Corporates &
Institutions
Baltic Banking
Estonia
Latvia
Lithuania
Group Functions & Other
Total

Q3
2013

Q2
2013

Q3
2012

106

37

72

7
-147
-38
-70
-39
-22
-56

94
-43
-36
18
-25
0
88

-38
-18
2
8
-28
20
36

The value of repossessed assets in the Group fell by
SEK 1 966m to SEK 3 100m during the nine-month
period, of which SEK 94m related to property
writedowns by Ektornet during the third quarter. During
the nine-month period properties with a book value of
SEK 1 925m were sold. For more information on
Ektornet, see page 18.
Swedbank’s exposure to counterparties in the GIIPS
countries (Greece, Ireland, Italy, Portugal and Spain)
remains low. The exposures totalled SEK 214m as of 30
September 2013 (401).
GIIPS exposure
30 Sep 2013
SEKm

Greece Ireland

Bonds
of which sovereign
of which held to maturity
Loans (money market
and commercial paper)
Derivatives net1
Other2
Total

0
0
0

0
0

Italy Portugal

2
0
2

Total

5
5
5

117
117
117

27

6
12
103

Spain

27
27
27

85
85
85

69
8
82

0
77
20
214

1

Derivatives at market value taking into account netting and collateral agreements.
The derivatives gross value i.e. market value plus internal add-ons, amounts to:
Ireland SEK 10m, Italy SEK 340m and Spain SEK 204m. Total SEK 554m.
2
Includes funds, trade finance and mortgage loans.

(NSFR) was 91 per cent on 30 September (95). The
main liquidity measure used by the Board of Directors
and executive management is the so-called survival
horizon, which shows how long the bank could manage
long periods of stress in capital markets, where access
to new financing is limited. At present the bank would
survive more than 12 months with the capital markets
completely shut down. This applies to the Group’s total
liquidity as well as liquidity in USD and EUR. For more
information on Swedbank’s funding and liquidity
(including the survival horizon), see pages 63-77 of the
fact book.

Ratings
Funding and liquidity

On 19 July S&P revised Swedbank’s outlook from
negative to stable. In S&P’s view, Swedbank increased
its ability to manage higher financial risks in Sweden
against the backdrop of the bank’s strong capitalisation
and earnings. S&P expects Swedbank’s capital situation
and profitability to continue to improve over the next two
years. In addition, S&P affirmed its A+ long-term and A1 short-term credit ratings on Swedbank and Swedbank
Mortgage.

During the first nine months of the year Swedbank
issued a total of SEK 89bn in long-term debt
instruments, of which SEK 61bn was covered bonds
and SEK 24bn was senior debt. Issuance during the
third quarter amounted to SEK 20bn, of which covered
bonds accounted for SEK 16bn and senior debt for SEK
4bn. At the same time the bank saw continued high
demand for private placements. In total Swedbank plans
to issue around SEK 120bn in the next 12 months to
meet maturing long-term funding with a nominal value of
SEK 98bn. Liquidity in excess of its refinancing needs
will be used in connection with day-to-day management
to repurchase covered bonds.

Capital and capital adequacy
The Common Equity Tier 1 ratio according to Basel 3
continued to strengthen during the quarter to 18.0 per
cent on 30 September, according to Swedbank’s
calculation based on current knowledge of future
regulations (17.2 per cent on 30 June 2013 and 15.4 per
cent on 31 December 2012). The new regulations were
adopted by the EU in June and take effect on 1 January
2014. Introduction of new capital buffers requires
implementation in Swedish law, however, and takes
effect later in 2014. The Common Equity Tier 1 ratio
according to Basel 2 was 18.8 per cent on 30
September (18.0 and 16.7, respectively).

The average maturity of all capital market funding
arranged through the bank’s short- and long-term
programmes was 31 months as of 30 September 2013
(33). The average maturity of long-term funding issued
during the first nine months was 52 months. The bank’s
short-term funding is mainly used as a cash
management tool, not to finance lending to the public.
Outstanding volume decreased by SEK 5bn during the
quarter to SEK 129bn.
Issued long-term debt
SEKbn
Covered bonds
of which SEK
of which EUR
of which USD
of which Other
Senior unsecured bonds
Structured retail bonds (SPAX)
Total

Q3
2013

Q2
2013

Q1
2013

16
15
1
0

23
14
9
0
0
5
1
29

23
13
1
7
2
15
1
39

4
0
20

Swedbank’s liquidity reserve, which is reported in
accordance with the Swedish Bankers’ Association’s
definition, amounted to SEK 236bn on 30 September
2013 (289). In addition to the liquidity reserve, liquid
securities in other parts of the Group amounted to SEK
39bn (35). The liquidity reserve and the Liquidity
Coverage Ratio (LCR) will fluctuate over time
depending, among other things, on the maturity
structure of the bank’s issued securities. According to
current Swedish regulations in effect as of 1 January
2013, the Group’s LCR was 147 per cent as of 30
September (129). Distributed by USD and EUR, LCR
was 659 per cent and 253 per cent, respectively. In
early 2013 the Basel Committee published a new
recommendation on the definition of LCR. According to
Swedbank’s interpretation of the new definition, LCR
would have been 180 per cent as of 30 September.
According to Swedbank’s interpretation of the current
draft regulation, the Group’s Net Stable Funding Ratio

Swedbank – Interim report January-September 2013

Page 8 of 57

Common Equity Tier 1 capital (Basel 2) increased by
SEK 1.2bn during the quarter to SEK 83.2bn. The
increase was mainly due to the quarterly profit, after
deducting the anticipated dividend. As of 1 January
2013 new rules have entered into force on the
recognition of pensions (accounting standard IAS 19).
The revisions will create volatility in the estimated
pension liability, which also affects equity through other
comprehensive income. Due to rising discount rates,
Common Equity Tier 1 capital increased by
approximately SEK 0.4bn during the third quarter and by
approximately SEK 2.1bn during the nine-month period.
Change in Common Equity Tier 1 capital 2013, Swedbank
financial companies group
SEKbn

SEKbn

90
Basel 2
81.9

85
80

500

3.9

0.4

0.0

Basel 2
83.2

Basel 3
487.1

480

-3.1

Basel 2
77.5

Basel 3
459.5

75

460

70
65

Change in risk weighted assets 2013, Swedbank financial
companies group

Basel 3
75.2

Basel 3
79.2

Basel 3
80.4

440

Basel 3
446.0
-4.7

Basel 2
464.3

-3.7

- 0.6

-1.4

-1.4

Basel 2
455.2

-1.9

420

60
55

0.0

Basel 2
441.6

400

50
380

45
40

Increase

Increase

Decrease

* Profit for financial companies group.

Subordinated loans that can be included in the capital
base decreased by SEK 0.6bn, mainly due to the
redemption of a subordinated loan of SEK 536m in midSeptember.
Risk weighted assets (Basel 2) decreased by SEK
13.6bn to SEK 441.6bn during the third quarter. The risk
weighted amount for credit risks decreased by SEK
11.8bn. Lower credit utilisation by corporate customers
within LC&I, coupled with less exposure to credit
institutions, has reduced the risk weighted amount by
SEK 4.7bn. Positive rating migrations have reduced the
risk weighted amount by SEK 3.7bn. Lower non-credit
obligations have reduced the risk weighted amount by
SEK 2.0bn (included in other credit risk in the diagram
below). Fluctuations in exchange rates, mainly
attributable to the Baltic credit portfolio, reduced the risk
weighted amount for credit risks by SEK 1.4bn due to
the strengthening of the Swedish krona against the
euro.
The risk weighted amount for market risks decreased by
SEK 1.8bn during the third quarter, mainly due to lower
exposures within LC&I and because the liquidity
portfolio in the Baltic region is risk weighted as credit
risk as of the third quarter. The risk weighted amount for
operational risks was unchanged as of 30 September
compared with 30 June.

Decrease

In May the Swedish Financial Supervisory Authority
announced its decision to introduce a risk weight floor of
15 per cent for the Swedish mortgage portfolio, in line
with the proposal announced in November 2012. The
floor will be introduced as a supervisory measure within
Pillar 2. Consequently, the reported capital ratios will not
be affected, since the calculations are made according
to the rules for Pillar 1. Accordingly, the average risk
weight in Swedbank’s Swedish mortgage portfolio is 4.4
per cent as of 30 September. Given the Swedish
Common Equity Tier 1 capital requirement of 12 per
cent (as of 2015), Swedbank, as per the Swedish
Financial Supervisory Authority’s decision to raise the
floor, has to maintain additional Common Equity Tier 1
capital of SEK 9.8bn for Swedish mortgages. This
corresponds to 2.2 percentage points of the Common
Equity Tier 1 ratio according to Pillar 1. In its internal
controls, Swedbank has for some time allocated
additional capital to its mortgage business equivalent to
the risk weight floor that has now been announced.
Risk-weighted assets by
business area, Basel 2
SEKbn
Retail
Large Corporates &
Institutions
Baltic Banking
Estonia
Latvia
Lithuania
Group Functions & Other
Group Products
Treasury
Ektornet
Other
Total risk-weighted assets

30 Sep
2013

31 Dec
2012

30 Sep
2012

200

202

212

128
87
35
27
25
27
4
16
4
3
442

134
95
38
31
26
33
4
15
6
8
464

135
93
37
31
25
36
3
16
6
11
476

Discussions among regulators and other interested
parties on the harmonisation of risk weights have
intensified in the last half-year. One topic of discussion
is how the leverage ratio can be used to ensure a

Swedbank – Interim report January-September 2013

Page 9 of 57
minimum capital level in relation to the size of the
balance sheet. When the EU’s new capital adequacy
rules (CRD IV/CRR) take effect on 1 January 2014,
banks will be obligated to report their leverage ratios to
the supervisory authorities. Swedbank’s leverage ratio
(according to CRR) was 4.35 per cent on 30 September.

Market risk
The majority of the Group’s market risks are of a
structural or strategic nature and are managed by Group
Treasury. Structural interest rate risks arise when the
maturity of the Group’s assets and liabilities, such as
deposits and lending, do not coincide. These differences
are managed within given mandates by matching the
maturities directly or through the use of various
derivatives such as interest rate swaps. Net interest
income sensitivity is also affected by structural risks in
the bank’s deposit operations, where various products
show different sensitivity to changes in market interest
rates.
Strategic currency risks arise primarily through risks tied
to holdings in foreign subsidiaries and their financing.
In Swedbank market risks also arise in LC&I’s trading
operations in connection with customer transactions and
by maintaining a secondary market for various types of
securities.
Swedbank measures market risks with a Value-at-Risk
(VaR) model, among other things. VaR expresses a loss
level that statistically will be exceeded by a specific
probability during a set time horizon. Swedbank uses a
99 per cent probability and a time horizon of one day.
This means that the potential loss for the portfolio,
based on historical data, will exceed VaR on one day of
100.
The table below shows Swedbank’s VaR*) performance
during the year.
VaR by risk category
SEKm
Interest risk
Currency rate risk
Stock price risk
Diversification
Total

Jan-Sep 2013 (2012)
Max
Min Average
97 (141)
17 (14)
9 (14)
0
89 (131)

59 (76)
2 (3)
2 (4)
0
58 (69)

30 Sep 31 Dec
2013
2012

76 (106)
8 (6)
4 (7)
-15 (-20)
73 (99)

61
7
3
-13
58

71
5
4
-14
66

*) VaR here excludes strategic currency rate risks, since a VaR
measurement based on a time horizon of one day is not
relevant.

For individual risk types, VaR is supplemented with risk
measures and limits based on sensitivity to changes in
various market prices. Risk taking is also monitored with
stress tests.
An increase in all market interest rates of one
percentage point as of 30 September 2013 would have
reduced the Group’s net gains and losses on financial
items at fair value by SEK 533m compared with a
decrease of SEK 52m as of 31 December 2012.

Swedbank – Interim report January-September 2013

Page 10 of 57

Operational risks
Swedbank’s measures to stabilise IT operations and
availability in the Internet Bank and Telephone Bank
have continued. In comparison with the first nine months
of 2012, the number of major IT-related incidents
decreased by 59 per cent at the same time that the
average time it took to address the incidents fell by 49
per cent. The long-term work to improve the bank’s IT
infrastructure is continuing according to plan.
The availability of Bankomat AB’s ATMs continued to
improve. During the quarter, however, on one occasion
deposits and withdrawals by Swedbank’s customers
through the ATMs were mistakenly registered twice.
External fraud attempts against the bank’s customers
have decreased and are at a low level year-on-year.
Expenses associated with operational risk events have
remained low.

Other events
Swedbank’s Annual General Meeting in Stockholm will
be held on Wednesday, 19 March 2014.
The Nomination Committee comprises the following
members: Lennart Anderberg, appointed by the ownergroup Föreningen Sparbanksintressenter and Chair of
the Nomination Committee; Ramsay Brufer, appointed
by Alecta Pensionsförsäkring; Jens Henriksson,
appointed by the owner-group Folksam; Tommy
Hjalmarsson, appointed by the owner-group
Sparbanksstiftelserna; Anders Sundström, Chair of the
Board of Directors of Swedbank AB.
The Nomination Committee will make proposals to the
2014 AGM on the election of Chair of the AGM, Chair of
the Board and other board members as well as election
of auditor. The Nomination Committee will also make
proposals on remuneration to the board members and
the auditor and propose principles for the selection of a
Nomination Committee for 2015.
Shareholders who would like to forward a proposal to
the Nomination Committee shall submit a proposal no
later than 20 December 2013 either by e-mail to:
valberedningen@swedbank.se or by mail to:
Valberedningen
c/o Swedbank AB
Valberedningens sekreterare, H12
SE-105 34 Stockholm, Sweden

Events after 30 September 2013
On 1 October the Russian central bank approved
Swedbank’s application to revoke Swedbank’s banking
licence in Russia.
Retail


Stable net interest income



Improved market position in mortgages



New pilot branches meet changing customer behaviour

Income statement
SEKm

Q3
2013

Q2
2013

%

Q3
2012

%

Net interest income
Net commissions
Net gains and losses on financial items at fair value
Share of profit or loss of associates
Other income
Total income

3 473
1 550
28
239
201
5 491

3 367
1 536
33
197
179
5 312

3
1
-15
21
12
3

3 405
1 532
39
223
214
5 413

2
1
-28
7
-6
1

10 172
4 675
95
640
598
16 180

10 138
4 601
124
635
613
16 111

0
2
-23
1
-2
0

Staff costs
Variable staff costs
Other expenses
Depreciation/amortisation
Total expenses
Profit before impairments

874
48
1 438
29
2 389
3 102

866
68
1 434
30
2 398
2 914

1
-29
0
-3
0
6

830
43
1 575
29
2 477
2 936

5
12
-9
0
-4
6

2 611
163
4 330
89
7 193
8 987

2 555
119
4 550
93
7 317
8 794

2
37
-5
-4
-2
2

Credit impairments
Operating profit

106
2 996

37
2 877

4

72
2 864

47
5

198
8 789

195
8 599

2
2

Tax expense
Profit for the period
Profit for the period attributable to the shareholders of
Swedbank AB

678
2 318

586
2 291

16
1

759
2 105

-11
10

1 899
6 890

2 236
6 363

-15
8

2 312

2 290

1

2 102

10

6 881

6 353

8

6

1

3

100

9

10

-10

28.1
244
0.05
0.44
925
378
4 969

28.1
243
0.02
0.45
919
378
4 921

25.5
245
0.03
0.46
909
371
4 896

2
2
1

28.0
244
0.03
0.44
925
378
4 969

26.8
245
0.03
0.45
909
371
4 896

2
2
1

Non-controlling interests
Return on allocated equity, %
Loan/deposit ratio, %
Credit impairment ratio, %
Cost/income ratio
Loans, SEKbn
Deposits, SEKbn
Full-time employees

Development January-September
Household and business sentiment in Sweden improved
in the third quarter. Low interest rates, increased real
incomes and rising asset prices are all benefiting
households. The impact on order books and production
has been marginal, although the lower number of
business bankruptcies in the last three months points to
a more stable economy and demand. To date this has
not led to an acceleration in lending.
Profit for the period amounted to SEK 6 890m (6 363),
the result of stable income, expenses and credit
impairments. The lower Swedish corporate tax rate
positively affected the result.
Net interest income was stable during the period
compared with the same period in 2012. The repricing
of corporate credit largely offset the lower deposit
margins, which were adversely affected by declining
market interest rates. Stibor declined slightly during the
third quarter. Deposit margins rose slightly. Mortgage
margins towards customers followed the same pattern
as the second quarter: stable for the mortgage portfolio
as a whole, but with slightly lower margins on new
mortgages. The margin on new loans was 10-15bp
lower than the stock margin as of 30 September.
Household deposit volume has grown by 1 per cent
since the beginning of the year. At the same time fund
Swedbank – Interim report January-September 2013

Page 11 of 57

1
0
1

Jan-Sep Jan-Sep
2013
2012

%

inflow increased. Swedbank’s share of household
deposits was slightly over 21 per cent (22 per cent as of
31 December 2012). Retail’s deposits from corporate
customers were unchanged from the beginning of the
year. Swedbank’s market share was 17 per cent as of
31 August (16 per cent as of 31 December 2012).
Mortgage lending volume has steadily increased during
the year and Swedbank has gradually improved its
market position. Its share of the net growth was 12 per
cent during the period January-August 2013.
Swedbank’s share of the total market was 25 per cent
(26 per cent as of 31 December 2012). Corporate
lending volume has increased by SEK 2bn since the
beginning of the year. The market share was 17 per
cent (17 per cent as of 31 December 2012).
Risk weighted assets amounted to SEK 200bn, a
decrease of SEK 2bn since the beginning of the year.
The effects of the increased exposure have been offset
by the effects of positive rating migrations.
Net commission income increased by 2 per cent
compared with the first nine months of 2012. The
increase was mainly due to higher fund volumes in the
wake of rising share prices, but also to net inflows
mainly to short-term fixed income funds and collective
occupational pensions. Increased income from lending
and guarantee commissions also contributed positively,
while payment commissions decreased slightly. Since
January 2013 Bankomat AB has gradually taken over
responsibility for Swedbank’s ATMs. Swedbank pays a
commission to Bankomat AB for this service. As a
result, net payment commissions and expenses have
both decreased. Commissions paid to Bankomat AB
amounted to almost SEK 90m during the third quarter
and are expected to range around SEK 300m for the full
year. At the same time expenses for administration and
maintenance are expected to decrease by about SEK
150m. This is in addition to other income of about SEK
80m from the savings banks as well as less need for
investment in new ATMs. As of 30 September all of
Swedbank’s ATMs have been shifted over to Bankomat
AB. A total of 639 ATMs that had previously belonged to
Swedbank were fully migrated to Bankomat AB. During
the quarter net commission income was stable with the
largest positive contribution from increased fund
volumes.
Expenses for the nine-month period fell by 2 per cent
year-on-year. Reduced manual cash handling has led to
lower transport and security expenses. Expenses were
stable during the third quarter.
Credit quality has remained good, although credit
impairments increased slightly during the period due to
increased provisions within the retail and service
sectors. The share of impaired loans was 0.18 per cent
(0.19 per cent).
Swedbank’s priorities for 2013 include improving the
customer offering and the efficiency of the bank’s
processes. A considerable share of the work involves
developing service, availability and product use through

telephone and digital channels. Customer behaviour
has changed in pace with society’s digitalisation.
Coupled with continued urbanisation, this has changed
the rationale for physical customer interactions at bank
branches. To adapt to changes in customer behaviour,
two pilot branches were launched in September, in
Karlstad and Nässjö, with a new way of working and a
new customer environment with video-based customer
meetings, among other things.
Changing customer behaviour has resulted in a longterm trend with less cash usage and more card usage.
On a rolling twelve-month basis the number of ATM
transactions decreased by 11 per cent. The total value
of withdrawals fell by 7 per cent. During the same period
the number of card purchases in stores rose by 11 per
cent and the aggregate value of card purchases by 8
per cent. Of the total number of card transactions, ATM
withdrawals accounted for 9 per cent and card
purchases for 91 per cent.
Use of Swedbank’s digital services continued to grow.
The Internet Bank had 3.5 million users as of 30
September, an increase of 131 000 in the third quarter,
while the Mobile Bank had 1.5 million (+137 000) and
the iPad Bank had 319 000 (+59 000).
During the third quarter efficiency improvements have
led to a clear reduction in response times in the
Telephone Bank. During the quarter the mobile and
iPad apps were updated to display electronic invoices
and credit card transactions, among other things.

Retail, Swedbank’s dominant business area, is responsible for all Swedish customers except for large corporates and
financial institutions. The bank’s services are offered through our digital channels such as the Telephone Bank, Mobile
Bank and Internet Bank as well as through Swedbank’s own branch network and the savings banks’ distribution network.
Retail includes Channels & Concepts, which is responsible for developing, managing and driving business in our digital
channels in Sweden. The various product areas are described on page 20.
Swedbank – Interim report January-September 2013

Page 12 of 57
Large Corporates & Institutions


High business activity in Large Corporates



Weak fixed income trading and equity trading



Reorganisation completed

Income statement
SEKm

Q3
2013

Q2
2013

Net interest income
Net commissions
Net gains and losses on financial items at fair value
Share of profit or loss of associates
Other income
Total income

864
467
387
0
37
1 755

851
523
503
0
49
1 926

2
-11
-23

269
99
375
16
759
996

292
104
426
12
834
1 092

Staff costs
Variable staff costs
Other expenses
Depreciation/amortisation
Total expenses
Profit before impairments
Impairment of intangible assets

%

Q3
2012

%
13
12
-18

-24
-9

768
416
471
0
0
1 655

-8
-5
-12
33
-9
-9

252
65
398
12
727
928

Jan-Sep Jan-Sep
2013
2012

%

2 246
1 297
1 761
6
17
5 327

11
9
-17

6

2 498
1 409
1 469
0
119
5 495

7
52
-6
33
4
7

848
291
1 147
41
2 327
3 168

847
290
1 082
34
2 253
3 074

0
0
6
21
3
3

3

0

56

0

56

4

Credit impairments
Operating profit

7
989

94
942

-93
5

-38
966

2

175
2 937

32
3 038

-3

Tax expense
Profit for the period
Profit for the period attributable to the shareholders of
Swedbank AB

211
778

256
686

-18
13

225
741

-6
5

684
2 253

926
2 112

-26
7

778

686

13

741

5

2 253

2 112

7

18.3
208
0.01
0.43
148
71
1 064

14.5
219
0.17
0.43
151
69
1 031

-2
3
3

14.6
192
-0.06
0.44
154
80
1 049

-4
-11
1

16.6
208
0.10
0.42
148
71
1 064

14.5
192
0.02
0.42
154
80
1 049

-4
-11
1

Return on allocated equity, %
Loan/deposit ratio, %
Credit impairment ratio, %
Cost/income ratio
Loans, SEKbn
Deposits, SEKbn
Full-time employees

Development January-September
Signals from the US central bank, the Federal Reserve,
about tapering its bond purchases contributed to
continued uncertainty in the financial markets. Several
emerging markets were hit by capital outflows with
significantly weakened currencies as a result. The Fed’s
decision in September not to reduce its bond purchases
had a stabilising effect, causing leading equity indexes
to rise. Long-term Swedish government bond yields,
which rose substantially during the quarter, have
retreated.
The profit amounted to SEK 2 253m for the nine-month
period, an increase of 7 per cent year-on-year. The
result was positively affected by lending-related income
and fund commissions but negatively by lower activity
and earnings in fixed income and equity trading as well
as Corporate Finance. The return on allocated equity
was 16.6 per cent.
Net interest income increased by 11 per cent compared
with the first nine months of 2012, partly due to the
repricing of corporate lending. Lending volume fell by 4
per cent or SEK 6bn. Compared with the previous
quarter net interest income rose 2 per cent in the third
quarter to SEK 864m. Business activity within Large
Corporates was high late in the quarter. The margin on
the loan portfolio increased slightly, however,
competition is expected to grow with tighter margins as
Swedbank – Interim report January-September 2013

Page 13 of 57

a result. Lending volumes fell slightly during the quarter,
partly due to lower credit utilisation as of 30 September
and a stronger krona. Deposit margins and volumes
were stable.
Risk weighted assets decreased by SEK 6bn during the
quarter to SEK 128bn as of 30 September. Risk
weighted assets for credit risk decreased by SEK 4bn,
mainly due to lower utilisation of credit and a stronger
krona. Risk weighted assets related to market risk
decreased by SEK 2bn as a result of generally lower
market volatility.
During the nine-month period net commission income
increased by 9 per cent year-on-year to SEK 1 409m,
mainly due to increased fund and lending commissions.
Compared with the previous quarter net commission
income decreased by 11 per cent to SEK 467m during
the third quarter, mainly related to lower earnings in
Corporate Finance. The weak income trend in equity
trading continued at the same time that income from
fund and cash management products was stable. Bond
issuance activity remained good in both Sweden and
Norway. Swedbank’s market share for issuances by
Swedish customers was 19 per cent for the nine-month
period. The corresponding figure in Norway was nearly
15 per cent, making the bank the third largest player in
both countries.
Net gains and losses on financial items at fair value for
the nine-month period decreased by 17 per cent yearon-year to SEK1 469m. Compared with the previous
quarter net gains and losses on financial items at fair
value decreased by 23 per cent. The quarter was
marked by seasonally low customer activity and low risk
utilisation. Uncertainty surrounding the tapering of
quantitative easing in the US continued to complicate
risk management. Earnings were slightly lower than
expected in fixed income and credit trading. Earnings in
currency trading were relatively good.
Total expenses for January to September increased by
3 per cent year-on-year, mainly related to IT expenses.
Quarterly expenses were lower than in the previous
quarter, mainly because payroll expenses in Norway are
not recorded for July and due to lower IT project activity.

Credit impairments amounted to SEK 175m during the
first nine months of the year, of which SEK 7m related to
the third quarter. The share of impaired loans was 0.48
per cent (0.10 per cent). Credit quality in the loan
portfolio remains good.
LC&I has implemented a reorganisation during the year
to increase customer satisfaction and raise profitability.
The organisational goal is to further develop customer
relations and create new business through a more
distinctive product offering. The new organisation, which
took effect on 1 July 2013, consists of five new units. As
of the third quarter 2013 they are reported separately in
the fact book.

Large Corporates & Institutions has customer responsibility for large corporates, financial institutions and banks as well
as for trading and capital market products. Operations are carried out by the parent bank in Sweden, branch offices in
Norway, Finland, the US and China, and through the trading and capital market operations in subsidiary banks in Estonia,
Latvia and Lithuania.
Swedbank – Interim report January-September 2013

Page 14 of 57
Baltic Banking
 Repricing of corporate lending contributed positively
 Continued good activity in daily banking business
 New organisational structure according to plan

Income statement
SEKm

Q3
2013

Q2
2013

%

Q3
2012

%

Net interest income
Net commissions
Net gains and losses on financial items at fair value
Other income
Total income

807
446
98
102
1 453

763
445
72
98
1 378

6
0
36
4
5

753
376
74
84
1 287

7
19
32
21
13

2 312
1 279
232
289
4 112

2 531
1 156
215
301
4 203

-9
11
8
-4
-2

175
18
382
29
604
849
1
-147
995

189
9
366
29
593
785
2
-43
826

-7
100
4
0
2
8
-50

2
50
11
-3
9
16
-80

20

171
12
343
30
556
731
5
-18
744

34

552
44
1 099
88
1 783
2 329
7
-260
2 582

550
47
1 088
94
1 779
2 424
7
-356
2 773

0
-6
1
-6
0
-4
0
-27
-7

84
911

68
758

24
20

59
685

42
33

213
2 369

232
2 541

-8
-7

911

758

20

685

33

2 369

2 541

-7

16.6
106
-0.50
0.42
117
110
3 831

13.4
108
-0.15
0.43
119
110
4 053

-2
0
-5

11.2
113
-0.07
0.43
111
99
4 148

5
11
-8

14.1
106
-0.30
0.43
117
110
3 831

13.9
113
-0.40
0.42
111
99
4 148

5
11
-8

Staff costs
Variable staff costs
Other expenses
Depreciation/amortisation
Total expenses
Profit before impairments
Impairment of tangible assets
Credit impairments
Operating profit
Tax expense
Profit for the period
Profit for the period attributable to the shareholders of
Swedbank AB
Return on allocated equity, %
Loan/deposit ratio, %
Credit impairment ratio, %
Cost/income ratio
Loans, SEKbn
Deposits, SEKbn
Full-time employees

Development January-September
The Baltic countries’ growth remained among the
strongest in the EU in the second quarter. Compared
with the previous year GDP rose by 4.4 per cent in
Latvia and 3.8 per cent in Lithuania, but only 1.0 per
cent in Estonia. Against the backdrop of the
improvement in the eurozone, higher growth is
anticipated in all three countries. Household spending is
expected to remain strong due to rising incomes and
confidence. Latvia will join the EMU in 2014 and
Lithuania has a strong case to do the same in 2015.
The result amounted to SEK 2 369m for the first nine
months, against SEK 2 541m in the same period a year
earlier. The decrease was mainly due to lower net
interest income and lower net recoveries.
Net interest income declined by 7 per cent in local
currency compared with 2012. Lower market rates
negatively affected net interest income, while increased
deposit volumes and a slightly larger loan portfolio had a
positive impact. Loan portfolios with a volume of SEK
1.6bn were acquired from Hipoteku Bank in Latvia
during the second half of 2012. Fluctuations in
exchange rates reduced net interest income by SEK
26m. Net interest income in local currency rose by 6 per
cent in the third quarter with the repricing of corporate
lending and the euro’s appreciation against the krona
both contributing positively. Compared with the previous
quarter net interest income increased by 4 per cent in

Swedbank – Interim report January-September 2013

Page 15 of 57

Jan-Sep Jan-Sep
2013
2012

%

local currency. It is the first time in 2013 that quarterly
net interest income has risen year-on-year.
Work has been initiated to reprice business that does
not meet the desired risk-adjusted returns. Exposures
whose return requirements cannot be met will be
divested when possible. This may adversely affect
lending growth.
Lending volumes increased by 2 per cent in local
currency compared with 30 September 2012. The
increase is mainly attributable to the corporate segment.
Signs of improvement in new household lending have
been seen in Estonia and Lithuania since May. In
Latvia, the lending portfolio decreased due to
amortisations and write-offs, despite the acquisition of
Hipoteku’s loan portfolios in the second half of 2012.
Swedbank’s market share in lending was 29 per cent as
of 31 August (31 per cent as of 31 December
2012).
The deposit volumes increased by 9 per cent in local
currency compared with 30 September 2012. Private
deposits increased by 10 per cent and corporate
deposits by 7 per cent on an annual basis. The Latvian
deposit portfolio increased the most, with the acquisition
of Hipoteku bank contributing SEK 1.8bn. Swedbank’s
market share for deposits was 30 per cent as of 31
August (31 per cent as of 31 December 2012).
The loan-to-deposit ratio was 106 per cent (108 per cent
as of 31 December 2012).

were generated in the corporate portfolio, while the
mortgage portfolio generated some impairments.

Net commission income increased by 12 per cent in
local currency compared with the first nine months of
2012. The increase was mainly due to higher payment
commissions, supported by increased customer activity,
and higher commission income from fund management.
Compared with the previous quarter net commission
income rose by 15 per cent in local currency during the
third quarter.

Impaired loans continued to decline during the first nine
months in all three Baltic countries, but mostly in Latvia.
Impaired loans, gross, amounted to SEK 6.3bn (SEK
11.4bn on 30 September 2012). The decrease was
mainly due to amortisations, write-offs and loans that
have started to perform, while the inflow of new
impaired loans was limited. Credit quality has
strengthened through a gradual increase in new lending,
which carries a lower risk.

Net gains and losses on financial items at fair value
increased by 9 per cent in local currency, supported by
one-off revenue of SEK 17m from a revaluation gain.
Expenses increased by 2 per cent in local currency from
the previous year, including euro transition costs of SEK
29m in Latvia, which is preparing to adopt the euro on 1
January 2014. The bank’s expenses related to the euro
transition are estimated at SEK 90m in 2013. In order to
increase efficiencies and improve collaboration, a
unified organisational structure is being implemented
across the Baltic countries. At the same time the focus
is on developing a multichannel strategy based on
customer needs and behaviour. The aim is to improve
the customer experience, support new business and
increase channel efficiencies.

Risk-weighted assets decreased by SEK 8bn during the
first nine months to SEK 87bn, driven by the corporate
portfolio as a result of active portfolio quality
management.
The number of active customers has increased to nearly
2.6 million in 2013. In the annual Most Loved Brand
survey, Swedbank came fifth in the Baltic countries.
Swedbank received the highest score among
companies which are in full-time contact with their
customers and was the only bank in the top 30.

Net recoveries amounted to SEK 260m, compared with
SEK 356m for the first nine months of 2012. Recoveries

Baltic Banking has business operations in Estonia, Latvia and Lithuania. Products and services are sold through the
bank’s branch network and digital channels. The various product areas are described on page 20.
Swedbank – Interim report January-September 2013

Page 16 of 57
Group Functions & Other
Income statement
SEKm

Q3
2013

Q2
2013

Net interest income
Net commissions
Net gains and losses on financial items at fair value
Share of profit or loss of associates
Other income
Total income

498
31
-343
1
412
599

426
1
-312
0
303
418

17

Staff costs
Variable staff costs
Other expenses
Depreciation/amortisation
Total expenses
Profit before impairments

797
48
-634
105
316
283

812
51
-604
97
356
62

-2
-6
5
8
-11

Impairment of intangible assets
Impairment of tangible assets
Credit impairments
Operating profit

0
94
-22
211

114
200
0
-252

Tax expense
Profit for the period from continuing operations

25
186

3
-255

Profit for the period from discontinued operations, after tax
Profit for the period
Profit for the period attributable to the shareholders of
Swedbank AB

-15
171

-1 887
-2 142

171

-2 142

0

0

4 400

4 346

Non-controlling interests
Full-time employees

Development January-September
Income for Group Functions & Other consists of net
interest income and net gains and losses on financial
items, which mainly come from Group Treasury. Other
income primarily consists of revenue from the savings
banks as well as sales revenue and operating income
from Ektornet. Income amounted to SEK 1 668m
(1 301).
Expenses for Group Functions & Other decreased by 13
per cent from the previous year to SEK 1 030m (1 180).
Excluding the net of services purchased and sold
internally, expenses fell by 6 per cent to SEK 5 073m
(5 380). The decrease was mainly due to lower costs for
IT operations and depreciation as well as lower staff
costs following a reduction in staff numbers.
Depreciation fell due to a reclassification within
Swedbank Finance AB, which at the same time reduced
net interest income, as well as lower depreciation in
Ektornet.
Group Products
Established on 1 January 2013, Group Products (GP)
consists of around 1 800 employees in Sweden,
Estonia, Latvia and Lithuania. GP is responsible for a
large part of Swedbank’s product areas with a strategy
to support the business areas by reducing the
complexity of the product range and simplifying sales in
the various distribution channels. The product areas GP
is responsible for – cards, payments, lending, deposits,
insurance and asset management – are described in
more detail on page 20. GP also comprises the
subsidiary Swedbank Franchise AB, which in turn
includes the real estate and business brokerages and a
legal service provider.

Swedbank – Interim report January-September 2013

Page 17 of 57

%

10
36
43

Q3
2012
162
31
103
2
348
646
792
64
-796
130
190
456

%

Jan-Sep Jan-Sep
2013
2012

-50
18
-7

1 419
7
-773
3
1 012
1 668

105
4
143
3
1 046
1 301

1
-25
-20
-19
66
-38

2 396
172
-1 838
300
1 030
638

2 441
125
-1 808
422
1 180
121
-1
259
20
-157

0

-86
11

91
79

-203
-36

-93

-2 292
-2 213

-3

4 400

5 202

-2
38
-2
-29
-13

-954

1

0
-3
28

-823
-957

-2 214

75

-23
-134

-3
1

-38

114
375
-21
170

-33

-99

-1
97
20
340
173
167

-53

%

5 202

-3

-15

45

-15

In GP’s revenue and expense model, revenue from
Swedbank’s customers is posted by each business area
and GP receives compensation from the business area
to cover its expenses. GP’s external revenue largely
comes from the savings banks for the products their
customers use.
Expenses, excluding the net of services purchased and
sold internally, amounted to SEK 2 343m (2 489) for the
first nine months of 2013. The decrease was mainly due
to lower IT maintenance expenses thanks to increased
efficiencies as well as lower mailing costs resulting from
increased digitalisation.
Group Treasury
Group Treasury is responsible for the bank’s funding,
liquidity and capital planning, including internal control
and pricing within these areas. The Group’s equity is
allocated to each business area on the basis of capital
adequacy rules and how much capital is needed based
on the bank's Internal Capital Adequacy Assessment
Process (ICAAP).
Group Treasury prices funding and liquidity through an
internal interest rate, where the most important
parameters are maturity, interest fixing period, currency,
and the need for liquidity reserves. Swedbank is
conducting a project to further refine internal rate setting
control in 2013.
Group Treasury’s result over time should be nearly nil,
with the exception of earnings that may arise in debt
and liquidity management within given risk mandates.
The fee paid to the Swedish National Debt Office for
government guaranteed funding is charged against
Group Treasury. Risk hedging by Group Treasury is
generally achieved with financial instruments. The
volatility in results over time is largely due to accountingbased fluctuations in these hedges.
Net interest income for the first three quarters amounted
to SEK 1 518m, compared with SEK 211m in the same
period of 2012. Of the SEK 1 307m change, SEK 197m
is due to lower fees for the government guaranteed
funding. Repurchases of covered bonds in particular
and the fact that the bank’s internal prices better reflect
its funding costs have positively affected net interest
income. Group Treasury’s net interest income has also
been strengthened by positions that have benefited from
lower market rates. Consequently, net interest income is
likely to trend lower going forward as position
extensions are made at lower interest rates and
spreads.
Net gains and losses on financial items at fair value
amounted to SEK -783m for the nine-month period,
compared with SEK 112m in the previous year.
Repurchases of covered and senior bonds reduced
net gains and losses on financial items at fair value by
SEK 388m. Repurchases of covered and senior bonds
carried at fair value have also had a negative effect on
the result. The negative effects of the repurchases are
offset over time by positive effects on net interest
income. Management of the bank’s liquidity portfolio
reduced net gains and losses on financial items at fair
value by SEK 50m, partly because the surplus values in
certain portfolio holdings are declining in pace with their
remaining maturities. The liquidity portfolio has an
average remaining maturity of about 2 years.
Russia and Ukraine
The Russian and Ukrainian operations are reported as
discontinued operations since the first quarter. During
the second quarter the sale of the Ukrainian subsidiary
was finalised. The nine-month result for discontinued
operations includes a half-year result for the Ukrainian
operations of SEK -2 236m. Of this amount,
SEK -1 875m, which was reclassified to the income
statement during the second quarter, which has not
affected Swedbank’s capital, capitalisation or cash flow
and will not be taken into account in the Board of
Directors’ dividend proposal for 2013.
The result for the Russian operations amounted to
SEK -63m during the nine-month period. The formal
liquidation of the legal entity OAO Swedbank is under
way. Swedbank’s net lending in Russia (including
leasing) amounted to SEK 1bn as of 30 September. The
lending portfolio in Russia, consisting mainly of good

quality corporate loans, will decrease through
amortisation. Swedbank has real estate assets worth
about SEK 123m in Russia, which will be sold.
On 1 October the Russian central bank approved
Swedbank’s application to revoke Swedbank’s banking
licence in Russia.
Ektornet
Ektornet manages and develops Swedbank’s
repossessed assets to recover as much value as
possible. The focus going forward is on selling the
property holdings.
Repossessed assets decreased during the period to
SEK 2 772m (SEK 4 606m as of 31 December 2012).
Assets taken over
SEKm
Sweden
Finland
Estonia
Latvia
Lithuania
USA
Ukraine
Total properties
Shares
Total

30 Sep
2013
45
0
192
1 230
178
744
351
2 740
32
2 772

31 Dec
2012
374
281
304
1 665
351
1 217
364
4 556
50
4 606

During the nine-month period properties were sold for
SEK 1 925m (1 100) with an aggregate capital gain of
SEK 224m (148). The sales of portions of the
shareholding produced a capital gain of SEK 82m.
Sales proceeds in the third quarter amounted to SEK
424m (255) with a gain of SEK 96m (41). The third
quarter sales mainly consisted of a housing complex in
the US. Property values in the portfolio were written
down by SEK 375m (259), including SEK 94m (97) in
the third quarter. The result for the nine-month period
was SEK -255m (-335). Expenses amounted to SEK
324m (469).
The number of employees at the end of the period was
119, compared with 464 (of which 270 hotel employees)
as of 30 September 2012. The number of properties,
including apartments and the like, was 1 934 (2 528 at
the beginning of the year), of which 1 166 were in Latvia
(1 695 at the beginning of the year).

Group Functions & Other comprises, in addition to Group Functions, Group Products, the Group Executive Committee
and Internal Audit. Group Functions operate across the business areas and serve as strategic and administrative support.
The Group Functions are Group IT, Accounting & Finance (including Group Treasury), Risk, Compliance, Public Affairs,
HR and Legal. Ektornet and the banking operations in Russia, which are reported as discontinued operations, are
included as well.
Swedbank – Interim report January-September 2013

Page 18 of 57
Eliminations
Income statement
Q3
2013

Q2
2013

Q3
2012

Net interest income
Net commissions
Net gains and losses on financial items at fair value
Other income
Total income

-1
26
0
-98
-73

2
20
0
-77
-55

-3
20
0
-47
-30

2
63
0
-234
-169

-5
54
0
-160
-111

Staff costs
Variable staff costs
Other expenses
Depreciation/amortisation
Total expenses

0
0
-73
0
-73

0
0
-55
0
-55

0
0
-30
0
-30

0
0
-169
0
-169

0
0
-111
0
-111

SEKm

Jan-Sep Jan-Sep
2013
2012

Group eliminations mainly consist of eliminations of internal transactions between Group Functions and the other
business areas.

Swedbank – Interim report January-September 2013

Page 19 of 57
Product areas
Swedbank intends to gradually expand its product reporting. This is being done outside the consolidated accounts, which
means that in most cases the figures cannot be directly traced to specific items in the financial statements. Responsibility
for the product units currently rests with Group Products within Group Functions & Other, but the results are reported in
several legal units and in the three business areas.

Card business
Swedbank issues cards and acquires card payments
from merchants in all its home markets as well as in
Denmark and Norway. All card operations are handled
within the bank, with the exception of the credit card
operations in Sweden, Denmark and Norway, which are
conducted through Entercard AB, a joint venture with
Barclays Bank. In its four home markets as a whole,
Swedbank has a market share for card payment
acquisitions and issuing of nearly 50 per cent.
Swedbank is Europe’s fifth largest card payment
acquirer based on number of transactions. As a card
payment acquirer, Swedbank enables retailers to accept
payment through card terminals and online. Revenue
mainly comes from the transaction prices received as
compensation for infrastructure, administration and
payment guarantees. As a card issuer, the bank
generates revenue from fees charged to customers for
access to a card, exchange fees for foreign purchases
and interest income from outstanding credit card
balances. In card payment acquisitions, rapidly
expanding e-commerce is one of Swedbank’s most
important growth areas. The aim is to be a significant
player in the bank’s home markets. In most retail
sectors, the growth rate for e-commerce far exceeds
that of brick and mortar stores, with home electronics
and apparel representing the largest share. Nine of ten
Swedish consumers state that they shop online
(E-barometern, Posten 2013). E-commerce volume is
expected to reach about 10 per cent of retail sales in
2015 (Ehandelsbarometern 2013). Swedbank’s
payment acquisition volume in e-commerce increased
by over 65 per cent compared with the first three
quarters of 2012.
When a Swedbank card is used at a point of purchase
where Swedbank does not acquire the payments, it
receives a commission. Similarly Swedbank pays a
commission to other issuers whose cards are used in
stores where Swedbank is the payment acquirer.
The number of transactions made by card is increasing
in all of Swedbank’s home markets due to economic
growth and in pace with reduced use of cash. A large
share of Swedbank’s transaction revenue is based on
the number of transactions, not solely on the
transactions’ value. This makes issuing and acquiring
revenue less volatile during periods of slower economic
growth.
Swedbank is the eleventh largest bank card issuer
based on number of transactions. In Sweden, nearly 80
per cent of store purchases are made by card, giving it
one of the highest levels of card usage in the world.
Transaction growth is about 10 per cent per year and
volume growth about 5 per cent. In Estonia, the
percentage of card transactions is also high (55 per
cent), with an annual growth rate of about 8 per cent. In
Latvia and Lithuania, card usage is lower (35 and 20 per
cent, respectively), but the growth rate is expected to be
higher than in Sweden and Estonia.

Swedbank – Interim report January-September 2013

Page 20 of 57

Card related income
SEKm
Card acquiring
of which Nordic countries
of which Baltic countries
Card issuing
of which Sweden
of which Baltic countries
Net interest income, credit cards
of which Sweden
of which Baltic countries
Entercard*
Total Card related income

Jan-Sep Jan-Sep
2013
2012
590
502
88
1 231
820
411
218
49
169
994
3 033

577
498
80
1 150
781
368
206
47
159
959
2 891

%
2
1
10
7
5
12
6
5
6
4
5

* Swedbank's share of Entercard's total income. Entercard is consolidated into
Swedbank Group by the equity method.

The positive income trend during the first nine months is
mainly due to an increased number of payment
acquisition and card issuance transactions as well as
higher credit volumes in Entercard. Increased payment
acquisition revenue in the Nordic region was also due to
a good result for the Norwegian branch and to more ecommerce customers. The stable card issuance
revenue in Sweden is the result of transaction volume.
The increase in card issuance revenue in the Baltic
countries is due to an increased number of transactions
and higher annual fees. Lower compensation from card
payment acquisitions in the Baltic countries following an
adjustment to interbank compensation in 2012 has been
partly offset by increased card usage.
The increase in the number of acquisition transactions
was 11 per cent in Sweden, 6 per cent in Estonia, 16
per cent in Latvia and 18 per cent in Lithuania. The rate
of increase is expected to continue this year. In terms of
acquisition volume, the Nordic countries account for
about 90 per cent, although growth is higher in the Baltic
countries. Income is not growing at the same pace as
the volume of acquired payments or the number of
acquired transactions because of price pressure from
increased competition and tighter regulations. The
expansion of the payment business to Norway and
Denmark now generates 2.6 per cent of transactions
and 7.1 per cent of income. The number of card
purchases increased during the first nine months by 12
per cent. The largest increases in percentage terms
were in Latvia and Lithuania (19 and 17 per cent). In
card issuance, the biggest growth opportunity is in
corporate cards, where the bank has historically been
weaker and where small business customers offer
significant potential.

Key ratios, cards
Card acquiring transactions, millions
Card acquiring volume, SEKbn
Issued cards, millions
Card purchases (POS), millions
POS/total card turnover, %

Jan-Sep Jan-Sep
2013
2012
1 310
323
7.8
887
65

1 176
295
7.8
793
63

%
11
9
1
12
Proposal to cap interchange fees for card
transactions
In July the EU Commission presented a proposal to cap
the interchange fees paid by payment acquirers to card
issuers. The draft regulation can take effect no earlier
than the second quarter of 2014, provided that the draft
is adopted without revisions. For Swedbank’s card
issuance business it will mean lower revenue, and at the
same time expenses in the card payment acquiring
business will decrease. The credit card business will be
affected more than the bank card business, since
interbank compensation there is higher. The effect on
the Swedish operations is limited, but more significant in
the Baltic countries due to the currently higher level of
interbank compensation. The total impact for Swedbank
depends on pricing competition between payment
acquiring services.

Insurance business
Swedbank has life insurance operations in all its home
markets and non-life operations in the Baltic countries.
Non-life insurance is offered in Sweden through a thirdparty solution with the insurance company Tre Kronor.
Insurance products are sold through the distribution
channels of Swedbank and the savings banks.
Premium payments
SEKm
Sweden
of which collective occupational
pension
of which endowment insurance
of which occupational pension
of which risk insurance
of which other
Baltic countries
of which life insurance
of which non-life insurance

Jan-Sep Jan-Sep
2013
2012

%

10 730

9 953

8

2 986
5 290
1 479
504
470

3 250
4 470
1 297
476
461

-8
18
14
6
2

750
463
287

717
445
272

5
4
5

Sweden
The Group’s Swedish life insurance company is the
sixth largest company in the Swedish market, with a
market share of about 7 per cent in terms of premium
payments. Premium income rose by 8 per cent to SEK
10.7bn during the nine-month period. In savings
products, the biggest increase was in endowment
insurance for the corporate market, where time has
been devoted to informing about, and providing training
on, the products.
Over 72 000 of Swedbank’s risk protection policies were
sold during the period, an increase of 15 per cent yearon-year. Due to an ageing population and shift in
responsibility from society to the individual, demand for
pension and insurance products is expected to grow.
The largest potential for Swedbank in Sweden today is
in risk products such as life and health insurance as well
as in occupational pensions. Today only 20 per cent of
Swedbank’s and the savings banks’ corporate
customers with revenues of SEK 1-100m have an
occupational pension solution for their employees from
Swedbank Försäkring.
Premium income from occupational pensions amounted
to SEK 4.5bn (4.5) during the period, of which
occupational pensions excluding collective pensions
increased by 14 per cent year-on-year to SEK 1 479bn.
Since 1 July Swedbank Försäkring is a company of
choice for the collectively negotiated occupational
Swedbank – Interim report January-September 2013

Page 21 of 57

pension plan (ITP). The fees for ITP are low, but it is
important for the bank to be able to offer collective
occupational pensions as part of a total offering to the
1.5 million private sector employees. Swedbank
Försäkring offers 22 funds with the highest aggregate
ratings of the companies. Half of the funds are from
Robur.
Swedbank’s priorities for 2013 include simplifying
processes and routines and improving efficiencies. For
example, administrative paperwork has now been
completely digitised, and simplified risk rules have made
it easier and more expedient to manage customers. An
automated sales workflow for risk protection insurance
means that 75 per cent of cases can be processed at
the time of sale.
Baltic countries
In Estonia, Latvia and Lithuania, the market shares for
life insurance as of 31 August were 37, 15 and 22 per
cent, respectively, making Swedbank the largest life
insurer in Estonia and Lithuania. Life insurance
operations are divided into risk insurance and savings
products. Swedbank mainly focuses on risk insurance
for existing loan customers in the retail banking market,
where it sees great opportunities to promote sound and
sustainable finances due to the limited social welfare
system in the Baltic countries.
The sale of risk insurance to loan customers in Baltic
Banking have been successful. During the period sales
of credit life, a life insurance product tied to a bank loan,
increased by 5 per cent in local currency and now
amount to SEK 52m. Around 32 per cent of the bank’s
borrowers currently have credit life insurance. From
January to September premium payments for the total
Baltic life insurance operations rose by 6 per cent in
local currency to SEK 463m year-on-year.
The market shares for non-life insurance in Estonia,
Latvia and Lithuania are 14, 3 and 1 per cent,
respectively. In non-life insurance, Swedbank mainly
offers solutions for private customers. The largest
product areas are auto and home insurance, which are
offered together with leasing and mortgages. Since auto
and home sales have fallen in recent years, the focus
has been on boosting sales by launching new and
simpler products. One example is loan payment
protection, which covers loan expenses in the event of
an illness or job loss. Another is the sale of home
insurance through bank branches, which was launched
in Lithuania during the summer. This was already being
offered in Estonia and Latvia. Total premium income for
non-life insurance in the Baltic countries amounted to
SEK 287m during the period, an increase of 7 per cent
in local currency.
Assets under management
SEKbn
Sweden
of which collective occupational
pension
of which endowment insurance
of which occupational pension
of which other
Baltic countries
of which life insurance

30 Sep
2013

31 Dec
2012

%

113.8

103.0

10

45.2
48.7
11.6
8.4
3.3
3.3

39.3
45.8
10.0
8.1
3.2
3.2

15
6
16
4
2
2

Assets under management in Sweden increased by 10
per cent during the first nine months of 2013 to SEK
113.8bn, of which SEK 99.7bn relates to unit linked and
deposit insurance. The increase is partly due to
favourable market conditions with rising fund and equity
prices and partly to a positive net inflow. The net inflow
consists of receipts in the form of premiums and
disbursements in the form of pensions, cancellations
and repurchases. Assets under management in the
Baltic life insurance company decreased by 0.4 per cent
in local currency to SEK 3.3bn, of which SEK 1.9bn is
unit linked insurance. The decrease relates to traditional
management, where the portfolio decreased during the
last quarter of 2012 owing to large pension
disbursements.
Insurance related income
SEKm

Jan-Sep Jan-Sep
2013
2012

Sweden
of which life insurance
of which non-life insurance
Baltic countries
of which life insurance
of which non-life insurance
Total insurance related income

1 101
1 049
52
258
134
124
1 359

%

1 099
0
1 066
-2
33 54
312 -17
156 -14
157 -21
1 412
-4

Revenue
Swedbank’s aggregate insurance revenue amounted to
SEK 1 359m (1 412) during the nine-month period. The
decrease in Swedish life insurance was mainly due to
falling interest rates, which meant a lower return on
equity. On the other hand, revenue for the Swedish nonlife business rose. There are now nearly 218 000
policies, an increase of 9 per cent year-on-year.
Revenue for the Baltic life and non-life businesses
decreased. In this case as well, falling interest rates
meant a lower return on the assets, primarily for the life
insurance business, where the risk result at the same
time was stable. Revenue for the Baltic non-life
business fell by 20 per cent in local currency to SEK
124m at the end of the period. The decrease was mainly
due to a lower risk result owing to higher claims than in
the previous year. Claims during the period are in line
with the average for previous years, while the level of
claims in the previous year was relatively low.

Asset management operations
Swedbank’s asset management operations are
conducted through the Swedbank Robur group in
Swedbank’s four home markets and Norway. In total,
Swedbank Robur offers around 120 funds as well as
discretionary asset management, including
management of pension assets. Fund assets under
management amounted to SEK 581bn at the end of the
period, of which SEK 560bn was in Sweden, where the
market share was 24 per cent in terms of assets under
management. Discretionary assets under management
amounted to SEK 266bn.
Most of the total net inflow to the Swedish fund market,
consisted of equity, mixed and short-term fixed income
funds. Long-term fixed income funds saw a net outflow.
The total net inflow to Swedbank Robur’s funds in
Sweden was SEK 6bn, giving it a market share of 10
per cent. The positive net flow was mainly due to a high
level of activity at Swedbank’s and the savings banks’
branches, where flows mainly went to investment
solutions (mixed funds) and short-term fixed income
funds.
Measures to clarify and simplify the customer offering
are continuing in 2013.
Swedbank – Interim report January-September 2013

Page 22 of 57

Asset management
Key ratios, SEKbn
Total income, SEKm
Asset under management
of which Sweden
of which Baltics
of which Norway
Discretionary asset management
of which Sweden
of which Baltics

Jan-Sep Jan-Sep
2013
2012
%
3 003
2 747
9
581
475 22
560
457 22
19
16 15
2
2 22
266
283
-6
264
282
-6
2
1 100

Income from capital market products amounted to SEK
3 003m during the nine-month period, 9 per cent higher
year-on-year. The improvement was mainly from an
increase in average capital as a result of higher equity
prices, but also from the positive net flows. Excluding
the Folksam LO funds consolidated in the fourth quarter
of 2012, average fund assets grew by 10.6 per cent.
Compared with the previous quarter, income rose by
SEK 21m during the third quarter. Income was positively
affected by the market’s performance. Average assets
under management climbed 2.1 per cent during the
quarter.
Income from institutional management, excluding
Swedbank Robur’s funds, amounted to SEK 67m during
the period, a decrease of SEK 31m compared with the
first nine months of 2012.The decrease was mainly
because the Folksam LO funds are managed by
Swedbank Robur since the fourth quarter 2012.

Payment operations
Swedbank is the leader in payment and cash
management products in its four home markets. Growth
in the payment area is based on economic growth and
on customers’ increasing use of payment means other
than cash.
The payment area is strongly affected by changes in the
operating environment. Rapid technological
development is increasing competition primarily from ecommerce companies at the same time that unified
European legislation facilitates cross-border trade in
products and services. The development of a common
payment zone for the euro enables the bank to offer
services to customers with eurozone operations without
having to set up business in every country.
Online payment services are an important growth area
for Swedbank. Today over 2.9 million customers in
Sweden and 2.1 million in the Baltic countries have
access to payment services through the Internet Bank
and the Mobile Bank. During the first nine months of
2013 the number of internet banking transactions grew
by 8 per cent year-on-year.
In Sweden, Swedbank introduced mobile BankID in
autumn 2012 to facilitate payments through the Internet
Bank and the Mobile Bank. The number of users is over
570 000. Swish, a solution shared with other Swedish
banks to send and receive money by mobile phone, has
over 540 000 users, more than 200 000 of which are
customers of Swedbank and the savings banks.
When doing business abroad, companies face very
different risks than at home. Trade Finance gives
importers and exporters the opportunity to mitigate
financial risk and improve liquidity in markets where
normal means of payment do not work. This area of
business is shrinking as these markets mature. The
principal products are cash against documents (CAD),
letters of credit and bank guarantees. Customers
increasingly demand customised solutions and new
ways to improve liquidity. In times of crisis demand
tends to grow for Trade Finance products. It also
increases when companies enter new markets. One
challenge to the bank’s Trade Finance offering is the
new payment and financing solutions arranged between
importers and exporters (Open Account and Supply
Chain Finance), which in recent years have accounted
for a larger share of growing global trade.
Payments
Key figures
International payments (millions)
of which Sweden
of which Baltic countries
Domestic payments (millions)
of which Sweden
of which Baltic countries
E-services payments (millions)
of which Sweden
of which Baltic countries
Trade Finance, new deals
of which Sweden
of which Baltic countries
Factoring portfolio, SEKm
of which Sweden
of which Baltic countries

Jan-Sep Jan-Sep
2013
2012
7.4
3.3
4.1
639.7
461.1
178.6
133.0
116.4
16.6
16 329
6 877
9 452
4 227
2 201
2 026

%

6.8
3.1
3.7
605.5
439.3
166.3
81.4
66.7
14.7
17 479
7 483
9 996
3 996
2 207
1 789

9
6
11
6
5
7
63
75
13
-7
-8
-5
6
0
13

Domestic payments include salary and mass payments, giro payments, direct
debit payments, internet payments.
E-services payments includes E-invoices, Bank link payments, Mobile phone
top-up transactions, number of signing-transactions and ID-transactions
through E-ID/BankID.

Since Bankomat AB took over responsibility for
Swedbank’s ATMs, Swedbank pays Bankomat AB a
commission, which explains the lower net commission
income. For more information, see Retail on page 12.
Payments
Income, SEKm
Net commission income
of which Nordic countries
of which Baltic countries

Jan-Sep Jan-Sep
2013
2012
737
367
370

Swedbank – Interim report January-September 2013

867
514
352

%
-15
-29
5

Page 23 of 57

Lending/deposits
Swedbank’s lending operations are concentrated in
Sweden, Estonia, Latvia and Lithuania. In addition,
lending is provided in Norway and to a lesser extent in
certain other countries such as Finland, Denmark and
the US. Loan products account for about 70 per cent of
Swedbank’s assets on the balance sheet.
Swedbank’s total private and corporate lending amounts
to SEK 1 195bn (1 184 as of 31 December 2012). The
large part consists of household lending, with mortgages
to Swedish private customers and tenant-owner
associations accounting for about 50 per cent of the
total. Swedbank’s market share for Swedish mortgages
is 25 per cent. Over one million customers obtain their
mortgages through Swedbank Mortgage, and lending is
geographically distributed throughout the country.
Swedbank is also a major player in corporate lending in
Sweden, with lending of SEK 428bn and a market share
of 17 per cent. Major sectors in Sweden include
property-related lending, which accounts for SEK
158bn, and the forestry and agricultural sector, where
Swedbank has a dominant position, accounting for SEK
68bn. Swedbank is the largest lender in the Baltic
countries, with market shares of 20-40 per cent. Estonia
accounts for nearly half of Swedbank’s Baltic loan
portfolio, and there Swedbank has a market share of
nearly 40 per cent. Total lending in the Baltic countries
amounts to SEK 117bn, half of which is to households
and half to corporates. Major sectors for corporate
lending in the Baltic countries include commercial real
estate and manufacturing.
Swedbank is also a dominant player in deposits in its
home markets. Total deposit volume as of 30
September amounted to SEK 592bn (558), of which
SEK 335bn (332) was to private customers and SEK
257bn (226) to corporate customers. About 81 per cent
of Swedbank’s total deposit volume was in its Swedish
operations.
For more information on Swedbank’s lending and
deposit, see each business area.
Financial information - contents
Group

Page

Income statement, condensed

26

Statement of comprehensive income, condensed

27

Key ratios

27

Balance sheet, condensed

28

Statement of changes in equity, condensed

29

Cash flow statement, condensed

30

Notes
Note 1 Accounting policies

30

Note 2 Critical accounting estimates

32

Note 3 Changes in the Group structure

32

Note 4 Operating segments (business areas)

33

Note 5 Net interest income

35

Note 6 Net commissions

36

Note 7 Net gains and losses on financial items at fair value

37

Note 8 Other expenses

38

Note 9 Credit impairments

38

Note 10 Loans

39

Note 11 Impaired loans etc.

40

Note 12 Assets taken over for protection of claims and cancelled leases

40

Note 13 Credit exposures

40

Note 14 Intangible assets

41

Note 15 Amounts owed to credit institutions

42

Note 16 Deposits from the public

42

Note 17 Debt securities in issue

42

Note 18 Derivatives

43

Note 19 Financial instruments carried at fair value

43

Note 20 Pledged collateral

46

Note 21 Offsetting financial assets and liabilities

46

Note 22 Capital adequacy

47

Note 23 Risks and uncertainties

49

Note 24 Discontinued operations

49

Note 25 Related-party transactions

49

Note 26 Swedbank’s share

50

Note 27 Effects of changes in accounting policies

51

Parent company
Income statement, condensed

53

Statement of comprehensive income, condensed

53

Balance sheet, condensed

54

Statement of changes in equity, condensed

55

Cash flow statement, condensed

55

Capital adequacy

56

More detailed information can be found in Swedbank’s fact book, www.swedbank/se/ir, under Financial information and
publications.
Swedbank – Interim report January-September 2013

Page 24 of 57
Income statement, condensed
Group
SEKm

Q3
2013

Q2
2013

%

Q3
2012

%

Interest income
Interest expenses
Net interest income (note 5)

10 867
-5 226
5 641

11 113
-5 704
5 409

-2
-8
4

12 443
-7 358
5 085

-13
-29
11

33 049
-16 646
16 403

38 765
-23 750
15 015

-15
-30
9

Commission income
Commission expenses
Net commissions (note 6)

3 683
-1 163
2 520

3 632
-1 107
2 525

1
5
0

3 344
-969
2 375

10
20
6

10 735
-3 302
7 433

10 060
-2 948
7 112

7
12
5

170

296

-43

687

-75

1 023

2 243

-54

376
-247
129

419
-275
144

-10
-10
-10

380
-233
147

-1
6
-12

1 293
-827
466

1 308
-840
468

-1
-2
0

Share of profit or loss of associates
Other income
Total income

240
525
9 225

197
408
8 979

22
29
3

225
452
8 971

7
16
3

643
1 318
27 286

644
1 349
26 831

0
-2
2

Staff costs
Other expenses (note 8)
Depreciation/amortisation
Total expenses
Profit before impairments

2 328
1 488
179
3 995
5 230

2 391
1 567
168
4 126
4 853

-3
-5
7
-3
8

2 229
1 490
201
3 920
5 051

4
0
-11
2
4

7 077
4 569
518
12 164
15 122

6 974
4 801
643
12 418
14 413

1
-5
-19
-2
5

0
95

170
202

-53

-1
102

-7

170
382

3
266

44

-56
5 191

88
4 393

18

36
4 914

6

92
14 478

-109
14 253

2

998

913

9

1 216

-18

2 887

3 371

-14
7

Net gains and losses on financial items at fair value (note 7)
Insurance premiums
Insurance provisions
Net insurance

Impairment of intangible assets (note 14)
Impairment of tangible assets
Credit impairments (note 9)
Operating profit
Tax expense
Profit for the period from continuing operations

Jan-Sep Jan-Sep
2013
2012

%

4 193

3 480

20

3 698

13

11 591

10 882

-15

-1 887

-99

-203

-93

-2 292

-823

Profit for the period
Profit for the period attributable to the
shareholders of Swedbank AB
of which profit for the period from continuing operations
of which profit for the period from discontinued operations

4 178

1 593

3 495

20

9 299

10 059

-8

4 172
4 187
-15

1 592
3 478
-1 886

3 495
3 695
-200

19
13
-93

9 289
11 581
-2 292

10 052
10 872
-820

-8
7

Non-controlling interests
of which profit for the period from continuing operations
of which profit for the period from discontinued operations

6
6
0

1
2
-1

0
3
-3

100

10
10
0

7
10
-3

43
0

Profit for the period from discontinued operations, after tax

Swedbank – Interim report January-September 2013

Page 25 of 57

20
-99
Swedbank's Interim Report Q3 2013

More Related Content

What's hot

Italian NPL (no performing loans) market
Italian NPL (no performing loans) marketItalian NPL (no performing loans) market
Italian NPL (no performing loans) marketRoberto Di Domenico
 
CEO presentation of Q2 2008 results
CEO presentation of Q2 2008 resultsCEO presentation of Q2 2008 results
CEO presentation of Q2 2008 resultsSwedbank
 
Roadshow, London, Mikael Inglander CFO
Roadshow, London, Mikael Inglander CFORoadshow, London, Mikael Inglander CFO
Roadshow, London, Mikael Inglander CFOSwedbank
 
Roadshow, Paris, Mikael Inglander
Roadshow, Paris, Mikael InglanderRoadshow, Paris, Mikael Inglander
Roadshow, Paris, Mikael InglanderSwedbank
 
Roadshow, Abu Dhabi
Roadshow, Abu DhabiRoadshow, Abu Dhabi
Roadshow, Abu DhabiSwedbank
 
Speech Reto Francioni AGM 2013 Final
Speech Reto Francioni AGM 2013 FinalSpeech Reto Francioni AGM 2013 Final
Speech Reto Francioni AGM 2013 FinalDeutsche Börse AG
 
2010 Investors' Meeting Presentation - São Paulo
2010 Investors' Meeting Presentation - São Paulo2010 Investors' Meeting Presentation - São Paulo
2010 Investors' Meeting Presentation - São PauloKianne Paganini
 
Roadshow, Lehman Brothers Global Financial Services Conference
Roadshow, Lehman Brothers Global Financial Services ConferenceRoadshow, Lehman Brothers Global Financial Services Conference
Roadshow, Lehman Brothers Global Financial Services ConferenceSwedbank
 
Roadshow, London, Jan Liden, CEO and Mikael Inglander, CFO
Roadshow, London, Jan Liden, CEO and Mikael Inglander, CFORoadshow, London, Jan Liden, CEO and Mikael Inglander, CFO
Roadshow, London, Jan Liden, CEO and Mikael Inglander, CFOSwedbank
 
Roadshow, UBS Nordic Banking Conference Jan Lidén
	Roadshow, UBS Nordic Banking Conference Jan Lidén	Roadshow, UBS Nordic Banking Conference Jan Lidén
Roadshow, UBS Nordic Banking Conference Jan LidénSwedbank
 
The Deloitte M&A Index 2016
The Deloitte M&A Index 2016The Deloitte M&A Index 2016
The Deloitte M&A Index 2016Deloitte UK
 
Roadshow, Frankfurt, Johannes Rudbeck
Roadshow, Frankfurt, Johannes RudbeckRoadshow, Frankfurt, Johannes Rudbeck
Roadshow, Frankfurt, Johannes RudbeckSwedbank
 
Prečo podnikať na Sk.pptx
Prečo podnikať na Sk.pptxPrečo podnikať na Sk.pptx
Prečo podnikať na Sk.pptxAndrejHrmo
 
Transcript conference call Q4 2009
Transcript conference call Q4 2009Transcript conference call Q4 2009
Transcript conference call Q4 2009Swedbank
 
Year end report 2015
Year end report 2015Year end report 2015
Year end report 2015Swedbank
 
SEB's third-quarter 2013 results presentation
SEB's third-quarter 2013 results presentationSEB's third-quarter 2013 results presentation
SEB's third-quarter 2013 results presentationSEBgroup
 
L'analyse de Standard & Poor's
L'analyse de Standard & Poor'sL'analyse de Standard & Poor's
L'analyse de Standard & Poor'sCédric Petit
 
SEB fourth-quarter 2013 results presentation
SEB fourth-quarter 2013 results presentationSEB fourth-quarter 2013 results presentation
SEB fourth-quarter 2013 results presentationSEBgroup
 
Roadshow Netherlands
Roadshow NetherlandsRoadshow Netherlands
Roadshow NetherlandsSwedbank
 

What's hot (20)

Italian NPL (no performing loans) market
Italian NPL (no performing loans) marketItalian NPL (no performing loans) market
Italian NPL (no performing loans) market
 
CEO presentation of Q2 2008 results
CEO presentation of Q2 2008 resultsCEO presentation of Q2 2008 results
CEO presentation of Q2 2008 results
 
Roadshow, London, Mikael Inglander CFO
Roadshow, London, Mikael Inglander CFORoadshow, London, Mikael Inglander CFO
Roadshow, London, Mikael Inglander CFO
 
Roadshow, Paris, Mikael Inglander
Roadshow, Paris, Mikael InglanderRoadshow, Paris, Mikael Inglander
Roadshow, Paris, Mikael Inglander
 
Roadshow, Abu Dhabi
Roadshow, Abu DhabiRoadshow, Abu Dhabi
Roadshow, Abu Dhabi
 
Speech Reto Francioni AGM 2013 Final
Speech Reto Francioni AGM 2013 FinalSpeech Reto Francioni AGM 2013 Final
Speech Reto Francioni AGM 2013 Final
 
2010 Investors' Meeting Presentation - São Paulo
2010 Investors' Meeting Presentation - São Paulo2010 Investors' Meeting Presentation - São Paulo
2010 Investors' Meeting Presentation - São Paulo
 
Roadshow, Lehman Brothers Global Financial Services Conference
Roadshow, Lehman Brothers Global Financial Services ConferenceRoadshow, Lehman Brothers Global Financial Services Conference
Roadshow, Lehman Brothers Global Financial Services Conference
 
Serbian Debt Market
Serbian Debt MarketSerbian Debt Market
Serbian Debt Market
 
Roadshow, London, Jan Liden, CEO and Mikael Inglander, CFO
Roadshow, London, Jan Liden, CEO and Mikael Inglander, CFORoadshow, London, Jan Liden, CEO and Mikael Inglander, CFO
Roadshow, London, Jan Liden, CEO and Mikael Inglander, CFO
 
Roadshow, UBS Nordic Banking Conference Jan Lidén
	Roadshow, UBS Nordic Banking Conference Jan Lidén	Roadshow, UBS Nordic Banking Conference Jan Lidén
Roadshow, UBS Nordic Banking Conference Jan Lidén
 
The Deloitte M&A Index 2016
The Deloitte M&A Index 2016The Deloitte M&A Index 2016
The Deloitte M&A Index 2016
 
Roadshow, Frankfurt, Johannes Rudbeck
Roadshow, Frankfurt, Johannes RudbeckRoadshow, Frankfurt, Johannes Rudbeck
Roadshow, Frankfurt, Johannes Rudbeck
 
Prečo podnikať na Sk.pptx
Prečo podnikať na Sk.pptxPrečo podnikať na Sk.pptx
Prečo podnikať na Sk.pptx
 
Transcript conference call Q4 2009
Transcript conference call Q4 2009Transcript conference call Q4 2009
Transcript conference call Q4 2009
 
Year end report 2015
Year end report 2015Year end report 2015
Year end report 2015
 
SEB's third-quarter 2013 results presentation
SEB's third-quarter 2013 results presentationSEB's third-quarter 2013 results presentation
SEB's third-quarter 2013 results presentation
 
L'analyse de Standard & Poor's
L'analyse de Standard & Poor'sL'analyse de Standard & Poor's
L'analyse de Standard & Poor's
 
SEB fourth-quarter 2013 results presentation
SEB fourth-quarter 2013 results presentationSEB fourth-quarter 2013 results presentation
SEB fourth-quarter 2013 results presentation
 
Roadshow Netherlands
Roadshow NetherlandsRoadshow Netherlands
Roadshow Netherlands
 

Viewers also liked

Energy & Commodities, No. 5 - May 11, 2012
Energy & Commodities, No. 5 - May 11, 2012Energy & Commodities, No. 5 - May 11, 2012
Energy & Commodities, No. 5 - May 11, 2012Swedbank
 
Swedbank företagspresentation, juni 2010
Swedbank företagspresentation, juni 2010Swedbank företagspresentation, juni 2010
Swedbank företagspresentation, juni 2010Swedbank
 
Swedbank Baltic Sea Analysis No. 30
Swedbank Baltic Sea Analysis No. 30Swedbank Baltic Sea Analysis No. 30
Swedbank Baltic Sea Analysis No. 30Swedbank
 
Emerging markets outlook, October 2013
Emerging markets outlook, October 2013Emerging markets outlook, October 2013
Emerging markets outlook, October 2013Swedbank
 
The Global Economy No. 9 - December 20, 2011
The Global Economy No. 9 -  December 20, 2011The Global Economy No. 9 -  December 20, 2011
The Global Economy No. 9 - December 20, 2011Swedbank
 
The Lithuanian Economy - No 9, December 2, 2011
The Lithuanian Economy - No 9, December 2,  2011The Lithuanian Economy - No 9, December 2,  2011
The Lithuanian Economy - No 9, December 2, 2011Swedbank
 
Swedbank Corporate Presentation Q1 2012
Swedbank Corporate Presentation Q1 2012Swedbank Corporate Presentation Q1 2012
Swedbank Corporate Presentation Q1 2012Swedbank
 
Swedbanks Delårsrapport kv3 2013
Swedbanks Delårsrapport kv3 2013Swedbanks Delårsrapport kv3 2013
Swedbanks Delårsrapport kv3 2013Swedbank
 

Viewers also liked (8)

Energy & Commodities, No. 5 - May 11, 2012
Energy & Commodities, No. 5 - May 11, 2012Energy & Commodities, No. 5 - May 11, 2012
Energy & Commodities, No. 5 - May 11, 2012
 
Swedbank företagspresentation, juni 2010
Swedbank företagspresentation, juni 2010Swedbank företagspresentation, juni 2010
Swedbank företagspresentation, juni 2010
 
Swedbank Baltic Sea Analysis No. 30
Swedbank Baltic Sea Analysis No. 30Swedbank Baltic Sea Analysis No. 30
Swedbank Baltic Sea Analysis No. 30
 
Emerging markets outlook, October 2013
Emerging markets outlook, October 2013Emerging markets outlook, October 2013
Emerging markets outlook, October 2013
 
The Global Economy No. 9 - December 20, 2011
The Global Economy No. 9 -  December 20, 2011The Global Economy No. 9 -  December 20, 2011
The Global Economy No. 9 - December 20, 2011
 
The Lithuanian Economy - No 9, December 2, 2011
The Lithuanian Economy - No 9, December 2,  2011The Lithuanian Economy - No 9, December 2,  2011
The Lithuanian Economy - No 9, December 2, 2011
 
Swedbank Corporate Presentation Q1 2012
Swedbank Corporate Presentation Q1 2012Swedbank Corporate Presentation Q1 2012
Swedbank Corporate Presentation Q1 2012
 
Swedbanks Delårsrapport kv3 2013
Swedbanks Delårsrapport kv3 2013Swedbanks Delårsrapport kv3 2013
Swedbanks Delårsrapport kv3 2013
 

Similar to Swedbank's Interim Report Q3 2013

Swedbank Interim report third quarter 2015
Swedbank Interim report third quarter 2015Swedbank Interim report third quarter 2015
Swedbank Interim report third quarter 2015Swedbank
 
Interim report Q2 2015
Interim report Q2 2015Interim report Q2 2015
Interim report Q2 2015Swedbank
 
Swedbank's Year-End report 2014
Swedbank's Year-End report 2014Swedbank's Year-End report 2014
Swedbank's Year-End report 2014Swedbank
 
Interim report q1 2017
Interim report q1 2017Interim report q1 2017
Interim report q1 2017Swedbank
 
Year end report 2016
Year end report 2016Year end report 2016
Year end report 2016Swedbank
 
Swedbank's Interim report Q2 2014
Swedbank's Interim report Q2 2014Swedbank's Interim report Q2 2014
Swedbank's Interim report Q2 2014Swedbank
 
Danske bank interimreport q22013
Danske bank interimreport q22013Danske bank interimreport q22013
Danske bank interimreport q22013Frank Ragol
 
stikcredit presentation 1q23.pdf
stikcredit presentation 1q23.pdfstikcredit presentation 1q23.pdf
stikcredit presentation 1q23.pdfSvetlinSabev
 
Q2 2009 Transcript Tel conf
Q2 2009 Transcript Tel confQ2 2009 Transcript Tel conf
Q2 2009 Transcript Tel confSwedbank
 
Q3 2009 Telephone conference
Q3 2009 Telephone conferenceQ3 2009 Telephone conference
Q3 2009 Telephone conferenceSwedbank
 
Business Development Plan - BNPParibas
Business Development Plan - BNPParibasBusiness Development Plan - BNPParibas
Business Development Plan - BNPParibasCédric de Radzitzky
 
SEB's second-quarter 2013 results presentation
SEB's second-quarter 2013 results presentationSEB's second-quarter 2013 results presentation
SEB's second-quarter 2013 results presentationSEBgroup
 
SEB's fourth quarter 2015 financial results
SEB's fourth quarter 2015 financial resultsSEB's fourth quarter 2015 financial results
SEB's fourth quarter 2015 financial resultsSEBgroup
 
Klöckner & Co SE Annual Report 2013
Klöckner & Co SE Annual Report 2013Klöckner & Co SE Annual Report 2013
Klöckner & Co SE Annual Report 2013Klöckner & Co SE
 
Deutsche Börse Group Annual General Meeting 2014 Speech CEO Reto Francioni
Deutsche Börse Group Annual General Meeting 2014 Speech CEO Reto FrancioniDeutsche Börse Group Annual General Meeting 2014 Speech CEO Reto Francioni
Deutsche Börse Group Annual General Meeting 2014 Speech CEO Reto FrancioniDeutsche Börse AG
 
CEO presentation of Q1 2008 results
CEO presentation of Q1 2008 resultsCEO presentation of Q1 2008 results
CEO presentation of Q1 2008 resultsSwedbank
 
Aegon annual report 2015
Aegon annual report 2015Aegon annual report 2015
Aegon annual report 2015Aegon
 
Annual General Meeting José Antonio Álvarez speech
Annual General Meeting José Antonio Álvarez speechAnnual General Meeting José Antonio Álvarez speech
Annual General Meeting José Antonio Álvarez speechBANCO SANTANDER
 

Similar to Swedbank's Interim Report Q3 2013 (20)

Swedbank Interim report third quarter 2015
Swedbank Interim report third quarter 2015Swedbank Interim report third quarter 2015
Swedbank Interim report third quarter 2015
 
Interim report Q2 2015
Interim report Q2 2015Interim report Q2 2015
Interim report Q2 2015
 
Swedbank's Year-End report 2014
Swedbank's Year-End report 2014Swedbank's Year-End report 2014
Swedbank's Year-End report 2014
 
Interim report q1 2017
Interim report q1 2017Interim report q1 2017
Interim report q1 2017
 
Year end report 2016
Year end report 2016Year end report 2016
Year end report 2016
 
Swedbank's Interim report Q2 2014
Swedbank's Interim report Q2 2014Swedbank's Interim report Q2 2014
Swedbank's Interim report Q2 2014
 
Danske bank interimreport q22013
Danske bank interimreport q22013Danske bank interimreport q22013
Danske bank interimreport q22013
 
stikcredit presentation 1q23.pdf
stikcredit presentation 1q23.pdfstikcredit presentation 1q23.pdf
stikcredit presentation 1q23.pdf
 
Q2 2009 Transcript Tel conf
Q2 2009 Transcript Tel confQ2 2009 Transcript Tel conf
Q2 2009 Transcript Tel conf
 
Q3 2009 Telephone conference
Q3 2009 Telephone conferenceQ3 2009 Telephone conference
Q3 2009 Telephone conference
 
Business Development Plan - BNPParibas
Business Development Plan - BNPParibasBusiness Development Plan - BNPParibas
Business Development Plan - BNPParibas
 
The Lindorff European Credit Outlook 2015
The Lindorff European Credit Outlook 2015The Lindorff European Credit Outlook 2015
The Lindorff European Credit Outlook 2015
 
Leco 2015
Leco 2015Leco 2015
Leco 2015
 
SEB's second-quarter 2013 results presentation
SEB's second-quarter 2013 results presentationSEB's second-quarter 2013 results presentation
SEB's second-quarter 2013 results presentation
 
SEB's fourth quarter 2015 financial results
SEB's fourth quarter 2015 financial resultsSEB's fourth quarter 2015 financial results
SEB's fourth quarter 2015 financial results
 
Klöckner & Co SE Annual Report 2013
Klöckner & Co SE Annual Report 2013Klöckner & Co SE Annual Report 2013
Klöckner & Co SE Annual Report 2013
 
Deutsche Börse Group Annual General Meeting 2014 Speech CEO Reto Francioni
Deutsche Börse Group Annual General Meeting 2014 Speech CEO Reto FrancioniDeutsche Börse Group Annual General Meeting 2014 Speech CEO Reto Francioni
Deutsche Börse Group Annual General Meeting 2014 Speech CEO Reto Francioni
 
CEO presentation of Q1 2008 results
CEO presentation of Q1 2008 resultsCEO presentation of Q1 2008 results
CEO presentation of Q1 2008 results
 
Aegon annual report 2015
Aegon annual report 2015Aegon annual report 2015
Aegon annual report 2015
 
Annual General Meeting José Antonio Álvarez speech
Annual General Meeting José Antonio Álvarez speechAnnual General Meeting José Antonio Álvarez speech
Annual General Meeting José Antonio Álvarez speech
 

More from Swedbank

Swedbank corporate presentation April 25 2017
Swedbank corporate presentation April 25 2017Swedbank corporate presentation April 25 2017
Swedbank corporate presentation April 25 2017Swedbank
 
Swedbank foretagspresentation 25 april 2017
Swedbank foretagspresentation 25 april 2017Swedbank foretagspresentation 25 april 2017
Swedbank foretagspresentation 25 april 2017Swedbank
 
Delårsrapport kv1 2017
Delårsrapport kv1 2017Delårsrapport kv1 2017
Delårsrapport kv1 2017Swedbank
 
Bokslutskommuniké 2016
Bokslutskommuniké 2016Bokslutskommuniké 2016
Bokslutskommuniké 2016Swedbank
 
Swedbank företagspresentation, 2 februari 2017
Swedbank företagspresentation, 2 februari 2017Swedbank företagspresentation, 2 februari 2017
Swedbank företagspresentation, 2 februari 2017Swedbank
 
Swedbank corporate presentation, February 2 2017
Swedbank corporate presentation, February 2 2017Swedbank corporate presentation, February 2 2017
Swedbank corporate presentation, February 2 2017Swedbank
 
Swedbank Corporate Presentation, October 25 2016
Swedbank Corporate Presentation, October 25 2016Swedbank Corporate Presentation, October 25 2016
Swedbank Corporate Presentation, October 25 2016Swedbank
 
Swedbank företagspresentation, 25 oktober 2016
Swedbank företagspresentation, 25 oktober 2016Swedbank företagspresentation, 25 oktober 2016
Swedbank företagspresentation, 25 oktober 2016Swedbank
 
Swedbank Corporate Presentation, June 30 2016
Swedbank Corporate Presentation, June 30 2016Swedbank Corporate Presentation, June 30 2016
Swedbank Corporate Presentation, June 30 2016Swedbank
 
Swedbank företagspresentation, 30 juni 2016
Swedbank företagspresentation, 30 juni 2016Swedbank företagspresentation, 30 juni 2016
Swedbank företagspresentation, 30 juni 2016Swedbank
 
Swedbank corporate presentation Q1, 2016
Swedbank corporate presentation Q1, 2016Swedbank corporate presentation Q1, 2016
Swedbank corporate presentation Q1, 2016Swedbank
 
Swedbank företagspresentation kvartal 1, 2016.
Swedbank företagspresentation kvartal 1, 2016.Swedbank företagspresentation kvartal 1, 2016.
Swedbank företagspresentation kvartal 1, 2016.Swedbank
 
Swedbank corporate presentation Q4, 2015
Swedbank corporate presentation Q4, 2015Swedbank corporate presentation Q4, 2015
Swedbank corporate presentation Q4, 2015Swedbank
 
Swedbank företagspresentation kvartal 4,2015
Swedbank företagspresentation kvartal 4,2015Swedbank företagspresentation kvartal 4,2015
Swedbank företagspresentation kvartal 4,2015Swedbank
 
Bokslutskommuniké 2015
Bokslutskommuniké 2015Bokslutskommuniké 2015
Bokslutskommuniké 2015Swedbank
 
Swedbank Företagspresentation, September 2015
Swedbank Företagspresentation, September 2015Swedbank Företagspresentation, September 2015
Swedbank Företagspresentation, September 2015Swedbank
 
Swedbank Corporate Presentation, September 2015
Swedbank Corporate Presentation, September 2015Swedbank Corporate Presentation, September 2015
Swedbank Corporate Presentation, September 2015Swedbank
 
Swedbank's third quarter 2015 results
Swedbank's third quarter 2015 resultsSwedbank's third quarter 2015 results
Swedbank's third quarter 2015 resultsSwedbank
 
Swedbank delårsrapport tredje kvartalet 2015
Swedbank delårsrapport tredje kvartalet 2015Swedbank delårsrapport tredje kvartalet 2015
Swedbank delårsrapport tredje kvartalet 2015Swedbank
 
Kvartalsrapport andra kvartalet 2015
Kvartalsrapport andra kvartalet 2015Kvartalsrapport andra kvartalet 2015
Kvartalsrapport andra kvartalet 2015Swedbank
 

More from Swedbank (20)

Swedbank corporate presentation April 25 2017
Swedbank corporate presentation April 25 2017Swedbank corporate presentation April 25 2017
Swedbank corporate presentation April 25 2017
 
Swedbank foretagspresentation 25 april 2017
Swedbank foretagspresentation 25 april 2017Swedbank foretagspresentation 25 april 2017
Swedbank foretagspresentation 25 april 2017
 
Delårsrapport kv1 2017
Delårsrapport kv1 2017Delårsrapport kv1 2017
Delårsrapport kv1 2017
 
Bokslutskommuniké 2016
Bokslutskommuniké 2016Bokslutskommuniké 2016
Bokslutskommuniké 2016
 
Swedbank företagspresentation, 2 februari 2017
Swedbank företagspresentation, 2 februari 2017Swedbank företagspresentation, 2 februari 2017
Swedbank företagspresentation, 2 februari 2017
 
Swedbank corporate presentation, February 2 2017
Swedbank corporate presentation, February 2 2017Swedbank corporate presentation, February 2 2017
Swedbank corporate presentation, February 2 2017
 
Swedbank Corporate Presentation, October 25 2016
Swedbank Corporate Presentation, October 25 2016Swedbank Corporate Presentation, October 25 2016
Swedbank Corporate Presentation, October 25 2016
 
Swedbank företagspresentation, 25 oktober 2016
Swedbank företagspresentation, 25 oktober 2016Swedbank företagspresentation, 25 oktober 2016
Swedbank företagspresentation, 25 oktober 2016
 
Swedbank Corporate Presentation, June 30 2016
Swedbank Corporate Presentation, June 30 2016Swedbank Corporate Presentation, June 30 2016
Swedbank Corporate Presentation, June 30 2016
 
Swedbank företagspresentation, 30 juni 2016
Swedbank företagspresentation, 30 juni 2016Swedbank företagspresentation, 30 juni 2016
Swedbank företagspresentation, 30 juni 2016
 
Swedbank corporate presentation Q1, 2016
Swedbank corporate presentation Q1, 2016Swedbank corporate presentation Q1, 2016
Swedbank corporate presentation Q1, 2016
 
Swedbank företagspresentation kvartal 1, 2016.
Swedbank företagspresentation kvartal 1, 2016.Swedbank företagspresentation kvartal 1, 2016.
Swedbank företagspresentation kvartal 1, 2016.
 
Swedbank corporate presentation Q4, 2015
Swedbank corporate presentation Q4, 2015Swedbank corporate presentation Q4, 2015
Swedbank corporate presentation Q4, 2015
 
Swedbank företagspresentation kvartal 4,2015
Swedbank företagspresentation kvartal 4,2015Swedbank företagspresentation kvartal 4,2015
Swedbank företagspresentation kvartal 4,2015
 
Bokslutskommuniké 2015
Bokslutskommuniké 2015Bokslutskommuniké 2015
Bokslutskommuniké 2015
 
Swedbank Företagspresentation, September 2015
Swedbank Företagspresentation, September 2015Swedbank Företagspresentation, September 2015
Swedbank Företagspresentation, September 2015
 
Swedbank Corporate Presentation, September 2015
Swedbank Corporate Presentation, September 2015Swedbank Corporate Presentation, September 2015
Swedbank Corporate Presentation, September 2015
 
Swedbank's third quarter 2015 results
Swedbank's third quarter 2015 resultsSwedbank's third quarter 2015 results
Swedbank's third quarter 2015 results
 
Swedbank delårsrapport tredje kvartalet 2015
Swedbank delårsrapport tredje kvartalet 2015Swedbank delårsrapport tredje kvartalet 2015
Swedbank delårsrapport tredje kvartalet 2015
 
Kvartalsrapport andra kvartalet 2015
Kvartalsrapport andra kvartalet 2015Kvartalsrapport andra kvartalet 2015
Kvartalsrapport andra kvartalet 2015
 

Recently uploaded

Attachment Of Assets......................
Attachment Of Assets......................Attachment Of Assets......................
Attachment Of Assets......................AmanBajaj36
 
Financial institutions facilitate financing, economic transactions, issue fun...
Financial institutions facilitate financing, economic transactions, issue fun...Financial institutions facilitate financing, economic transactions, issue fun...
Financial institutions facilitate financing, economic transactions, issue fun...Avanish Goel
 
BPPG response - Options for Defined Benefit schemes - 19Apr24.pdf
BPPG response - Options for Defined Benefit schemes - 19Apr24.pdfBPPG response - Options for Defined Benefit schemes - 19Apr24.pdf
BPPG response - Options for Defined Benefit schemes - 19Apr24.pdfHenry Tapper
 
Classical Theory of Macroeconomics by Adam Smith
Classical Theory of Macroeconomics by Adam SmithClassical Theory of Macroeconomics by Adam Smith
Classical Theory of Macroeconomics by Adam SmithAdamYassin2
 
Quantitative Analysis of Retail Sector Companies
Quantitative Analysis of Retail Sector CompaniesQuantitative Analysis of Retail Sector Companies
Quantitative Analysis of Retail Sector Companiesprashantbhati354
 
Authentic No 1 Amil Baba In Pakistan Authentic No 1 Amil Baba In Karachi No 1...
Authentic No 1 Amil Baba In Pakistan Authentic No 1 Amil Baba In Karachi No 1...Authentic No 1 Amil Baba In Pakistan Authentic No 1 Amil Baba In Karachi No 1...
Authentic No 1 Amil Baba In Pakistan Authentic No 1 Amil Baba In Karachi No 1...First NO1 World Amil baba in Faisalabad
 
Interimreport1 January–31 March2024 Elo Mutual Pension Insurance Company
Interimreport1 January–31 March2024 Elo Mutual Pension Insurance CompanyInterimreport1 January–31 March2024 Elo Mutual Pension Insurance Company
Interimreport1 January–31 March2024 Elo Mutual Pension Insurance CompanyTyöeläkeyhtiö Elo
 
Instant Issue Debit Cards - School Designs
Instant Issue Debit Cards - School DesignsInstant Issue Debit Cards - School Designs
Instant Issue Debit Cards - School Designsegoetzinger
 
High Class Call Girls Nagpur Grishma Call 7001035870 Meet With Nagpur Escorts
High Class Call Girls Nagpur Grishma Call 7001035870 Meet With Nagpur EscortsHigh Class Call Girls Nagpur Grishma Call 7001035870 Meet With Nagpur Escorts
High Class Call Girls Nagpur Grishma Call 7001035870 Meet With Nagpur Escortsranjana rawat
 
Bladex Earnings Call Presentation 1Q2024
Bladex Earnings Call Presentation 1Q2024Bladex Earnings Call Presentation 1Q2024
Bladex Earnings Call Presentation 1Q2024Bladex
 
Q3 2024 Earnings Conference Call and Webcast Slides
Q3 2024 Earnings Conference Call and Webcast SlidesQ3 2024 Earnings Conference Call and Webcast Slides
Q3 2024 Earnings Conference Call and Webcast SlidesMarketing847413
 
Andheri Call Girls In 9825968104 Mumbai Hot Models
Andheri Call Girls In 9825968104 Mumbai Hot ModelsAndheri Call Girls In 9825968104 Mumbai Hot Models
Andheri Call Girls In 9825968104 Mumbai Hot Modelshematsharma006
 
Instant Issue Debit Cards - High School Spirit
Instant Issue Debit Cards - High School SpiritInstant Issue Debit Cards - High School Spirit
Instant Issue Debit Cards - High School Spiritegoetzinger
 
(DIYA) Bhumkar Chowk Call Girls Just Call 7001035870 [ Cash on Delivery ] Pun...
(DIYA) Bhumkar Chowk Call Girls Just Call 7001035870 [ Cash on Delivery ] Pun...(DIYA) Bhumkar Chowk Call Girls Just Call 7001035870 [ Cash on Delivery ] Pun...
(DIYA) Bhumkar Chowk Call Girls Just Call 7001035870 [ Cash on Delivery ] Pun...ranjana rawat
 
Malad Call Girl in Services 9892124323 | ₹,4500 With Room Free Delivery
Malad Call Girl in Services  9892124323 | ₹,4500 With Room Free DeliveryMalad Call Girl in Services  9892124323 | ₹,4500 With Room Free Delivery
Malad Call Girl in Services 9892124323 | ₹,4500 With Room Free DeliveryPooja Nehwal
 
VIP High Class Call Girls Saharanpur Anushka 8250192130 Independent Escort Se...
VIP High Class Call Girls Saharanpur Anushka 8250192130 Independent Escort Se...VIP High Class Call Girls Saharanpur Anushka 8250192130 Independent Escort Se...
VIP High Class Call Girls Saharanpur Anushka 8250192130 Independent Escort Se...Suhani Kapoor
 
letter-from-the-chair-to-the-fca-relating-to-british-steel-pensions-scheme-15...
letter-from-the-chair-to-the-fca-relating-to-british-steel-pensions-scheme-15...letter-from-the-chair-to-the-fca-relating-to-british-steel-pensions-scheme-15...
letter-from-the-chair-to-the-fca-relating-to-british-steel-pensions-scheme-15...Henry Tapper
 
VIP Call Girls Service Begumpet Hyderabad Call +91-8250192130
VIP Call Girls Service Begumpet Hyderabad Call +91-8250192130VIP Call Girls Service Begumpet Hyderabad Call +91-8250192130
VIP Call Girls Service Begumpet Hyderabad Call +91-8250192130Suhani Kapoor
 
VIP Kolkata Call Girl Jodhpur Park 👉 8250192130 Available With Room
VIP Kolkata Call Girl Jodhpur Park 👉 8250192130  Available With RoomVIP Kolkata Call Girl Jodhpur Park 👉 8250192130  Available With Room
VIP Kolkata Call Girl Jodhpur Park 👉 8250192130 Available With Roomdivyansh0kumar0
 

Recently uploaded (20)

Attachment Of Assets......................
Attachment Of Assets......................Attachment Of Assets......................
Attachment Of Assets......................
 
Financial institutions facilitate financing, economic transactions, issue fun...
Financial institutions facilitate financing, economic transactions, issue fun...Financial institutions facilitate financing, economic transactions, issue fun...
Financial institutions facilitate financing, economic transactions, issue fun...
 
BPPG response - Options for Defined Benefit schemes - 19Apr24.pdf
BPPG response - Options for Defined Benefit schemes - 19Apr24.pdfBPPG response - Options for Defined Benefit schemes - 19Apr24.pdf
BPPG response - Options for Defined Benefit schemes - 19Apr24.pdf
 
Classical Theory of Macroeconomics by Adam Smith
Classical Theory of Macroeconomics by Adam SmithClassical Theory of Macroeconomics by Adam Smith
Classical Theory of Macroeconomics by Adam Smith
 
Quantitative Analysis of Retail Sector Companies
Quantitative Analysis of Retail Sector CompaniesQuantitative Analysis of Retail Sector Companies
Quantitative Analysis of Retail Sector Companies
 
Authentic No 1 Amil Baba In Pakistan Authentic No 1 Amil Baba In Karachi No 1...
Authentic No 1 Amil Baba In Pakistan Authentic No 1 Amil Baba In Karachi No 1...Authentic No 1 Amil Baba In Pakistan Authentic No 1 Amil Baba In Karachi No 1...
Authentic No 1 Amil Baba In Pakistan Authentic No 1 Amil Baba In Karachi No 1...
 
Interimreport1 January–31 March2024 Elo Mutual Pension Insurance Company
Interimreport1 January–31 March2024 Elo Mutual Pension Insurance CompanyInterimreport1 January–31 March2024 Elo Mutual Pension Insurance Company
Interimreport1 January–31 March2024 Elo Mutual Pension Insurance Company
 
Instant Issue Debit Cards - School Designs
Instant Issue Debit Cards - School DesignsInstant Issue Debit Cards - School Designs
Instant Issue Debit Cards - School Designs
 
High Class Call Girls Nagpur Grishma Call 7001035870 Meet With Nagpur Escorts
High Class Call Girls Nagpur Grishma Call 7001035870 Meet With Nagpur EscortsHigh Class Call Girls Nagpur Grishma Call 7001035870 Meet With Nagpur Escorts
High Class Call Girls Nagpur Grishma Call 7001035870 Meet With Nagpur Escorts
 
Bladex Earnings Call Presentation 1Q2024
Bladex Earnings Call Presentation 1Q2024Bladex Earnings Call Presentation 1Q2024
Bladex Earnings Call Presentation 1Q2024
 
Q3 2024 Earnings Conference Call and Webcast Slides
Q3 2024 Earnings Conference Call and Webcast SlidesQ3 2024 Earnings Conference Call and Webcast Slides
Q3 2024 Earnings Conference Call and Webcast Slides
 
Andheri Call Girls In 9825968104 Mumbai Hot Models
Andheri Call Girls In 9825968104 Mumbai Hot ModelsAndheri Call Girls In 9825968104 Mumbai Hot Models
Andheri Call Girls In 9825968104 Mumbai Hot Models
 
Instant Issue Debit Cards - High School Spirit
Instant Issue Debit Cards - High School SpiritInstant Issue Debit Cards - High School Spirit
Instant Issue Debit Cards - High School Spirit
 
Commercial Bank Economic Capsule - April 2024
Commercial Bank Economic Capsule - April 2024Commercial Bank Economic Capsule - April 2024
Commercial Bank Economic Capsule - April 2024
 
(DIYA) Bhumkar Chowk Call Girls Just Call 7001035870 [ Cash on Delivery ] Pun...
(DIYA) Bhumkar Chowk Call Girls Just Call 7001035870 [ Cash on Delivery ] Pun...(DIYA) Bhumkar Chowk Call Girls Just Call 7001035870 [ Cash on Delivery ] Pun...
(DIYA) Bhumkar Chowk Call Girls Just Call 7001035870 [ Cash on Delivery ] Pun...
 
Malad Call Girl in Services 9892124323 | ₹,4500 With Room Free Delivery
Malad Call Girl in Services  9892124323 | ₹,4500 With Room Free DeliveryMalad Call Girl in Services  9892124323 | ₹,4500 With Room Free Delivery
Malad Call Girl in Services 9892124323 | ₹,4500 With Room Free Delivery
 
VIP High Class Call Girls Saharanpur Anushka 8250192130 Independent Escort Se...
VIP High Class Call Girls Saharanpur Anushka 8250192130 Independent Escort Se...VIP High Class Call Girls Saharanpur Anushka 8250192130 Independent Escort Se...
VIP High Class Call Girls Saharanpur Anushka 8250192130 Independent Escort Se...
 
letter-from-the-chair-to-the-fca-relating-to-british-steel-pensions-scheme-15...
letter-from-the-chair-to-the-fca-relating-to-british-steel-pensions-scheme-15...letter-from-the-chair-to-the-fca-relating-to-british-steel-pensions-scheme-15...
letter-from-the-chair-to-the-fca-relating-to-british-steel-pensions-scheme-15...
 
VIP Call Girls Service Begumpet Hyderabad Call +91-8250192130
VIP Call Girls Service Begumpet Hyderabad Call +91-8250192130VIP Call Girls Service Begumpet Hyderabad Call +91-8250192130
VIP Call Girls Service Begumpet Hyderabad Call +91-8250192130
 
VIP Kolkata Call Girl Jodhpur Park 👉 8250192130 Available With Room
VIP Kolkata Call Girl Jodhpur Park 👉 8250192130  Available With RoomVIP Kolkata Call Girl Jodhpur Park 👉 8250192130  Available With Room
VIP Kolkata Call Girl Jodhpur Park 👉 8250192130 Available With Room
 

Swedbank's Interim Report Q3 2013

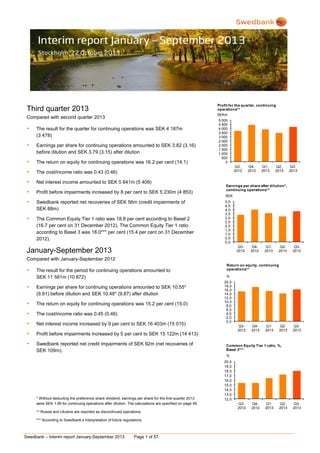
  • 1. Profit for the quarter, continuing operations** SEKm Third quarter 2013 Compared with second quarter 2013  The result for the quarter for continuing operations was SEK 4 187m (3 478)  Earnings per share for continuing operations amounted to SEK 3.82 (3.16) before dilution and SEK 3.79 (3.15) after dilution  The return on equity for continuing operations was 16.2 per cent (14.1)  The cost/income ratio was 0.43 (0.46)  Net interest income amounted to SEK 5 641m (5 409)  Profit before impairments increased by 8 per cent to SEK 5 230m (4 853)  Swedbank reported net recoveries of SEK 56m (credit impairments of SEK 88m)  The Common Equity Tier 1 ratio was 18.8 per cent according to Basel 2 (16.7 per cent on 31 December 2012). The Common Equity Tier 1 ratio according to Basel 3 was 18.0*** per cent (15.4 per cent on 31 December 2012). 5 000 4 500 4 000 3 500 3 000 2 500 2 000 1 500 1 000 500 0 Q32012 Q42012 Q12013 Q22013 Q32013 Earnings per share after dilution*, continuing operations** SEK 5,0 4,5 4,0 3,5 3,0 2,5 2,0 1,5 1,0 0,5 0,0 Q32012 January-September 2013 Q42012 Q12013 Q22013 Q32013 Compared with January-September 2012  The result for the period for continuing operations amounted to SEK 11 581m (10 872)  Earnings per share for continuing operations amounted to SEK 10.55* (9.91) before dilution and SEK 10.48* (9.87) after dilution  The return on equity for continuing operations was 15.2 per cent (15.0)  The cost/income ratio was 0.45 (0.46)  Net interest income increased by 9 per cent to SEK 16 403m (15 015)  Swedbank reported net credit impairments of SEK 92m (net recoveries of SEK 109m). % 20,0 18,0 16,0 14,0 12,0 10,0 8,0 6,0 4,0 2,0 0,0 Profit before impairments increased by 5 per cent to SEK 15 122m (14 413)  Return on equity, continuing operations** Q32012 Q42012 Q12013 Q22013 Q32013 Common Equity Tier 1 ratio, %, Basel 3*** % * Without deducting the preference share dividend, earnings per share for the first quarter 2013 were SEK 1.99 for continuing operations after dilution. The calculations are specified on page 49. ** Russia and Ukraine are reported as discontinued operations. *** According to Swedbank’s interpretation of future regulations. Swedbank – Interim report January-September 2013 Page 1 of 57 20,0 19,0 18,0 17,0 16,0 15,0 14,0 13,0 12,0 Q32012 Q42012 Q12013 Q22013 Q32013
  • 2. CEO Comment The global economy continued to show positive, though faint, signs during the third quarter. Optimism in the market has begun to take root. In our home markets, economic conditions remain stable. Going forward, however, development and credit demand will be affected by how well our operating environment recovers. Major structural challenges remain in many countries where government debts and budget deficits are creating imbalances. In Sweden, insufficient supply of housing has created a structural challenge that has caused upward pressure on household debt for an extended period of time. Continued stable results Swedbank is again reporting robust results. The return on equity for continuing operations was 16.2 per cent for the third quarter. Higher net interest income and solid cost efficiencies contributed positively. In the Swedish mortgage market, our new lending did well during the quarter. Mortgage margins vis-à-vis customers were lower, following the same pattern from the second quarter: stable for the mortgage portfolio as a whole, but with slightly lower margins on new lending. The result in our Baltic operations was positively affected by the repricing of the corporate portfolio that has begun. In the LC&I business area, our market position has improved for the customer groups we focus on. The result from equity and fixed income trading was weaker, however. The Group’s net commission income was stable with good activity in cards and funds. Credit quality remains good. Better preconditions for us to serve our customers The measures we are taking to adapt to gradually changing customer behaviour are continuing. Several areas deserve mention. One obvious example is how efficiency improvements during the third quarter have led to improved response times in our Swedish telephone bank. The use of digital channels is not only growing but it is also clear that customers prefer a totally new, more active way of banking. Mobile Bank users log in nearly twice as frequently as users of the Internet Bank. That does not include the over 15 million times every month that mobile phone users check an account balance by simply shaking their phone. We are also seeing a clear trend in the Baltic countries, where the number of cash transactions and payments in branches is declining significantly – for example, the number of manual cash transactions by tellers at our branches in Latvia has dropped by 25 per cent this year. As part of our measures to enhance the customer experience, we opened two pilot branches in Karlstad and Nässjö in September. With a more modern way of working and a new customer environment that includes video-based customer meetings, we can be wherever our customers want to meet us. We are giving individual advisors more opportunity to make decisions. Competence development and decentralised authority allow our employees to make the decisions necessary to satisfy each customer’s needs directly during the meeting. * According to Swedbank’s interpretation of future regulations. Swedbank – Interim report January-September 2013 Page 2 of 57 Openness and transparency In early October Swedbank won an award presented by NASDAQ OMX for best annual report in the category large companies. This is further recognition of our work to openly inform and build credibility among customers, shareholders and other stakeholders. It also spurs us on in our continued work. We face a significant challenge with respect to customer satisfaction in Sweden. This year’s Swedish Quality Index survey is discouraging reading for banks, including ourselves. We have a big job ahead of us, and the goal is crystal clear. We will raise customer satisfaction through improved business acumen and local decision-making, as well as digital and physical meeting places that meet customer needs. Increased capitalisation and regulation Our Common Equity Tier 1 ratio was further strengthened during the quarter to 18.0 per cent (Basel 3*). We are awaiting approval from the Swedish Financial Supervisory Authority to use an advanced model to calculate risk weights on Swedish corporate lending, which will further improve our capital ratios. In order to set a new internal capital target, we need a clear ruling from the authorities on future capital requirements for Swedish banks. Swedbank’s solid capitalisation was underscored by Standard & Poor's, which raised our credit rating outlook to stable during the third quarter. In addition to our strong balance sheet, S&P stressed our solid profitability. We welcome the increased regulation of the financial sector which in recent years has produced a more sustainable international banking system. At the same time we must state, from a Swedish perspective, that increased capital requirements on banks will never solve the imbalances in the housing market. We want to help our customers to buy a home and will gladly provide financing for new construction. But we are not willing to take part when the same properties are mortgaged at ever increasing levels. In our view, the increased capital requirements on banks are not an optimal way to provide a solution to Sweden’s problem of too little housing, which dampens potential growth. Outlook We continue to plan for an environment with low interest rates and relatively weak credit demand at the same time that we see a brighter outlook. We are striving to keep our total costs for 2013 at the same level as for 2012. We are focused on profitability and capital efficiency while investing in a better customer experience and our employees’ development. Michael Wolf President and CEO
  • 3. Table of contents Page Financial summary 4 Overview 5 Market 5 Important events during the quarter 5 Third quarter 2013 compared with second quarter 2013 5 Result 5 January-September 2013 compared with January-September 2012 6 Result 6 Credit and asset quality 7 Funding and liquidity 8 Ratings 8 Capital and capital adequacy 8 Market risk 10 Operational risks 10 Other events 10 Events after 30 September 2013 10 Business areas Retail 11 Large Corporates & Institutions 13 Baltic Banking 15 Group Functions & Other 17 Eliminations 19 Product areas 20 Financial information Group Income statement, condensed Statement of comprehensive income, condensed 25 26 Key ratios 26 Balance sheet, condensed 27 Statement of changes in equity, condensed 28 Cash flow statement, condensed 29 Notes 29 Parent company 52 Signatures of the Board of Directors and the President 56 Review report 56 Contact information 57 More detailed information can be found in Swedbank’s fact book, www.swedbank.com/ir, under Financial information and publications. Swedbank – Interim report January-September 2013 Page 3 of 57
  • 4. Financial summary Income statement SEKm Q3 2013 Q2 2013 % Q3 2012 % Net interest income Net commissions Net gains and losses on financial items at fair value Other income Total income 5 641 2 520 170 894 9 225 5 409 2 525 296 749 8 979 4 0 -43 19 3 5 085 2 375 687 824 8 971 11 6 -75 8 3 16 403 7 433 1 023 2 427 27 286 15 015 7 112 2 243 2 461 26 831 9 5 -54 -1 2 Staff costs Other expenses Total expenses Profit before impairments 2 328 1 667 3 995 5 230 2 391 1 735 4 126 4 853 -3 -4 -3 8 2 229 1 691 3 920 5 051 4 -1 2 4 7 077 5 087 12 164 15 122 6 974 5 444 12 418 14 413 1 -7 -2 5 Impairment of intangible assets Impairment of tangible assets Credit impairments Operating profit 0 95 -56 5 191 170 202 88 4 393 6 170 382 92 14 478 3 266 -109 14 253 998 913 -18 2 887 3 371 -14 7 Tax expense Profit for the period from continuing operations 18 -1 102 36 4 914 9 1 216 -53 -7 Jan-Sep Jan-Sep 2013 2012 % 44 2 4 193 3 480 20 3 698 13 11 591 10 882 Profit for the period from discontinued operations, after tax -15 -1 887 -99 -203 -93 -2 292 -823 Profit for the period Profit for the period attributable to the shareholders of Swedbank AB 4 178 1 593 3 495 20 9 299 10 059 -8 4 172 1 592 3 495 19 9 289 10 052 -8 Key ratios and data per share Q3 2013 Q2 2013 Q3 2012 Return on equity, continuing operations, % Return on equity, total operations, % 16.2 16.1 14.1 6.5 15.2 14.3 15.2 12.2 15.0 13.8 3.82 3.16 3.38 10.55 9.91 3.79 3.15 3.36 10.48 9.87 0.43 0.46 0.44 0.45 0.46 202 186 194 202 194 18.0 19.3 20.4 17.2 18.6 19.6 15.4 16.9 18.0 18.0 19.3 20.4 15.4 16.9 18.0 18.8 19.7 20.2 18.0 19.0 19.5 16.7 18.2 18.6 18.8 19.7 20.2 16.7 18.2 18.6 -0.02 0.69 53 0.03 0.76 54 0.01 1.32 65 0.01 0.69 53 -0.01 1.32 65 30 Sep 2013 31 Dec 2012 % 30 Sep 2012 % 1 248 624 106 1 832 1 239 580 103 1 847 1 8 3 -1 1 251 631 99 1 965 0 -1 7 -7 446 442 487 464 -8 -5 498 476 -10 -7 Earnings per share before dilution, continuing operations, SEK 1) Earnings per share after dilution, continuing operations, SEK 1) Cost/income ratio Loan/deposit ratio, % Common Equity Tier 1 ratio, %, Basel 3 Tier 1 capital ratio, %, Basel 3 2) Capital adequacy ratio, %, Basel 3 2) 2) Common Equity Tier 1 ratio, %, Basel 2 Tier 1 capital ratio, %, Basel 2 Capital adequacy ratio, %, Basel 2 Credit impairment ratio, % Share of impaired loans, gross, % Total provision ratio for impaired loans, % Balance sheet data SEKbn Loans to the public Deposits and borrowings from the public Shareholders' equity Total assets Risk weighted assets, Basel 3 2) Risk weighted assets, Basel 2 1) Jan-Sep Jan-Sep 2013 2012 After deducting the preference share dividend, earnings per share for the first quarter 2013 were SEK 1.99 for continuing operations after dilution. The calculations are specified on page 49. 2) According to Swedbank’s interpretation of future regulations. The key ratios are based on profit and shareholders’ equity allocated to shareholders of Swedbank. Swedbank – Interim report January-September 2013 Page 4 of 57
  • 5. Overview Profit before impairments by business area SEKm Market The Swedish economy shrunk by 0.2 per cent during the second quarter compared with the first quarter. Lower exports and investment were the biggest reason for the decrease, while private consumption and inventories continued to rise. However, the GDP decline has not prevented employment from growing, although the impact on unemployment has been small due to the increased labour supply. During the third quarter household and business sentiment improved in Sweden. Pending income tax cuts, low inflation and rising asset prices are boosting household purchasing power. Although industrial confidence indicators have risen, there are no signs yet of a recovery in exports and industrial production owing to weak external demand. There are also indications that it will take time before business investment accelerates. During the second quarter GDP in Latvia rose by 4.3 per cent at an annual rate, while growth in Lithuania was 4.2 per cent. The Estonian economy grew during the same period by only 1.0 per cent due to low investments and a decline in net exports. Inflation continued to fall in the Baltic economies and in September was 0.4 per cent in Lithuania and 2 per cent in Estonia. In Latvia the inflation rate was negative (-0.4 per cent) for the first time since the recession year of 2010. Uncertainly about US fiscal policy and the Federal Reserve’s surprising decision in September not to taper its bond purchases have pressed long-term bond yields downward after having risen continuously since last spring. The Riksbank maintained the repo rate at 1 per cent at its most recent monetary meeting in September, citing the high level of household indebtedness as the main reason. The Stockholm stock exchange (OMXSPI) gained 16 per cent during the first nine months of the year. The Tallinn stock exchange (OMXTGI) rose by 14 per cent, the Riga stock exchange (OMXRGI) by 15 per cent and the Vilnius stock exchange (OMXVGI) by 19 per cent. Important events during the quarter On 19 July S&P revised Swedbank’s outlook from negative to stable. For more information, see page 8 Third quarter 2013 Compared with second quarter 2013 Result Profit before impairments increased by 8 per cent to SEK 5 230m (4 853). Retail, Baltic Banking, and Group Treasury within Group Functions & Other all contributed to the increase, while profit before impairments within LC&I fell. Retail Large Corporates & Institutions Baltic Banking Group Functions & Other Total excl FX effects FX effects Total Q3 2013 Q2 2013 Q3 2012 3 102 2 914 2 936 996 849 283 5 230 1 086 800 61 4 861 -8 4 853 925 758 455 5 074 -23 5 051 5 230 The third quarter result amounted to SEK 4 172m (1 592) and the result for continuing operations was SEK 4 187m (3 478). The result for discontinued operations was SEK -15m (-1 887) and consists mainly of the result from the Russian operations. The Ukrainian operations were sold during the second quarter. Net recoveries amounted to SEK 56m (credit impairments of 88), mainly due to higher net recoveries within Baltic Banking. Retail reported higher credit impairments than in the second quarter, while credit impairments within LC&I decreased. Tangible asset writedowns amounted to SEK 95m (202) and mainly relate to the writedown of Ektornet’s property values. There were no intangible asset writedowns during the quarter (SEK 170m). The return on equity was 16.2 per cent for continuing operations (14.1). The cost/income ratio was 0.43 (0.46). Income increased by 3 per cent to SEK 9 225m (8 979). Net interest income accounted for the largest increase, while net gains and losses on financial items at fair value decreased. Other income rose due to increased proceeds from property sales by Ektornet as well as a higher share of profit of associates. Net interest income increased by 4 per cent to SEK 5 641m (5 409). Retail and Group Treasury within Group Functions & Other posted the largest increase. Positive contributions came from higher lending volumes and the difference in the maturity structure between lending and deposits, where lending matures on a continuous basis but funding matures on specific dates. Mortgage margins displayed the same pattern as in the second quarter: stable for the mortgage portfolio as a whole, but with slightly lower margins on new lending. Net commission income was unchanged at SEK 2 520m (2 525). Net commission income within Retail contributed positively as a result of higher average assets under management following a rise in equity prices. Net commission income within LC&I was seasonally lower. The outsourcing of Retail’s ATMs has reduced both net commission income and expenses. For more information, see page 12. Net gains and losses on financial items at fair value fell by 43 per cent to SEK 170m (296). LC&I reported a lower result and was negatively affected by low risk utilisation. Group Treasury had a continued negative effect in the quarter. Swedbank – Interim report January-September 2013 Page 5 of 57
  • 6. Expenses decreased by 3 per cent compared with the previous quarter and amounted to SEK 3 995m (4 126) mainly due to seasonally lower expenses for staffing, travel, marketing and consultants. Expense analysis Group SEKm Retail Large Corporates & Institutions Baltic Banking Group Functions & Other and Eliminations Total excl FX effects FX effects Total expenses Q3 2013 Q2 2013 Q3 2012 2 389 2 398 2 477 759 604 833 603 720 575 243 3 995 302 4 137 -11 163 3 935 -15 3 995 4 126 3 920 The number of full-time positions decreased during the quarter by 87, to 14 264. Baltic Banking decreased by 222. Group Functions & Other increased by 54, Retail by 48 and Large corporates & Institutions by 33. The tax expense amounted to SEK 998m (913), corresponding to an effective tax rate of 19.2 per cent (20.8). The relatively higher effective rate in the second quarter is due to a non-deductible property writedown of SEK 200m by Ektornet. No deferred tax assets were booked in connection with the writedown. January-September 2013 Compared with January-September 2012 For the first nine months of 2013 credit impairments of SEK 92m were reported (net recoveries of 109m). LC&I and Retail reported credit impairments, while Baltic Banking reported net recoveries. Tangible asset writedowns increased by SEK 116m to SEK 382m, where SEK 375m related to Ektornet. Intangible asset writedowns amounted to SEK 170m (3) and mainly related to the writedown of IT systems within Swedbank Finance AB and LC&I during the second quarter. Fluctuations in exchange rates, primarily the strengthening of the Swedish krona against the euro and the Baltic currencies, reduced profit by SEK 61m. The return on equity was 12.2 per cent (13.8). The return on equity for continuing operations was 15.2 per cent (15.0). The cost/income ratio was 0.45 (0.46). Income increased by 2 per cent to SEK 27 286m (26 831). Income in Retail, Baltic Banking and LC&I was stable compared with the same period previous year. Group Treasury reported higher income year-on-year. Fluctuations in exchange rates reduced income by SEK 112m. Net interest income increased by 9 per cent to SEK 16 403m (15 015). The repricing of corporate lending within Retail and LC&I positively affected net interest income. Treasury’s net interest income has been temporarily strengthened by positions that have benefited from falling market interest rates. The fee for government guaranteed funding decreased by SEK 197m. Lower deposit margins due to falling Stibor and Euribor rates as well as increased competition for deposits in Sweden negatively affected net interest income. Fluctuations in exchange rates reduced net interest income by SEK 63m. Results Profit before impairments increased by 5 per cent to SEK 15 122m (14 413). The first quarter 2012 was negatively affected by a one-off adjustment of SEK 250m within Group Treasury. Stronger net interest income, higher commission income and lower expenses positively affected profit, while net gains and losses on financial items at fair value were lower year-on-year. Profit before impairments by business area SEKm Retail Large Corporates & Institutions Baltic Banking Group Functions & Other Total excl FX effects FX effects Total Jan-Sep Jan-Sep 2013 2012 ∆ SEKm 8 987 8 794 193 3 168 2 329 638 15 122 3 068 2 386 121 14 370 43 14 413 100 -57 517 752 -43 709 15 122 The result for the period decreased by 8 per cent to SEK 9 289m (10 052). The result for continuing operations was SEK 11 581m (10 872). The result for discontinued operations was SEK -2 292m (-820), of which SEK 1 875m is a cumulative negative exchange rate difference that was reclassified to the income statement from other comprehensive income in the second quarter in connection with the sale of the Ukrainian operations. For more information, see note 24. Swedbank – Interim report January-September 2013 Page 6 of 57 Net commission income improved to SEK 7 433m (7 112). Higher commission income from asset management from increased assets under management, higher income from card operations and increased activity in financing solutions positively affected net commission income, while corporate finance income was lower. The outsourcing of ATMs by Retail has reduced net commission income as well as expenses. For more information, see page 12. Net gains and losses on financial items at fair value decreased by 54 per cent to SEK 1 023m (2 243). The first quarter 2012 was negatively affected by SEK 250m by a one-off adjustment within Group Treasury. The repurchase of government guaranteed bonds during the second quarter 2013 and a relatively fast pace of covered bond repurchases during the first nine months of 2013 negatively affected net gains and losses on financial items at fair value. The results from equity, fixed income and currency trading were lower than in the same period in 2012, when the first-quarter results were very strong due to favourable market conditions. Expenses decreased by 2 per cent to SEK 12 164m (12 418). The largest decrease was in depreciation and amortisation, mainly from a reclassification within Swedbank Finance AB (Group Functions & Other), but also within Ektornet. The reclassification in Swedbank Finance AB at the same time reduced net interest income. Expenses for transport and security fell by SEK 109m, telephone and postage expenses by SEK 61m and other expenses by SEK 107m. Variable staff costs increased by SEK 89m to SEK 670m due to the addition of a new share-based programme for 2013 to the accruals of previous share-based programmes for 2010,
  • 7. 2011 and 2012. Since 1 July 2010 Swedbank pays part of its variable remuneration in the form of shares. This remuneration is accrued as an expense until the shares are settled. As a result, variable remuneration allocated to employees during the period differs from the recognised amount. A more detailed analysis of variable 1 remuneration is provided on page 14 of the fact book . Changes in exchange rates reduced expenses by SEK 68m. Expense analysis Group SEKm Retail Large Corporates & Institutions Baltic Banking Group Functions & Other and Eliminations Total excl FX effects FX effects Total expenses Jan-Sep 2013 Jan-Sep 2012 ∆ SEKm 7 193 2 327 1 783 7 317 2 217 1 751 -124 110 32 861 12 164 1 065 12 350 68 -204 -186 -68 12 164 12 418 -254 The number of full-time positions has decreased in one year by 1 031, of which 585 were in Ukraine and Russia, 317 in Baltic Banking and 345 in Ektornet (Group Functions & Other). The number of full-time positions in Retail increased by 73. The tax expense amounted to SEK 2 887m (3 371), corresponding to an effective tax rate of 19.9 per cent (23.7). The lower effective tax rate in 2013 is mainly due to a reduction of the Swedish corporate tax rate as of 1 January 2013. Credit and asset quality The bank’s credit portfolio is stable, with a low number of customers with payment problems as well as low credit impairments. The low credit risk in the mortgage portfolio is also underscored by Swedbank’s internal stress tests and is maintained through active and continuous customer monitoring. This is confirmed by the Riksbank’s latest stability report, where Swedbank is the only one of the four major Swedish banks with a positive result throughout the scenario period and whose Common Equity Tier 1 ratio did not decrease. The quality of the credit portfolio in the Baltic countries increased during the nine-month period, with a lower percentage of credit impairments and an improved risk profile among customers. Credit demand remained low in all of the bank’s home markets. Swedbank’s lending increased during the first nine months of the year by SEK 11bn to SEK 1 195bn, with currency effects reducing the increase by SEK 2bn. Lending to Swedish mortgage customers (including tenant-owner associations) rose by SEK 9bn. Corporate lending within LC&I and Retail increased marginally. The lending portfolio in Baltic Banking rose slightly in local currency, mainly due to a few large corporate customers with low risk. The discontinuation of the operations in Russia and sale of the Ukrainian operations have reduced lending volume by SEK 4.2bn. The average loan-to-value ratio of Swedbank’s mortgages in Sweden was 62.6 per cent (63.5) as of 30 September, based on property level. The corresponding 1 More detailed information can be found in Swedbank’s fact book, www.swedbank.com/ir, under Financial information and publications. Swedbank – Interim report January-September 2013 Page 7 of 57 figure for new mortgages in Sweden was 69.7 per cent. House prices in major Baltic cities have stabilised, with a clear rise in Estonia. The average loan-to-value ratio in Baltic Banking was 86.2 per cent, while the ratio for new lending was about 70 per cent. Impaired loans fell by SEK 5bn during the first nine months to SEK 9bn. The sale of the Ukrainian operations and discontinuation of operations in Russia accounted for SEK 3bn of the decrease. In Baltic Banking, impaired loans fell by SEK 3bn, mainly due to write-offs and improved quality in the loan portfolio. Impaired loans within LC&I increased by SEK 1bn related to a few large commitments, while in Retail they were unchanged during the period. Impaired loans to private customers decreased during the nine-month period. The share of Swedish mortgages past due by more than 60 days was stable at 0.11 per cent of the portfolio (0.13). The share of impaired mortgages in Baltic Banking fell, with the largest decrease in Latvia. The share of mortgages past due by more than 60 days was 0.82 per cent in Estonia (1.1), 9.2 per cent in Latvia (10.5) and 5.4 per cent in Lithuania (5.4). Further improvements are expected this year. Credit impairments for the first nine months of the year amounted to SEK 92m (recoveries of SEK 109m). Credit impairments within Retail and LC&I remained low and were related to a few corporate commitments. The recoveries in the Baltic countries primarily relate to a limited number of corporate commitments. Credit impairments, net by business area SEKm Retail Large Corporates & Institutions Baltic Banking Estonia Latvia Lithuania Group Functions & Other Total Q3 2013 Q2 2013 Q3 2012 106 37 72 7 -147 -38 -70 -39 -22 -56 94 -43 -36 18 -25 0 88 -38 -18 2 8 -28 20 36 The value of repossessed assets in the Group fell by SEK 1 966m to SEK 3 100m during the nine-month period, of which SEK 94m related to property writedowns by Ektornet during the third quarter. During the nine-month period properties with a book value of SEK 1 925m were sold. For more information on Ektornet, see page 18. Swedbank’s exposure to counterparties in the GIIPS countries (Greece, Ireland, Italy, Portugal and Spain) remains low. The exposures totalled SEK 214m as of 30 September 2013 (401).
  • 8. GIIPS exposure 30 Sep 2013 SEKm Greece Ireland Bonds of which sovereign of which held to maturity Loans (money market and commercial paper) Derivatives net1 Other2 Total 0 0 0 0 0 Italy Portugal 2 0 2 Total 5 5 5 117 117 117 27 6 12 103 Spain 27 27 27 85 85 85 69 8 82 0 77 20 214 1 Derivatives at market value taking into account netting and collateral agreements. The derivatives gross value i.e. market value plus internal add-ons, amounts to: Ireland SEK 10m, Italy SEK 340m and Spain SEK 204m. Total SEK 554m. 2 Includes funds, trade finance and mortgage loans. (NSFR) was 91 per cent on 30 September (95). The main liquidity measure used by the Board of Directors and executive management is the so-called survival horizon, which shows how long the bank could manage long periods of stress in capital markets, where access to new financing is limited. At present the bank would survive more than 12 months with the capital markets completely shut down. This applies to the Group’s total liquidity as well as liquidity in USD and EUR. For more information on Swedbank’s funding and liquidity (including the survival horizon), see pages 63-77 of the fact book. Ratings Funding and liquidity On 19 July S&P revised Swedbank’s outlook from negative to stable. In S&P’s view, Swedbank increased its ability to manage higher financial risks in Sweden against the backdrop of the bank’s strong capitalisation and earnings. S&P expects Swedbank’s capital situation and profitability to continue to improve over the next two years. In addition, S&P affirmed its A+ long-term and A1 short-term credit ratings on Swedbank and Swedbank Mortgage. During the first nine months of the year Swedbank issued a total of SEK 89bn in long-term debt instruments, of which SEK 61bn was covered bonds and SEK 24bn was senior debt. Issuance during the third quarter amounted to SEK 20bn, of which covered bonds accounted for SEK 16bn and senior debt for SEK 4bn. At the same time the bank saw continued high demand for private placements. In total Swedbank plans to issue around SEK 120bn in the next 12 months to meet maturing long-term funding with a nominal value of SEK 98bn. Liquidity in excess of its refinancing needs will be used in connection with day-to-day management to repurchase covered bonds. Capital and capital adequacy The Common Equity Tier 1 ratio according to Basel 3 continued to strengthen during the quarter to 18.0 per cent on 30 September, according to Swedbank’s calculation based on current knowledge of future regulations (17.2 per cent on 30 June 2013 and 15.4 per cent on 31 December 2012). The new regulations were adopted by the EU in June and take effect on 1 January 2014. Introduction of new capital buffers requires implementation in Swedish law, however, and takes effect later in 2014. The Common Equity Tier 1 ratio according to Basel 2 was 18.8 per cent on 30 September (18.0 and 16.7, respectively). The average maturity of all capital market funding arranged through the bank’s short- and long-term programmes was 31 months as of 30 September 2013 (33). The average maturity of long-term funding issued during the first nine months was 52 months. The bank’s short-term funding is mainly used as a cash management tool, not to finance lending to the public. Outstanding volume decreased by SEK 5bn during the quarter to SEK 129bn. Issued long-term debt SEKbn Covered bonds of which SEK of which EUR of which USD of which Other Senior unsecured bonds Structured retail bonds (SPAX) Total Q3 2013 Q2 2013 Q1 2013 16 15 1 0 23 14 9 0 0 5 1 29 23 13 1 7 2 15 1 39 4 0 20 Swedbank’s liquidity reserve, which is reported in accordance with the Swedish Bankers’ Association’s definition, amounted to SEK 236bn on 30 September 2013 (289). In addition to the liquidity reserve, liquid securities in other parts of the Group amounted to SEK 39bn (35). The liquidity reserve and the Liquidity Coverage Ratio (LCR) will fluctuate over time depending, among other things, on the maturity structure of the bank’s issued securities. According to current Swedish regulations in effect as of 1 January 2013, the Group’s LCR was 147 per cent as of 30 September (129). Distributed by USD and EUR, LCR was 659 per cent and 253 per cent, respectively. In early 2013 the Basel Committee published a new recommendation on the definition of LCR. According to Swedbank’s interpretation of the new definition, LCR would have been 180 per cent as of 30 September. According to Swedbank’s interpretation of the current draft regulation, the Group’s Net Stable Funding Ratio Swedbank – Interim report January-September 2013 Page 8 of 57 Common Equity Tier 1 capital (Basel 2) increased by SEK 1.2bn during the quarter to SEK 83.2bn. The increase was mainly due to the quarterly profit, after deducting the anticipated dividend. As of 1 January 2013 new rules have entered into force on the recognition of pensions (accounting standard IAS 19). The revisions will create volatility in the estimated pension liability, which also affects equity through other comprehensive income. Due to rising discount rates, Common Equity Tier 1 capital increased by approximately SEK 0.4bn during the third quarter and by approximately SEK 2.1bn during the nine-month period.
  • 9. Change in Common Equity Tier 1 capital 2013, Swedbank financial companies group SEKbn SEKbn 90 Basel 2 81.9 85 80 500 3.9 0.4 0.0 Basel 2 83.2 Basel 3 487.1 480 -3.1 Basel 2 77.5 Basel 3 459.5 75 460 70 65 Change in risk weighted assets 2013, Swedbank financial companies group Basel 3 75.2 Basel 3 79.2 Basel 3 80.4 440 Basel 3 446.0 -4.7 Basel 2 464.3 -3.7 - 0.6 -1.4 -1.4 Basel 2 455.2 -1.9 420 60 55 0.0 Basel 2 441.6 400 50 380 45 40 Increase Increase Decrease * Profit for financial companies group. Subordinated loans that can be included in the capital base decreased by SEK 0.6bn, mainly due to the redemption of a subordinated loan of SEK 536m in midSeptember. Risk weighted assets (Basel 2) decreased by SEK 13.6bn to SEK 441.6bn during the third quarter. The risk weighted amount for credit risks decreased by SEK 11.8bn. Lower credit utilisation by corporate customers within LC&I, coupled with less exposure to credit institutions, has reduced the risk weighted amount by SEK 4.7bn. Positive rating migrations have reduced the risk weighted amount by SEK 3.7bn. Lower non-credit obligations have reduced the risk weighted amount by SEK 2.0bn (included in other credit risk in the diagram below). Fluctuations in exchange rates, mainly attributable to the Baltic credit portfolio, reduced the risk weighted amount for credit risks by SEK 1.4bn due to the strengthening of the Swedish krona against the euro. The risk weighted amount for market risks decreased by SEK 1.8bn during the third quarter, mainly due to lower exposures within LC&I and because the liquidity portfolio in the Baltic region is risk weighted as credit risk as of the third quarter. The risk weighted amount for operational risks was unchanged as of 30 September compared with 30 June. Decrease In May the Swedish Financial Supervisory Authority announced its decision to introduce a risk weight floor of 15 per cent for the Swedish mortgage portfolio, in line with the proposal announced in November 2012. The floor will be introduced as a supervisory measure within Pillar 2. Consequently, the reported capital ratios will not be affected, since the calculations are made according to the rules for Pillar 1. Accordingly, the average risk weight in Swedbank’s Swedish mortgage portfolio is 4.4 per cent as of 30 September. Given the Swedish Common Equity Tier 1 capital requirement of 12 per cent (as of 2015), Swedbank, as per the Swedish Financial Supervisory Authority’s decision to raise the floor, has to maintain additional Common Equity Tier 1 capital of SEK 9.8bn for Swedish mortgages. This corresponds to 2.2 percentage points of the Common Equity Tier 1 ratio according to Pillar 1. In its internal controls, Swedbank has for some time allocated additional capital to its mortgage business equivalent to the risk weight floor that has now been announced. Risk-weighted assets by business area, Basel 2 SEKbn Retail Large Corporates & Institutions Baltic Banking Estonia Latvia Lithuania Group Functions & Other Group Products Treasury Ektornet Other Total risk-weighted assets 30 Sep 2013 31 Dec 2012 30 Sep 2012 200 202 212 128 87 35 27 25 27 4 16 4 3 442 134 95 38 31 26 33 4 15 6 8 464 135 93 37 31 25 36 3 16 6 11 476 Discussions among regulators and other interested parties on the harmonisation of risk weights have intensified in the last half-year. One topic of discussion is how the leverage ratio can be used to ensure a Swedbank – Interim report January-September 2013 Page 9 of 57
  • 10. minimum capital level in relation to the size of the balance sheet. When the EU’s new capital adequacy rules (CRD IV/CRR) take effect on 1 January 2014, banks will be obligated to report their leverage ratios to the supervisory authorities. Swedbank’s leverage ratio (according to CRR) was 4.35 per cent on 30 September. Market risk The majority of the Group’s market risks are of a structural or strategic nature and are managed by Group Treasury. Structural interest rate risks arise when the maturity of the Group’s assets and liabilities, such as deposits and lending, do not coincide. These differences are managed within given mandates by matching the maturities directly or through the use of various derivatives such as interest rate swaps. Net interest income sensitivity is also affected by structural risks in the bank’s deposit operations, where various products show different sensitivity to changes in market interest rates. Strategic currency risks arise primarily through risks tied to holdings in foreign subsidiaries and their financing. In Swedbank market risks also arise in LC&I’s trading operations in connection with customer transactions and by maintaining a secondary market for various types of securities. Swedbank measures market risks with a Value-at-Risk (VaR) model, among other things. VaR expresses a loss level that statistically will be exceeded by a specific probability during a set time horizon. Swedbank uses a 99 per cent probability and a time horizon of one day. This means that the potential loss for the portfolio, based on historical data, will exceed VaR on one day of 100. The table below shows Swedbank’s VaR*) performance during the year. VaR by risk category SEKm Interest risk Currency rate risk Stock price risk Diversification Total Jan-Sep 2013 (2012) Max Min Average 97 (141) 17 (14) 9 (14) 0 89 (131) 59 (76) 2 (3) 2 (4) 0 58 (69) 30 Sep 31 Dec 2013 2012 76 (106) 8 (6) 4 (7) -15 (-20) 73 (99) 61 7 3 -13 58 71 5 4 -14 66 *) VaR here excludes strategic currency rate risks, since a VaR measurement based on a time horizon of one day is not relevant. For individual risk types, VaR is supplemented with risk measures and limits based on sensitivity to changes in various market prices. Risk taking is also monitored with stress tests. An increase in all market interest rates of one percentage point as of 30 September 2013 would have reduced the Group’s net gains and losses on financial items at fair value by SEK 533m compared with a decrease of SEK 52m as of 31 December 2012. Swedbank – Interim report January-September 2013 Page 10 of 57 Operational risks Swedbank’s measures to stabilise IT operations and availability in the Internet Bank and Telephone Bank have continued. In comparison with the first nine months of 2012, the number of major IT-related incidents decreased by 59 per cent at the same time that the average time it took to address the incidents fell by 49 per cent. The long-term work to improve the bank’s IT infrastructure is continuing according to plan. The availability of Bankomat AB’s ATMs continued to improve. During the quarter, however, on one occasion deposits and withdrawals by Swedbank’s customers through the ATMs were mistakenly registered twice. External fraud attempts against the bank’s customers have decreased and are at a low level year-on-year. Expenses associated with operational risk events have remained low. Other events Swedbank’s Annual General Meeting in Stockholm will be held on Wednesday, 19 March 2014. The Nomination Committee comprises the following members: Lennart Anderberg, appointed by the ownergroup Föreningen Sparbanksintressenter and Chair of the Nomination Committee; Ramsay Brufer, appointed by Alecta Pensionsförsäkring; Jens Henriksson, appointed by the owner-group Folksam; Tommy Hjalmarsson, appointed by the owner-group Sparbanksstiftelserna; Anders Sundström, Chair of the Board of Directors of Swedbank AB. The Nomination Committee will make proposals to the 2014 AGM on the election of Chair of the AGM, Chair of the Board and other board members as well as election of auditor. The Nomination Committee will also make proposals on remuneration to the board members and the auditor and propose principles for the selection of a Nomination Committee for 2015. Shareholders who would like to forward a proposal to the Nomination Committee shall submit a proposal no later than 20 December 2013 either by e-mail to: valberedningen@swedbank.se or by mail to: Valberedningen c/o Swedbank AB Valberedningens sekreterare, H12 SE-105 34 Stockholm, Sweden Events after 30 September 2013 On 1 October the Russian central bank approved Swedbank’s application to revoke Swedbank’s banking licence in Russia.
  • 11. Retail  Stable net interest income  Improved market position in mortgages  New pilot branches meet changing customer behaviour Income statement SEKm Q3 2013 Q2 2013 % Q3 2012 % Net interest income Net commissions Net gains and losses on financial items at fair value Share of profit or loss of associates Other income Total income 3 473 1 550 28 239 201 5 491 3 367 1 536 33 197 179 5 312 3 1 -15 21 12 3 3 405 1 532 39 223 214 5 413 2 1 -28 7 -6 1 10 172 4 675 95 640 598 16 180 10 138 4 601 124 635 613 16 111 0 2 -23 1 -2 0 Staff costs Variable staff costs Other expenses Depreciation/amortisation Total expenses Profit before impairments 874 48 1 438 29 2 389 3 102 866 68 1 434 30 2 398 2 914 1 -29 0 -3 0 6 830 43 1 575 29 2 477 2 936 5 12 -9 0 -4 6 2 611 163 4 330 89 7 193 8 987 2 555 119 4 550 93 7 317 8 794 2 37 -5 -4 -2 2 Credit impairments Operating profit 106 2 996 37 2 877 4 72 2 864 47 5 198 8 789 195 8 599 2 2 Tax expense Profit for the period Profit for the period attributable to the shareholders of Swedbank AB 678 2 318 586 2 291 16 1 759 2 105 -11 10 1 899 6 890 2 236 6 363 -15 8 2 312 2 290 1 2 102 10 6 881 6 353 8 6 1 3 100 9 10 -10 28.1 244 0.05 0.44 925 378 4 969 28.1 243 0.02 0.45 919 378 4 921 25.5 245 0.03 0.46 909 371 4 896 2 2 1 28.0 244 0.03 0.44 925 378 4 969 26.8 245 0.03 0.45 909 371 4 896 2 2 1 Non-controlling interests Return on allocated equity, % Loan/deposit ratio, % Credit impairment ratio, % Cost/income ratio Loans, SEKbn Deposits, SEKbn Full-time employees Development January-September Household and business sentiment in Sweden improved in the third quarter. Low interest rates, increased real incomes and rising asset prices are all benefiting households. The impact on order books and production has been marginal, although the lower number of business bankruptcies in the last three months points to a more stable economy and demand. To date this has not led to an acceleration in lending. Profit for the period amounted to SEK 6 890m (6 363), the result of stable income, expenses and credit impairments. The lower Swedish corporate tax rate positively affected the result. Net interest income was stable during the period compared with the same period in 2012. The repricing of corporate credit largely offset the lower deposit margins, which were adversely affected by declining market interest rates. Stibor declined slightly during the third quarter. Deposit margins rose slightly. Mortgage margins towards customers followed the same pattern as the second quarter: stable for the mortgage portfolio as a whole, but with slightly lower margins on new mortgages. The margin on new loans was 10-15bp lower than the stock margin as of 30 September. Household deposit volume has grown by 1 per cent since the beginning of the year. At the same time fund Swedbank – Interim report January-September 2013 Page 11 of 57 1 0 1 Jan-Sep Jan-Sep 2013 2012 % inflow increased. Swedbank’s share of household deposits was slightly over 21 per cent (22 per cent as of 31 December 2012). Retail’s deposits from corporate customers were unchanged from the beginning of the year. Swedbank’s market share was 17 per cent as of 31 August (16 per cent as of 31 December 2012). Mortgage lending volume has steadily increased during the year and Swedbank has gradually improved its market position. Its share of the net growth was 12 per cent during the period January-August 2013. Swedbank’s share of the total market was 25 per cent (26 per cent as of 31 December 2012). Corporate lending volume has increased by SEK 2bn since the beginning of the year. The market share was 17 per cent (17 per cent as of 31 December 2012). Risk weighted assets amounted to SEK 200bn, a decrease of SEK 2bn since the beginning of the year. The effects of the increased exposure have been offset by the effects of positive rating migrations. Net commission income increased by 2 per cent compared with the first nine months of 2012. The increase was mainly due to higher fund volumes in the wake of rising share prices, but also to net inflows mainly to short-term fixed income funds and collective occupational pensions. Increased income from lending and guarantee commissions also contributed positively,
  • 12. while payment commissions decreased slightly. Since January 2013 Bankomat AB has gradually taken over responsibility for Swedbank’s ATMs. Swedbank pays a commission to Bankomat AB for this service. As a result, net payment commissions and expenses have both decreased. Commissions paid to Bankomat AB amounted to almost SEK 90m during the third quarter and are expected to range around SEK 300m for the full year. At the same time expenses for administration and maintenance are expected to decrease by about SEK 150m. This is in addition to other income of about SEK 80m from the savings banks as well as less need for investment in new ATMs. As of 30 September all of Swedbank’s ATMs have been shifted over to Bankomat AB. A total of 639 ATMs that had previously belonged to Swedbank were fully migrated to Bankomat AB. During the quarter net commission income was stable with the largest positive contribution from increased fund volumes. Expenses for the nine-month period fell by 2 per cent year-on-year. Reduced manual cash handling has led to lower transport and security expenses. Expenses were stable during the third quarter. Credit quality has remained good, although credit impairments increased slightly during the period due to increased provisions within the retail and service sectors. The share of impaired loans was 0.18 per cent (0.19 per cent). Swedbank’s priorities for 2013 include improving the customer offering and the efficiency of the bank’s processes. A considerable share of the work involves developing service, availability and product use through telephone and digital channels. Customer behaviour has changed in pace with society’s digitalisation. Coupled with continued urbanisation, this has changed the rationale for physical customer interactions at bank branches. To adapt to changes in customer behaviour, two pilot branches were launched in September, in Karlstad and Nässjö, with a new way of working and a new customer environment with video-based customer meetings, among other things. Changing customer behaviour has resulted in a longterm trend with less cash usage and more card usage. On a rolling twelve-month basis the number of ATM transactions decreased by 11 per cent. The total value of withdrawals fell by 7 per cent. During the same period the number of card purchases in stores rose by 11 per cent and the aggregate value of card purchases by 8 per cent. Of the total number of card transactions, ATM withdrawals accounted for 9 per cent and card purchases for 91 per cent. Use of Swedbank’s digital services continued to grow. The Internet Bank had 3.5 million users as of 30 September, an increase of 131 000 in the third quarter, while the Mobile Bank had 1.5 million (+137 000) and the iPad Bank had 319 000 (+59 000). During the third quarter efficiency improvements have led to a clear reduction in response times in the Telephone Bank. During the quarter the mobile and iPad apps were updated to display electronic invoices and credit card transactions, among other things. Retail, Swedbank’s dominant business area, is responsible for all Swedish customers except for large corporates and financial institutions. The bank’s services are offered through our digital channels such as the Telephone Bank, Mobile Bank and Internet Bank as well as through Swedbank’s own branch network and the savings banks’ distribution network. Retail includes Channels & Concepts, which is responsible for developing, managing and driving business in our digital channels in Sweden. The various product areas are described on page 20. Swedbank – Interim report January-September 2013 Page 12 of 57
  • 13. Large Corporates & Institutions  High business activity in Large Corporates  Weak fixed income trading and equity trading  Reorganisation completed Income statement SEKm Q3 2013 Q2 2013 Net interest income Net commissions Net gains and losses on financial items at fair value Share of profit or loss of associates Other income Total income 864 467 387 0 37 1 755 851 523 503 0 49 1 926 2 -11 -23 269 99 375 16 759 996 292 104 426 12 834 1 092 Staff costs Variable staff costs Other expenses Depreciation/amortisation Total expenses Profit before impairments Impairment of intangible assets % Q3 2012 % 13 12 -18 -24 -9 768 416 471 0 0 1 655 -8 -5 -12 33 -9 -9 252 65 398 12 727 928 Jan-Sep Jan-Sep 2013 2012 % 2 246 1 297 1 761 6 17 5 327 11 9 -17 6 2 498 1 409 1 469 0 119 5 495 7 52 -6 33 4 7 848 291 1 147 41 2 327 3 168 847 290 1 082 34 2 253 3 074 0 0 6 21 3 3 3 0 56 0 56 4 Credit impairments Operating profit 7 989 94 942 -93 5 -38 966 2 175 2 937 32 3 038 -3 Tax expense Profit for the period Profit for the period attributable to the shareholders of Swedbank AB 211 778 256 686 -18 13 225 741 -6 5 684 2 253 926 2 112 -26 7 778 686 13 741 5 2 253 2 112 7 18.3 208 0.01 0.43 148 71 1 064 14.5 219 0.17 0.43 151 69 1 031 -2 3 3 14.6 192 -0.06 0.44 154 80 1 049 -4 -11 1 16.6 208 0.10 0.42 148 71 1 064 14.5 192 0.02 0.42 154 80 1 049 -4 -11 1 Return on allocated equity, % Loan/deposit ratio, % Credit impairment ratio, % Cost/income ratio Loans, SEKbn Deposits, SEKbn Full-time employees Development January-September Signals from the US central bank, the Federal Reserve, about tapering its bond purchases contributed to continued uncertainty in the financial markets. Several emerging markets were hit by capital outflows with significantly weakened currencies as a result. The Fed’s decision in September not to reduce its bond purchases had a stabilising effect, causing leading equity indexes to rise. Long-term Swedish government bond yields, which rose substantially during the quarter, have retreated. The profit amounted to SEK 2 253m for the nine-month period, an increase of 7 per cent year-on-year. The result was positively affected by lending-related income and fund commissions but negatively by lower activity and earnings in fixed income and equity trading as well as Corporate Finance. The return on allocated equity was 16.6 per cent. Net interest income increased by 11 per cent compared with the first nine months of 2012, partly due to the repricing of corporate lending. Lending volume fell by 4 per cent or SEK 6bn. Compared with the previous quarter net interest income rose 2 per cent in the third quarter to SEK 864m. Business activity within Large Corporates was high late in the quarter. The margin on the loan portfolio increased slightly, however, competition is expected to grow with tighter margins as Swedbank – Interim report January-September 2013 Page 13 of 57 a result. Lending volumes fell slightly during the quarter, partly due to lower credit utilisation as of 30 September and a stronger krona. Deposit margins and volumes were stable. Risk weighted assets decreased by SEK 6bn during the quarter to SEK 128bn as of 30 September. Risk weighted assets for credit risk decreased by SEK 4bn, mainly due to lower utilisation of credit and a stronger krona. Risk weighted assets related to market risk decreased by SEK 2bn as a result of generally lower market volatility. During the nine-month period net commission income increased by 9 per cent year-on-year to SEK 1 409m, mainly due to increased fund and lending commissions. Compared with the previous quarter net commission income decreased by 11 per cent to SEK 467m during the third quarter, mainly related to lower earnings in Corporate Finance. The weak income trend in equity trading continued at the same time that income from fund and cash management products was stable. Bond issuance activity remained good in both Sweden and Norway. Swedbank’s market share for issuances by Swedish customers was 19 per cent for the nine-month period. The corresponding figure in Norway was nearly 15 per cent, making the bank the third largest player in both countries.
  • 14. Net gains and losses on financial items at fair value for the nine-month period decreased by 17 per cent yearon-year to SEK1 469m. Compared with the previous quarter net gains and losses on financial items at fair value decreased by 23 per cent. The quarter was marked by seasonally low customer activity and low risk utilisation. Uncertainty surrounding the tapering of quantitative easing in the US continued to complicate risk management. Earnings were slightly lower than expected in fixed income and credit trading. Earnings in currency trading were relatively good. Total expenses for January to September increased by 3 per cent year-on-year, mainly related to IT expenses. Quarterly expenses were lower than in the previous quarter, mainly because payroll expenses in Norway are not recorded for July and due to lower IT project activity. Credit impairments amounted to SEK 175m during the first nine months of the year, of which SEK 7m related to the third quarter. The share of impaired loans was 0.48 per cent (0.10 per cent). Credit quality in the loan portfolio remains good. LC&I has implemented a reorganisation during the year to increase customer satisfaction and raise profitability. The organisational goal is to further develop customer relations and create new business through a more distinctive product offering. The new organisation, which took effect on 1 July 2013, consists of five new units. As of the third quarter 2013 they are reported separately in the fact book. Large Corporates & Institutions has customer responsibility for large corporates, financial institutions and banks as well as for trading and capital market products. Operations are carried out by the parent bank in Sweden, branch offices in Norway, Finland, the US and China, and through the trading and capital market operations in subsidiary banks in Estonia, Latvia and Lithuania. Swedbank – Interim report January-September 2013 Page 14 of 57
  • 15. Baltic Banking  Repricing of corporate lending contributed positively  Continued good activity in daily banking business  New organisational structure according to plan Income statement SEKm Q3 2013 Q2 2013 % Q3 2012 % Net interest income Net commissions Net gains and losses on financial items at fair value Other income Total income 807 446 98 102 1 453 763 445 72 98 1 378 6 0 36 4 5 753 376 74 84 1 287 7 19 32 21 13 2 312 1 279 232 289 4 112 2 531 1 156 215 301 4 203 -9 11 8 -4 -2 175 18 382 29 604 849 1 -147 995 189 9 366 29 593 785 2 -43 826 -7 100 4 0 2 8 -50 2 50 11 -3 9 16 -80 20 171 12 343 30 556 731 5 -18 744 34 552 44 1 099 88 1 783 2 329 7 -260 2 582 550 47 1 088 94 1 779 2 424 7 -356 2 773 0 -6 1 -6 0 -4 0 -27 -7 84 911 68 758 24 20 59 685 42 33 213 2 369 232 2 541 -8 -7 911 758 20 685 33 2 369 2 541 -7 16.6 106 -0.50 0.42 117 110 3 831 13.4 108 -0.15 0.43 119 110 4 053 -2 0 -5 11.2 113 -0.07 0.43 111 99 4 148 5 11 -8 14.1 106 -0.30 0.43 117 110 3 831 13.9 113 -0.40 0.42 111 99 4 148 5 11 -8 Staff costs Variable staff costs Other expenses Depreciation/amortisation Total expenses Profit before impairments Impairment of tangible assets Credit impairments Operating profit Tax expense Profit for the period Profit for the period attributable to the shareholders of Swedbank AB Return on allocated equity, % Loan/deposit ratio, % Credit impairment ratio, % Cost/income ratio Loans, SEKbn Deposits, SEKbn Full-time employees Development January-September The Baltic countries’ growth remained among the strongest in the EU in the second quarter. Compared with the previous year GDP rose by 4.4 per cent in Latvia and 3.8 per cent in Lithuania, but only 1.0 per cent in Estonia. Against the backdrop of the improvement in the eurozone, higher growth is anticipated in all three countries. Household spending is expected to remain strong due to rising incomes and confidence. Latvia will join the EMU in 2014 and Lithuania has a strong case to do the same in 2015. The result amounted to SEK 2 369m for the first nine months, against SEK 2 541m in the same period a year earlier. The decrease was mainly due to lower net interest income and lower net recoveries. Net interest income declined by 7 per cent in local currency compared with 2012. Lower market rates negatively affected net interest income, while increased deposit volumes and a slightly larger loan portfolio had a positive impact. Loan portfolios with a volume of SEK 1.6bn were acquired from Hipoteku Bank in Latvia during the second half of 2012. Fluctuations in exchange rates reduced net interest income by SEK 26m. Net interest income in local currency rose by 6 per cent in the third quarter with the repricing of corporate lending and the euro’s appreciation against the krona both contributing positively. Compared with the previous quarter net interest income increased by 4 per cent in Swedbank – Interim report January-September 2013 Page 15 of 57 Jan-Sep Jan-Sep 2013 2012 % local currency. It is the first time in 2013 that quarterly net interest income has risen year-on-year. Work has been initiated to reprice business that does not meet the desired risk-adjusted returns. Exposures whose return requirements cannot be met will be divested when possible. This may adversely affect lending growth. Lending volumes increased by 2 per cent in local currency compared with 30 September 2012. The increase is mainly attributable to the corporate segment. Signs of improvement in new household lending have been seen in Estonia and Lithuania since May. In Latvia, the lending portfolio decreased due to amortisations and write-offs, despite the acquisition of Hipoteku’s loan portfolios in the second half of 2012. Swedbank’s market share in lending was 29 per cent as of 31 August (31 per cent as of 31 December 2012). The deposit volumes increased by 9 per cent in local currency compared with 30 September 2012. Private deposits increased by 10 per cent and corporate deposits by 7 per cent on an annual basis. The Latvian deposit portfolio increased the most, with the acquisition of Hipoteku bank contributing SEK 1.8bn. Swedbank’s market share for deposits was 30 per cent as of 31 August (31 per cent as of 31 December 2012).
  • 16. The loan-to-deposit ratio was 106 per cent (108 per cent as of 31 December 2012). were generated in the corporate portfolio, while the mortgage portfolio generated some impairments. Net commission income increased by 12 per cent in local currency compared with the first nine months of 2012. The increase was mainly due to higher payment commissions, supported by increased customer activity, and higher commission income from fund management. Compared with the previous quarter net commission income rose by 15 per cent in local currency during the third quarter. Impaired loans continued to decline during the first nine months in all three Baltic countries, but mostly in Latvia. Impaired loans, gross, amounted to SEK 6.3bn (SEK 11.4bn on 30 September 2012). The decrease was mainly due to amortisations, write-offs and loans that have started to perform, while the inflow of new impaired loans was limited. Credit quality has strengthened through a gradual increase in new lending, which carries a lower risk. Net gains and losses on financial items at fair value increased by 9 per cent in local currency, supported by one-off revenue of SEK 17m from a revaluation gain. Expenses increased by 2 per cent in local currency from the previous year, including euro transition costs of SEK 29m in Latvia, which is preparing to adopt the euro on 1 January 2014. The bank’s expenses related to the euro transition are estimated at SEK 90m in 2013. In order to increase efficiencies and improve collaboration, a unified organisational structure is being implemented across the Baltic countries. At the same time the focus is on developing a multichannel strategy based on customer needs and behaviour. The aim is to improve the customer experience, support new business and increase channel efficiencies. Risk-weighted assets decreased by SEK 8bn during the first nine months to SEK 87bn, driven by the corporate portfolio as a result of active portfolio quality management. The number of active customers has increased to nearly 2.6 million in 2013. In the annual Most Loved Brand survey, Swedbank came fifth in the Baltic countries. Swedbank received the highest score among companies which are in full-time contact with their customers and was the only bank in the top 30. Net recoveries amounted to SEK 260m, compared with SEK 356m for the first nine months of 2012. Recoveries Baltic Banking has business operations in Estonia, Latvia and Lithuania. Products and services are sold through the bank’s branch network and digital channels. The various product areas are described on page 20. Swedbank – Interim report January-September 2013 Page 16 of 57
  • 17. Group Functions & Other Income statement SEKm Q3 2013 Q2 2013 Net interest income Net commissions Net gains and losses on financial items at fair value Share of profit or loss of associates Other income Total income 498 31 -343 1 412 599 426 1 -312 0 303 418 17 Staff costs Variable staff costs Other expenses Depreciation/amortisation Total expenses Profit before impairments 797 48 -634 105 316 283 812 51 -604 97 356 62 -2 -6 5 8 -11 Impairment of intangible assets Impairment of tangible assets Credit impairments Operating profit 0 94 -22 211 114 200 0 -252 Tax expense Profit for the period from continuing operations 25 186 3 -255 Profit for the period from discontinued operations, after tax Profit for the period Profit for the period attributable to the shareholders of Swedbank AB -15 171 -1 887 -2 142 171 -2 142 0 0 4 400 4 346 Non-controlling interests Full-time employees Development January-September Income for Group Functions & Other consists of net interest income and net gains and losses on financial items, which mainly come from Group Treasury. Other income primarily consists of revenue from the savings banks as well as sales revenue and operating income from Ektornet. Income amounted to SEK 1 668m (1 301). Expenses for Group Functions & Other decreased by 13 per cent from the previous year to SEK 1 030m (1 180). Excluding the net of services purchased and sold internally, expenses fell by 6 per cent to SEK 5 073m (5 380). The decrease was mainly due to lower costs for IT operations and depreciation as well as lower staff costs following a reduction in staff numbers. Depreciation fell due to a reclassification within Swedbank Finance AB, which at the same time reduced net interest income, as well as lower depreciation in Ektornet. Group Products Established on 1 January 2013, Group Products (GP) consists of around 1 800 employees in Sweden, Estonia, Latvia and Lithuania. GP is responsible for a large part of Swedbank’s product areas with a strategy to support the business areas by reducing the complexity of the product range and simplifying sales in the various distribution channels. The product areas GP is responsible for – cards, payments, lending, deposits, insurance and asset management – are described in more detail on page 20. GP also comprises the subsidiary Swedbank Franchise AB, which in turn includes the real estate and business brokerages and a legal service provider. Swedbank – Interim report January-September 2013 Page 17 of 57 % 10 36 43 Q3 2012 162 31 103 2 348 646 792 64 -796 130 190 456 % Jan-Sep Jan-Sep 2013 2012 -50 18 -7 1 419 7 -773 3 1 012 1 668 105 4 143 3 1 046 1 301 1 -25 -20 -19 66 -38 2 396 172 -1 838 300 1 030 638 2 441 125 -1 808 422 1 180 121 -1 259 20 -157 0 -86 11 91 79 -203 -36 -93 -2 292 -2 213 -3 4 400 5 202 -2 38 -2 -29 -13 -954 1 0 -3 28 -823 -957 -2 214 75 -23 -134 -3 1 -38 114 375 -21 170 -33 -99 -1 97 20 340 173 167 -53 % 5 202 -3 -15 45 -15 In GP’s revenue and expense model, revenue from Swedbank’s customers is posted by each business area and GP receives compensation from the business area to cover its expenses. GP’s external revenue largely comes from the savings banks for the products their customers use. Expenses, excluding the net of services purchased and sold internally, amounted to SEK 2 343m (2 489) for the first nine months of 2013. The decrease was mainly due to lower IT maintenance expenses thanks to increased efficiencies as well as lower mailing costs resulting from increased digitalisation. Group Treasury Group Treasury is responsible for the bank’s funding, liquidity and capital planning, including internal control and pricing within these areas. The Group’s equity is allocated to each business area on the basis of capital adequacy rules and how much capital is needed based on the bank's Internal Capital Adequacy Assessment Process (ICAAP). Group Treasury prices funding and liquidity through an internal interest rate, where the most important parameters are maturity, interest fixing period, currency, and the need for liquidity reserves. Swedbank is conducting a project to further refine internal rate setting control in 2013. Group Treasury’s result over time should be nearly nil, with the exception of earnings that may arise in debt and liquidity management within given risk mandates. The fee paid to the Swedish National Debt Office for government guaranteed funding is charged against Group Treasury. Risk hedging by Group Treasury is generally achieved with financial instruments. The
  • 18. volatility in results over time is largely due to accountingbased fluctuations in these hedges. Net interest income for the first three quarters amounted to SEK 1 518m, compared with SEK 211m in the same period of 2012. Of the SEK 1 307m change, SEK 197m is due to lower fees for the government guaranteed funding. Repurchases of covered bonds in particular and the fact that the bank’s internal prices better reflect its funding costs have positively affected net interest income. Group Treasury’s net interest income has also been strengthened by positions that have benefited from lower market rates. Consequently, net interest income is likely to trend lower going forward as position extensions are made at lower interest rates and spreads. Net gains and losses on financial items at fair value amounted to SEK -783m for the nine-month period, compared with SEK 112m in the previous year. Repurchases of covered and senior bonds reduced net gains and losses on financial items at fair value by SEK 388m. Repurchases of covered and senior bonds carried at fair value have also had a negative effect on the result. The negative effects of the repurchases are offset over time by positive effects on net interest income. Management of the bank’s liquidity portfolio reduced net gains and losses on financial items at fair value by SEK 50m, partly because the surplus values in certain portfolio holdings are declining in pace with their remaining maturities. The liquidity portfolio has an average remaining maturity of about 2 years. Russia and Ukraine The Russian and Ukrainian operations are reported as discontinued operations since the first quarter. During the second quarter the sale of the Ukrainian subsidiary was finalised. The nine-month result for discontinued operations includes a half-year result for the Ukrainian operations of SEK -2 236m. Of this amount, SEK -1 875m, which was reclassified to the income statement during the second quarter, which has not affected Swedbank’s capital, capitalisation or cash flow and will not be taken into account in the Board of Directors’ dividend proposal for 2013. The result for the Russian operations amounted to SEK -63m during the nine-month period. The formal liquidation of the legal entity OAO Swedbank is under way. Swedbank’s net lending in Russia (including leasing) amounted to SEK 1bn as of 30 September. The lending portfolio in Russia, consisting mainly of good quality corporate loans, will decrease through amortisation. Swedbank has real estate assets worth about SEK 123m in Russia, which will be sold. On 1 October the Russian central bank approved Swedbank’s application to revoke Swedbank’s banking licence in Russia. Ektornet Ektornet manages and develops Swedbank’s repossessed assets to recover as much value as possible. The focus going forward is on selling the property holdings. Repossessed assets decreased during the period to SEK 2 772m (SEK 4 606m as of 31 December 2012). Assets taken over SEKm Sweden Finland Estonia Latvia Lithuania USA Ukraine Total properties Shares Total 30 Sep 2013 45 0 192 1 230 178 744 351 2 740 32 2 772 31 Dec 2012 374 281 304 1 665 351 1 217 364 4 556 50 4 606 During the nine-month period properties were sold for SEK 1 925m (1 100) with an aggregate capital gain of SEK 224m (148). The sales of portions of the shareholding produced a capital gain of SEK 82m. Sales proceeds in the third quarter amounted to SEK 424m (255) with a gain of SEK 96m (41). The third quarter sales mainly consisted of a housing complex in the US. Property values in the portfolio were written down by SEK 375m (259), including SEK 94m (97) in the third quarter. The result for the nine-month period was SEK -255m (-335). Expenses amounted to SEK 324m (469). The number of employees at the end of the period was 119, compared with 464 (of which 270 hotel employees) as of 30 September 2012. The number of properties, including apartments and the like, was 1 934 (2 528 at the beginning of the year), of which 1 166 were in Latvia (1 695 at the beginning of the year). Group Functions & Other comprises, in addition to Group Functions, Group Products, the Group Executive Committee and Internal Audit. Group Functions operate across the business areas and serve as strategic and administrative support. The Group Functions are Group IT, Accounting & Finance (including Group Treasury), Risk, Compliance, Public Affairs, HR and Legal. Ektornet and the banking operations in Russia, which are reported as discontinued operations, are included as well. Swedbank – Interim report January-September 2013 Page 18 of 57
  • 19. Eliminations Income statement Q3 2013 Q2 2013 Q3 2012 Net interest income Net commissions Net gains and losses on financial items at fair value Other income Total income -1 26 0 -98 -73 2 20 0 -77 -55 -3 20 0 -47 -30 2 63 0 -234 -169 -5 54 0 -160 -111 Staff costs Variable staff costs Other expenses Depreciation/amortisation Total expenses 0 0 -73 0 -73 0 0 -55 0 -55 0 0 -30 0 -30 0 0 -169 0 -169 0 0 -111 0 -111 SEKm Jan-Sep Jan-Sep 2013 2012 Group eliminations mainly consist of eliminations of internal transactions between Group Functions and the other business areas. Swedbank – Interim report January-September 2013 Page 19 of 57
  • 20. Product areas Swedbank intends to gradually expand its product reporting. This is being done outside the consolidated accounts, which means that in most cases the figures cannot be directly traced to specific items in the financial statements. Responsibility for the product units currently rests with Group Products within Group Functions & Other, but the results are reported in several legal units and in the three business areas. Card business Swedbank issues cards and acquires card payments from merchants in all its home markets as well as in Denmark and Norway. All card operations are handled within the bank, with the exception of the credit card operations in Sweden, Denmark and Norway, which are conducted through Entercard AB, a joint venture with Barclays Bank. In its four home markets as a whole, Swedbank has a market share for card payment acquisitions and issuing of nearly 50 per cent. Swedbank is Europe’s fifth largest card payment acquirer based on number of transactions. As a card payment acquirer, Swedbank enables retailers to accept payment through card terminals and online. Revenue mainly comes from the transaction prices received as compensation for infrastructure, administration and payment guarantees. As a card issuer, the bank generates revenue from fees charged to customers for access to a card, exchange fees for foreign purchases and interest income from outstanding credit card balances. In card payment acquisitions, rapidly expanding e-commerce is one of Swedbank’s most important growth areas. The aim is to be a significant player in the bank’s home markets. In most retail sectors, the growth rate for e-commerce far exceeds that of brick and mortar stores, with home electronics and apparel representing the largest share. Nine of ten Swedish consumers state that they shop online (E-barometern, Posten 2013). E-commerce volume is expected to reach about 10 per cent of retail sales in 2015 (Ehandelsbarometern 2013). Swedbank’s payment acquisition volume in e-commerce increased by over 65 per cent compared with the first three quarters of 2012. When a Swedbank card is used at a point of purchase where Swedbank does not acquire the payments, it receives a commission. Similarly Swedbank pays a commission to other issuers whose cards are used in stores where Swedbank is the payment acquirer. The number of transactions made by card is increasing in all of Swedbank’s home markets due to economic growth and in pace with reduced use of cash. A large share of Swedbank’s transaction revenue is based on the number of transactions, not solely on the transactions’ value. This makes issuing and acquiring revenue less volatile during periods of slower economic growth. Swedbank is the eleventh largest bank card issuer based on number of transactions. In Sweden, nearly 80 per cent of store purchases are made by card, giving it one of the highest levels of card usage in the world. Transaction growth is about 10 per cent per year and volume growth about 5 per cent. In Estonia, the percentage of card transactions is also high (55 per cent), with an annual growth rate of about 8 per cent. In Latvia and Lithuania, card usage is lower (35 and 20 per cent, respectively), but the growth rate is expected to be higher than in Sweden and Estonia. Swedbank – Interim report January-September 2013 Page 20 of 57 Card related income SEKm Card acquiring of which Nordic countries of which Baltic countries Card issuing of which Sweden of which Baltic countries Net interest income, credit cards of which Sweden of which Baltic countries Entercard* Total Card related income Jan-Sep Jan-Sep 2013 2012 590 502 88 1 231 820 411 218 49 169 994 3 033 577 498 80 1 150 781 368 206 47 159 959 2 891 % 2 1 10 7 5 12 6 5 6 4 5 * Swedbank's share of Entercard's total income. Entercard is consolidated into Swedbank Group by the equity method. The positive income trend during the first nine months is mainly due to an increased number of payment acquisition and card issuance transactions as well as higher credit volumes in Entercard. Increased payment acquisition revenue in the Nordic region was also due to a good result for the Norwegian branch and to more ecommerce customers. The stable card issuance revenue in Sweden is the result of transaction volume. The increase in card issuance revenue in the Baltic countries is due to an increased number of transactions and higher annual fees. Lower compensation from card payment acquisitions in the Baltic countries following an adjustment to interbank compensation in 2012 has been partly offset by increased card usage. The increase in the number of acquisition transactions was 11 per cent in Sweden, 6 per cent in Estonia, 16 per cent in Latvia and 18 per cent in Lithuania. The rate of increase is expected to continue this year. In terms of acquisition volume, the Nordic countries account for about 90 per cent, although growth is higher in the Baltic countries. Income is not growing at the same pace as the volume of acquired payments or the number of acquired transactions because of price pressure from increased competition and tighter regulations. The expansion of the payment business to Norway and Denmark now generates 2.6 per cent of transactions and 7.1 per cent of income. The number of card purchases increased during the first nine months by 12 per cent. The largest increases in percentage terms were in Latvia and Lithuania (19 and 17 per cent). In card issuance, the biggest growth opportunity is in corporate cards, where the bank has historically been weaker and where small business customers offer significant potential. Key ratios, cards Card acquiring transactions, millions Card acquiring volume, SEKbn Issued cards, millions Card purchases (POS), millions POS/total card turnover, % Jan-Sep Jan-Sep 2013 2012 1 310 323 7.8 887 65 1 176 295 7.8 793 63 % 11 9 1 12
  • 21. Proposal to cap interchange fees for card transactions In July the EU Commission presented a proposal to cap the interchange fees paid by payment acquirers to card issuers. The draft regulation can take effect no earlier than the second quarter of 2014, provided that the draft is adopted without revisions. For Swedbank’s card issuance business it will mean lower revenue, and at the same time expenses in the card payment acquiring business will decrease. The credit card business will be affected more than the bank card business, since interbank compensation there is higher. The effect on the Swedish operations is limited, but more significant in the Baltic countries due to the currently higher level of interbank compensation. The total impact for Swedbank depends on pricing competition between payment acquiring services. Insurance business Swedbank has life insurance operations in all its home markets and non-life operations in the Baltic countries. Non-life insurance is offered in Sweden through a thirdparty solution with the insurance company Tre Kronor. Insurance products are sold through the distribution channels of Swedbank and the savings banks. Premium payments SEKm Sweden of which collective occupational pension of which endowment insurance of which occupational pension of which risk insurance of which other Baltic countries of which life insurance of which non-life insurance Jan-Sep Jan-Sep 2013 2012 % 10 730 9 953 8 2 986 5 290 1 479 504 470 3 250 4 470 1 297 476 461 -8 18 14 6 2 750 463 287 717 445 272 5 4 5 Sweden The Group’s Swedish life insurance company is the sixth largest company in the Swedish market, with a market share of about 7 per cent in terms of premium payments. Premium income rose by 8 per cent to SEK 10.7bn during the nine-month period. In savings products, the biggest increase was in endowment insurance for the corporate market, where time has been devoted to informing about, and providing training on, the products. Over 72 000 of Swedbank’s risk protection policies were sold during the period, an increase of 15 per cent yearon-year. Due to an ageing population and shift in responsibility from society to the individual, demand for pension and insurance products is expected to grow. The largest potential for Swedbank in Sweden today is in risk products such as life and health insurance as well as in occupational pensions. Today only 20 per cent of Swedbank’s and the savings banks’ corporate customers with revenues of SEK 1-100m have an occupational pension solution for their employees from Swedbank Försäkring. Premium income from occupational pensions amounted to SEK 4.5bn (4.5) during the period, of which occupational pensions excluding collective pensions increased by 14 per cent year-on-year to SEK 1 479bn. Since 1 July Swedbank Försäkring is a company of choice for the collectively negotiated occupational Swedbank – Interim report January-September 2013 Page 21 of 57 pension plan (ITP). The fees for ITP are low, but it is important for the bank to be able to offer collective occupational pensions as part of a total offering to the 1.5 million private sector employees. Swedbank Försäkring offers 22 funds with the highest aggregate ratings of the companies. Half of the funds are from Robur. Swedbank’s priorities for 2013 include simplifying processes and routines and improving efficiencies. For example, administrative paperwork has now been completely digitised, and simplified risk rules have made it easier and more expedient to manage customers. An automated sales workflow for risk protection insurance means that 75 per cent of cases can be processed at the time of sale. Baltic countries In Estonia, Latvia and Lithuania, the market shares for life insurance as of 31 August were 37, 15 and 22 per cent, respectively, making Swedbank the largest life insurer in Estonia and Lithuania. Life insurance operations are divided into risk insurance and savings products. Swedbank mainly focuses on risk insurance for existing loan customers in the retail banking market, where it sees great opportunities to promote sound and sustainable finances due to the limited social welfare system in the Baltic countries. The sale of risk insurance to loan customers in Baltic Banking have been successful. During the period sales of credit life, a life insurance product tied to a bank loan, increased by 5 per cent in local currency and now amount to SEK 52m. Around 32 per cent of the bank’s borrowers currently have credit life insurance. From January to September premium payments for the total Baltic life insurance operations rose by 6 per cent in local currency to SEK 463m year-on-year. The market shares for non-life insurance in Estonia, Latvia and Lithuania are 14, 3 and 1 per cent, respectively. In non-life insurance, Swedbank mainly offers solutions for private customers. The largest product areas are auto and home insurance, which are offered together with leasing and mortgages. Since auto and home sales have fallen in recent years, the focus has been on boosting sales by launching new and simpler products. One example is loan payment protection, which covers loan expenses in the event of an illness or job loss. Another is the sale of home insurance through bank branches, which was launched in Lithuania during the summer. This was already being offered in Estonia and Latvia. Total premium income for non-life insurance in the Baltic countries amounted to SEK 287m during the period, an increase of 7 per cent in local currency. Assets under management SEKbn Sweden of which collective occupational pension of which endowment insurance of which occupational pension of which other Baltic countries of which life insurance 30 Sep 2013 31 Dec 2012 % 113.8 103.0 10 45.2 48.7 11.6 8.4 3.3 3.3 39.3 45.8 10.0 8.1 3.2 3.2 15 6 16 4 2 2 Assets under management in Sweden increased by 10 per cent during the first nine months of 2013 to SEK 113.8bn, of which SEK 99.7bn relates to unit linked and
  • 22. deposit insurance. The increase is partly due to favourable market conditions with rising fund and equity prices and partly to a positive net inflow. The net inflow consists of receipts in the form of premiums and disbursements in the form of pensions, cancellations and repurchases. Assets under management in the Baltic life insurance company decreased by 0.4 per cent in local currency to SEK 3.3bn, of which SEK 1.9bn is unit linked insurance. The decrease relates to traditional management, where the portfolio decreased during the last quarter of 2012 owing to large pension disbursements. Insurance related income SEKm Jan-Sep Jan-Sep 2013 2012 Sweden of which life insurance of which non-life insurance Baltic countries of which life insurance of which non-life insurance Total insurance related income 1 101 1 049 52 258 134 124 1 359 % 1 099 0 1 066 -2 33 54 312 -17 156 -14 157 -21 1 412 -4 Revenue Swedbank’s aggregate insurance revenue amounted to SEK 1 359m (1 412) during the nine-month period. The decrease in Swedish life insurance was mainly due to falling interest rates, which meant a lower return on equity. On the other hand, revenue for the Swedish nonlife business rose. There are now nearly 218 000 policies, an increase of 9 per cent year-on-year. Revenue for the Baltic life and non-life businesses decreased. In this case as well, falling interest rates meant a lower return on the assets, primarily for the life insurance business, where the risk result at the same time was stable. Revenue for the Baltic non-life business fell by 20 per cent in local currency to SEK 124m at the end of the period. The decrease was mainly due to a lower risk result owing to higher claims than in the previous year. Claims during the period are in line with the average for previous years, while the level of claims in the previous year was relatively low. Asset management operations Swedbank’s asset management operations are conducted through the Swedbank Robur group in Swedbank’s four home markets and Norway. In total, Swedbank Robur offers around 120 funds as well as discretionary asset management, including management of pension assets. Fund assets under management amounted to SEK 581bn at the end of the period, of which SEK 560bn was in Sweden, where the market share was 24 per cent in terms of assets under management. Discretionary assets under management amounted to SEK 266bn. Most of the total net inflow to the Swedish fund market, consisted of equity, mixed and short-term fixed income funds. Long-term fixed income funds saw a net outflow. The total net inflow to Swedbank Robur’s funds in Sweden was SEK 6bn, giving it a market share of 10 per cent. The positive net flow was mainly due to a high level of activity at Swedbank’s and the savings banks’ branches, where flows mainly went to investment solutions (mixed funds) and short-term fixed income funds. Measures to clarify and simplify the customer offering are continuing in 2013. Swedbank – Interim report January-September 2013 Page 22 of 57 Asset management Key ratios, SEKbn Total income, SEKm Asset under management of which Sweden of which Baltics of which Norway Discretionary asset management of which Sweden of which Baltics Jan-Sep Jan-Sep 2013 2012 % 3 003 2 747 9 581 475 22 560 457 22 19 16 15 2 2 22 266 283 -6 264 282 -6 2 1 100 Income from capital market products amounted to SEK 3 003m during the nine-month period, 9 per cent higher year-on-year. The improvement was mainly from an increase in average capital as a result of higher equity prices, but also from the positive net flows. Excluding the Folksam LO funds consolidated in the fourth quarter of 2012, average fund assets grew by 10.6 per cent. Compared with the previous quarter, income rose by SEK 21m during the third quarter. Income was positively affected by the market’s performance. Average assets under management climbed 2.1 per cent during the quarter. Income from institutional management, excluding Swedbank Robur’s funds, amounted to SEK 67m during the period, a decrease of SEK 31m compared with the first nine months of 2012.The decrease was mainly because the Folksam LO funds are managed by Swedbank Robur since the fourth quarter 2012. Payment operations Swedbank is the leader in payment and cash management products in its four home markets. Growth in the payment area is based on economic growth and on customers’ increasing use of payment means other than cash. The payment area is strongly affected by changes in the operating environment. Rapid technological development is increasing competition primarily from ecommerce companies at the same time that unified European legislation facilitates cross-border trade in products and services. The development of a common payment zone for the euro enables the bank to offer services to customers with eurozone operations without having to set up business in every country. Online payment services are an important growth area for Swedbank. Today over 2.9 million customers in Sweden and 2.1 million in the Baltic countries have access to payment services through the Internet Bank and the Mobile Bank. During the first nine months of 2013 the number of internet banking transactions grew by 8 per cent year-on-year. In Sweden, Swedbank introduced mobile BankID in autumn 2012 to facilitate payments through the Internet Bank and the Mobile Bank. The number of users is over 570 000. Swish, a solution shared with other Swedish banks to send and receive money by mobile phone, has over 540 000 users, more than 200 000 of which are customers of Swedbank and the savings banks. When doing business abroad, companies face very different risks than at home. Trade Finance gives importers and exporters the opportunity to mitigate financial risk and improve liquidity in markets where normal means of payment do not work. This area of
  • 23. business is shrinking as these markets mature. The principal products are cash against documents (CAD), letters of credit and bank guarantees. Customers increasingly demand customised solutions and new ways to improve liquidity. In times of crisis demand tends to grow for Trade Finance products. It also increases when companies enter new markets. One challenge to the bank’s Trade Finance offering is the new payment and financing solutions arranged between importers and exporters (Open Account and Supply Chain Finance), which in recent years have accounted for a larger share of growing global trade. Payments Key figures International payments (millions) of which Sweden of which Baltic countries Domestic payments (millions) of which Sweden of which Baltic countries E-services payments (millions) of which Sweden of which Baltic countries Trade Finance, new deals of which Sweden of which Baltic countries Factoring portfolio, SEKm of which Sweden of which Baltic countries Jan-Sep Jan-Sep 2013 2012 7.4 3.3 4.1 639.7 461.1 178.6 133.0 116.4 16.6 16 329 6 877 9 452 4 227 2 201 2 026 % 6.8 3.1 3.7 605.5 439.3 166.3 81.4 66.7 14.7 17 479 7 483 9 996 3 996 2 207 1 789 9 6 11 6 5 7 63 75 13 -7 -8 -5 6 0 13 Domestic payments include salary and mass payments, giro payments, direct debit payments, internet payments. E-services payments includes E-invoices, Bank link payments, Mobile phone top-up transactions, number of signing-transactions and ID-transactions through E-ID/BankID. Since Bankomat AB took over responsibility for Swedbank’s ATMs, Swedbank pays Bankomat AB a commission, which explains the lower net commission income. For more information, see Retail on page 12. Payments Income, SEKm Net commission income of which Nordic countries of which Baltic countries Jan-Sep Jan-Sep 2013 2012 737 367 370 Swedbank – Interim report January-September 2013 867 514 352 % -15 -29 5 Page 23 of 57 Lending/deposits Swedbank’s lending operations are concentrated in Sweden, Estonia, Latvia and Lithuania. In addition, lending is provided in Norway and to a lesser extent in certain other countries such as Finland, Denmark and the US. Loan products account for about 70 per cent of Swedbank’s assets on the balance sheet. Swedbank’s total private and corporate lending amounts to SEK 1 195bn (1 184 as of 31 December 2012). The large part consists of household lending, with mortgages to Swedish private customers and tenant-owner associations accounting for about 50 per cent of the total. Swedbank’s market share for Swedish mortgages is 25 per cent. Over one million customers obtain their mortgages through Swedbank Mortgage, and lending is geographically distributed throughout the country. Swedbank is also a major player in corporate lending in Sweden, with lending of SEK 428bn and a market share of 17 per cent. Major sectors in Sweden include property-related lending, which accounts for SEK 158bn, and the forestry and agricultural sector, where Swedbank has a dominant position, accounting for SEK 68bn. Swedbank is the largest lender in the Baltic countries, with market shares of 20-40 per cent. Estonia accounts for nearly half of Swedbank’s Baltic loan portfolio, and there Swedbank has a market share of nearly 40 per cent. Total lending in the Baltic countries amounts to SEK 117bn, half of which is to households and half to corporates. Major sectors for corporate lending in the Baltic countries include commercial real estate and manufacturing. Swedbank is also a dominant player in deposits in its home markets. Total deposit volume as of 30 September amounted to SEK 592bn (558), of which SEK 335bn (332) was to private customers and SEK 257bn (226) to corporate customers. About 81 per cent of Swedbank’s total deposit volume was in its Swedish operations. For more information on Swedbank’s lending and deposit, see each business area.
  • 24. Financial information - contents Group Page Income statement, condensed 26 Statement of comprehensive income, condensed 27 Key ratios 27 Balance sheet, condensed 28 Statement of changes in equity, condensed 29 Cash flow statement, condensed 30 Notes Note 1 Accounting policies 30 Note 2 Critical accounting estimates 32 Note 3 Changes in the Group structure 32 Note 4 Operating segments (business areas) 33 Note 5 Net interest income 35 Note 6 Net commissions 36 Note 7 Net gains and losses on financial items at fair value 37 Note 8 Other expenses 38 Note 9 Credit impairments 38 Note 10 Loans 39 Note 11 Impaired loans etc. 40 Note 12 Assets taken over for protection of claims and cancelled leases 40 Note 13 Credit exposures 40 Note 14 Intangible assets 41 Note 15 Amounts owed to credit institutions 42 Note 16 Deposits from the public 42 Note 17 Debt securities in issue 42 Note 18 Derivatives 43 Note 19 Financial instruments carried at fair value 43 Note 20 Pledged collateral 46 Note 21 Offsetting financial assets and liabilities 46 Note 22 Capital adequacy 47 Note 23 Risks and uncertainties 49 Note 24 Discontinued operations 49 Note 25 Related-party transactions 49 Note 26 Swedbank’s share 50 Note 27 Effects of changes in accounting policies 51 Parent company Income statement, condensed 53 Statement of comprehensive income, condensed 53 Balance sheet, condensed 54 Statement of changes in equity, condensed 55 Cash flow statement, condensed 55 Capital adequacy 56 More detailed information can be found in Swedbank’s fact book, www.swedbank/se/ir, under Financial information and publications. Swedbank – Interim report January-September 2013 Page 24 of 57
  • 25. Income statement, condensed Group SEKm Q3 2013 Q2 2013 % Q3 2012 % Interest income Interest expenses Net interest income (note 5) 10 867 -5 226 5 641 11 113 -5 704 5 409 -2 -8 4 12 443 -7 358 5 085 -13 -29 11 33 049 -16 646 16 403 38 765 -23 750 15 015 -15 -30 9 Commission income Commission expenses Net commissions (note 6) 3 683 -1 163 2 520 3 632 -1 107 2 525 1 5 0 3 344 -969 2 375 10 20 6 10 735 -3 302 7 433 10 060 -2 948 7 112 7 12 5 170 296 -43 687 -75 1 023 2 243 -54 376 -247 129 419 -275 144 -10 -10 -10 380 -233 147 -1 6 -12 1 293 -827 466 1 308 -840 468 -1 -2 0 Share of profit or loss of associates Other income Total income 240 525 9 225 197 408 8 979 22 29 3 225 452 8 971 7 16 3 643 1 318 27 286 644 1 349 26 831 0 -2 2 Staff costs Other expenses (note 8) Depreciation/amortisation Total expenses Profit before impairments 2 328 1 488 179 3 995 5 230 2 391 1 567 168 4 126 4 853 -3 -5 7 -3 8 2 229 1 490 201 3 920 5 051 4 0 -11 2 4 7 077 4 569 518 12 164 15 122 6 974 4 801 643 12 418 14 413 1 -5 -19 -2 5 0 95 170 202 -53 -1 102 -7 170 382 3 266 44 -56 5 191 88 4 393 18 36 4 914 6 92 14 478 -109 14 253 2 998 913 9 1 216 -18 2 887 3 371 -14 7 Net gains and losses on financial items at fair value (note 7) Insurance premiums Insurance provisions Net insurance Impairment of intangible assets (note 14) Impairment of tangible assets Credit impairments (note 9) Operating profit Tax expense Profit for the period from continuing operations Jan-Sep Jan-Sep 2013 2012 % 4 193 3 480 20 3 698 13 11 591 10 882 -15 -1 887 -99 -203 -93 -2 292 -823 Profit for the period Profit for the period attributable to the shareholders of Swedbank AB of which profit for the period from continuing operations of which profit for the period from discontinued operations 4 178 1 593 3 495 20 9 299 10 059 -8 4 172 4 187 -15 1 592 3 478 -1 886 3 495 3 695 -200 19 13 -93 9 289 11 581 -2 292 10 052 10 872 -820 -8 7 Non-controlling interests of which profit for the period from continuing operations of which profit for the period from discontinued operations 6 6 0 1 2 -1 0 3 -3 100 10 10 0 7 10 -3 43 0 Profit for the period from discontinued operations, after tax Swedbank – Interim report January-September 2013 Page 25 of 57 20 -99