Download as PDF, PPTX

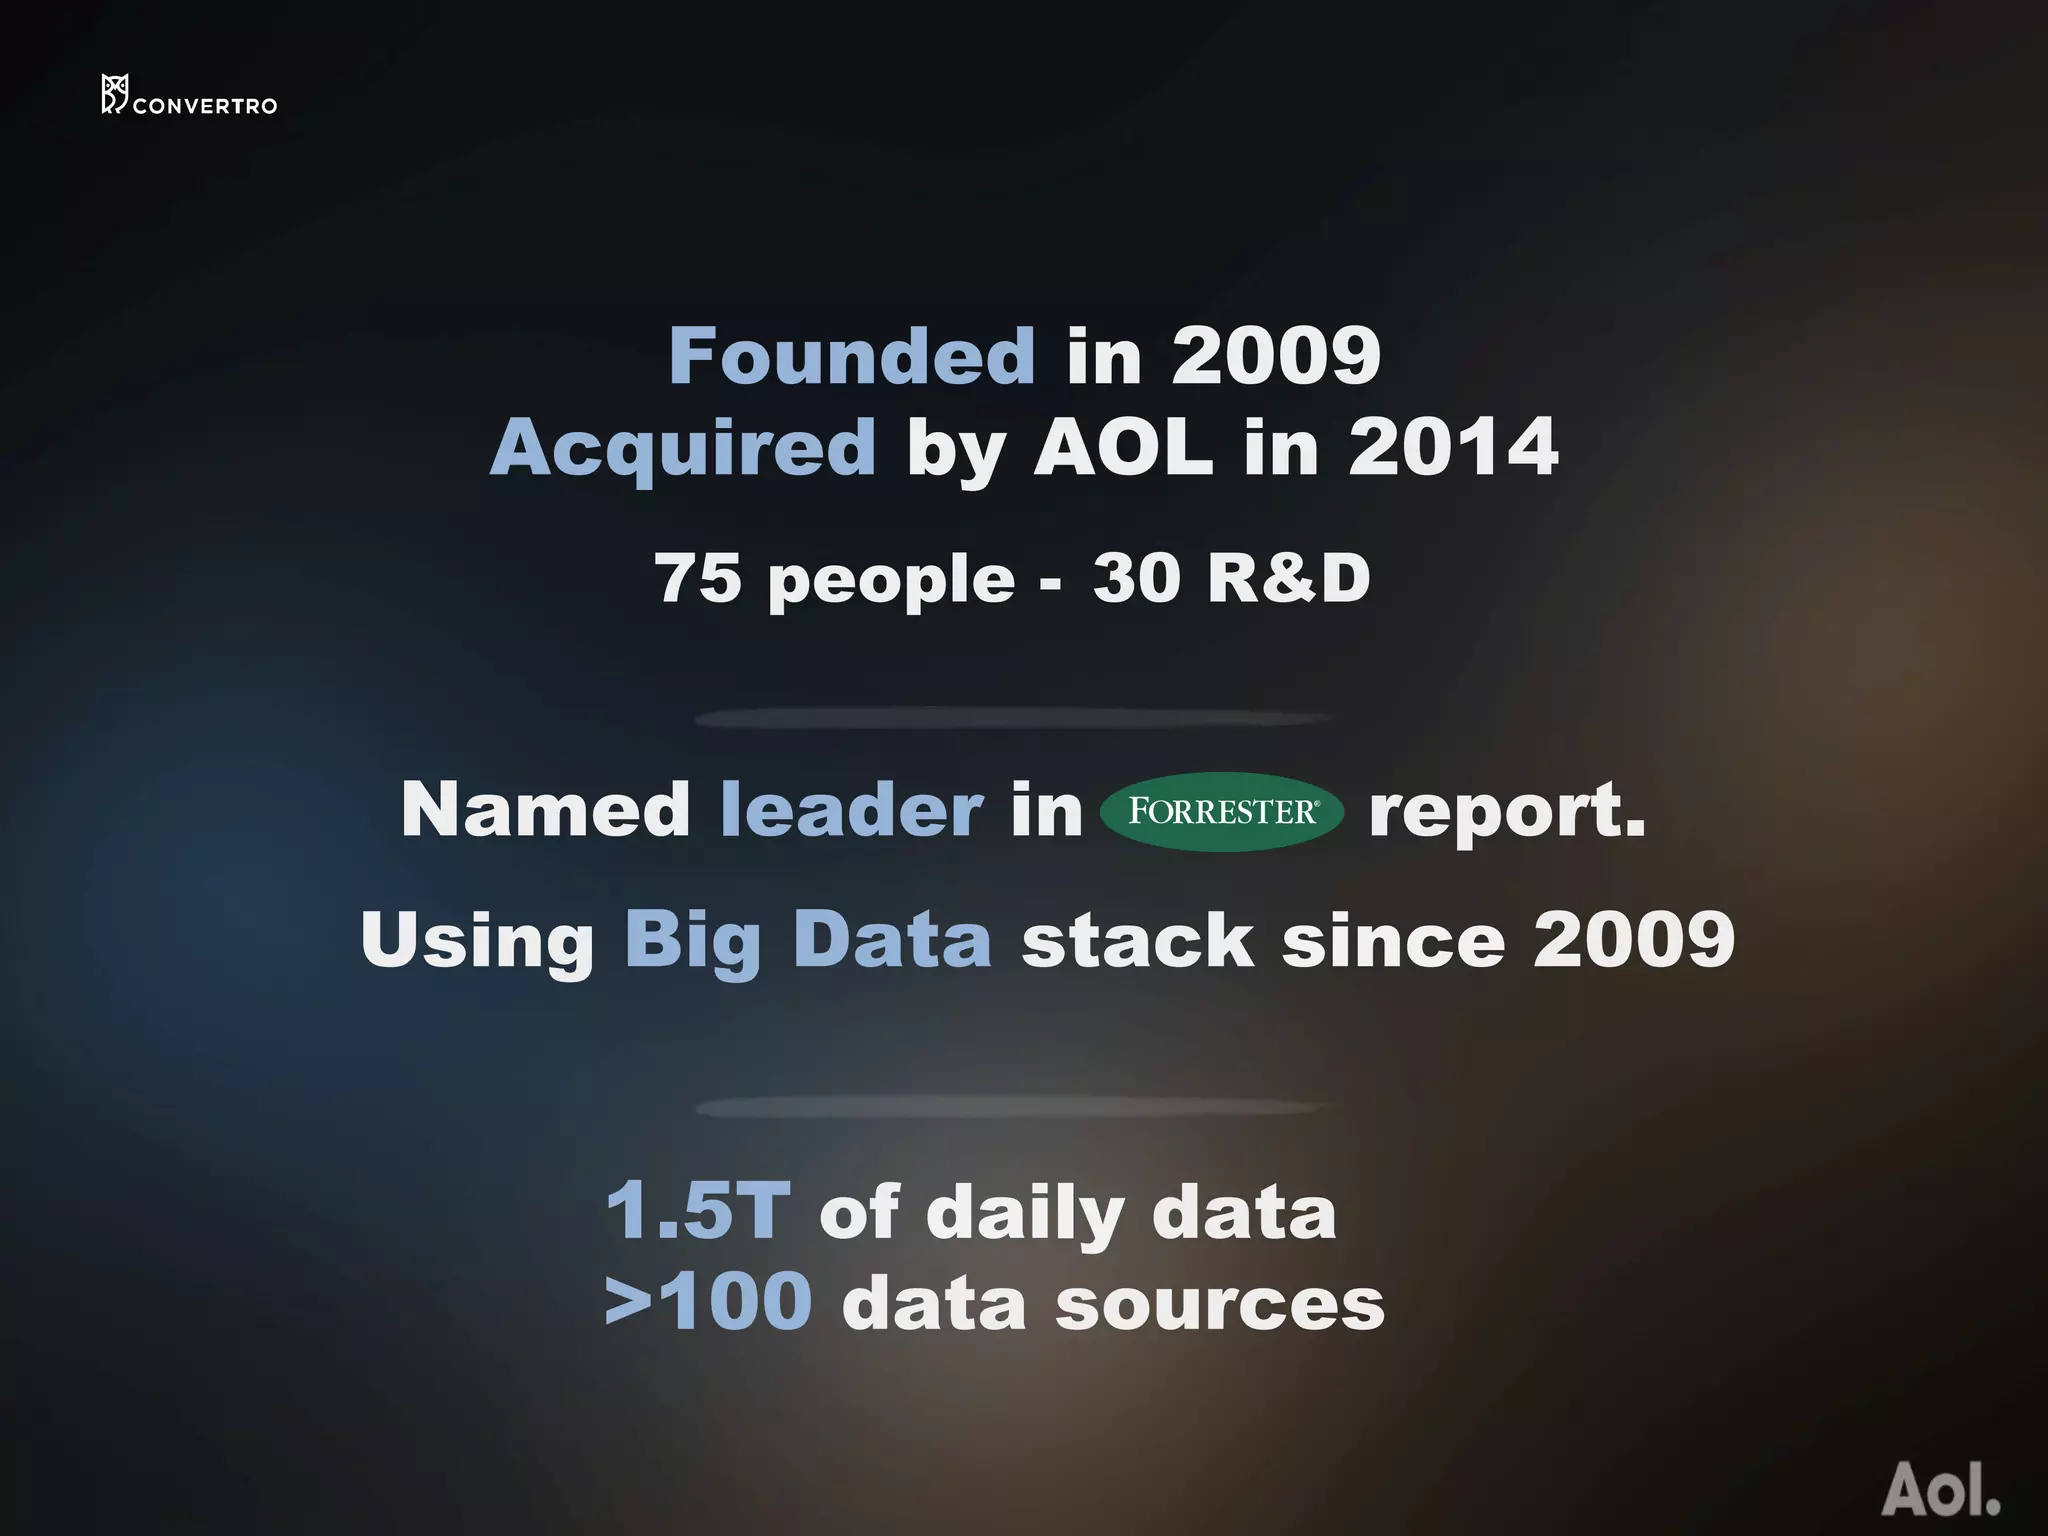
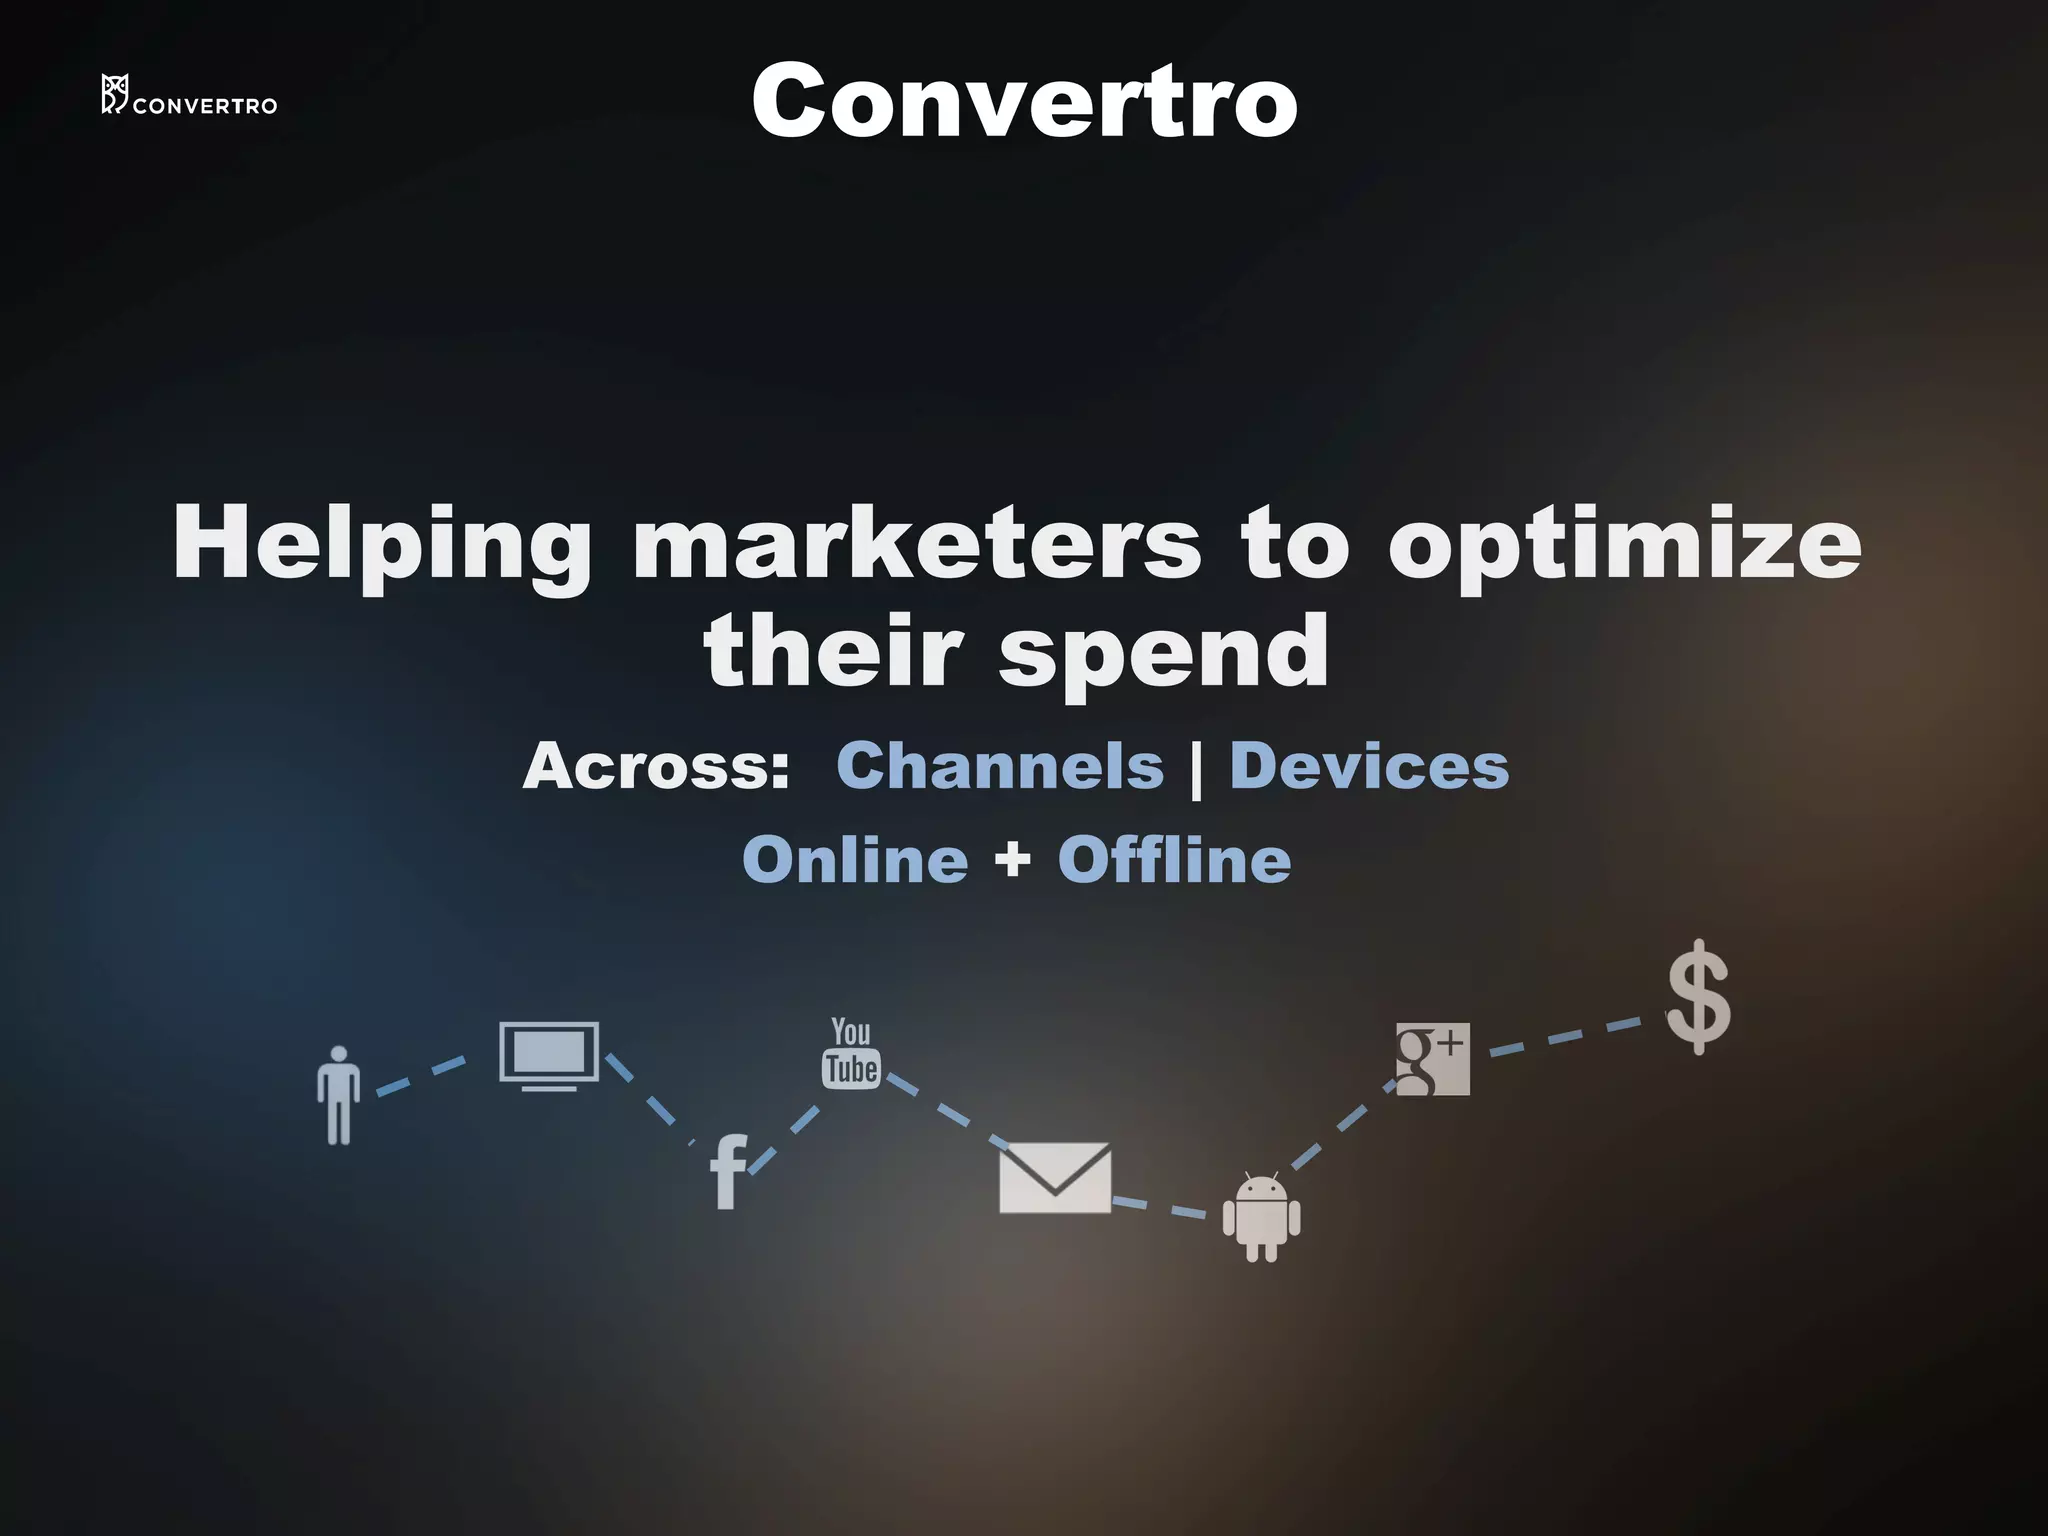
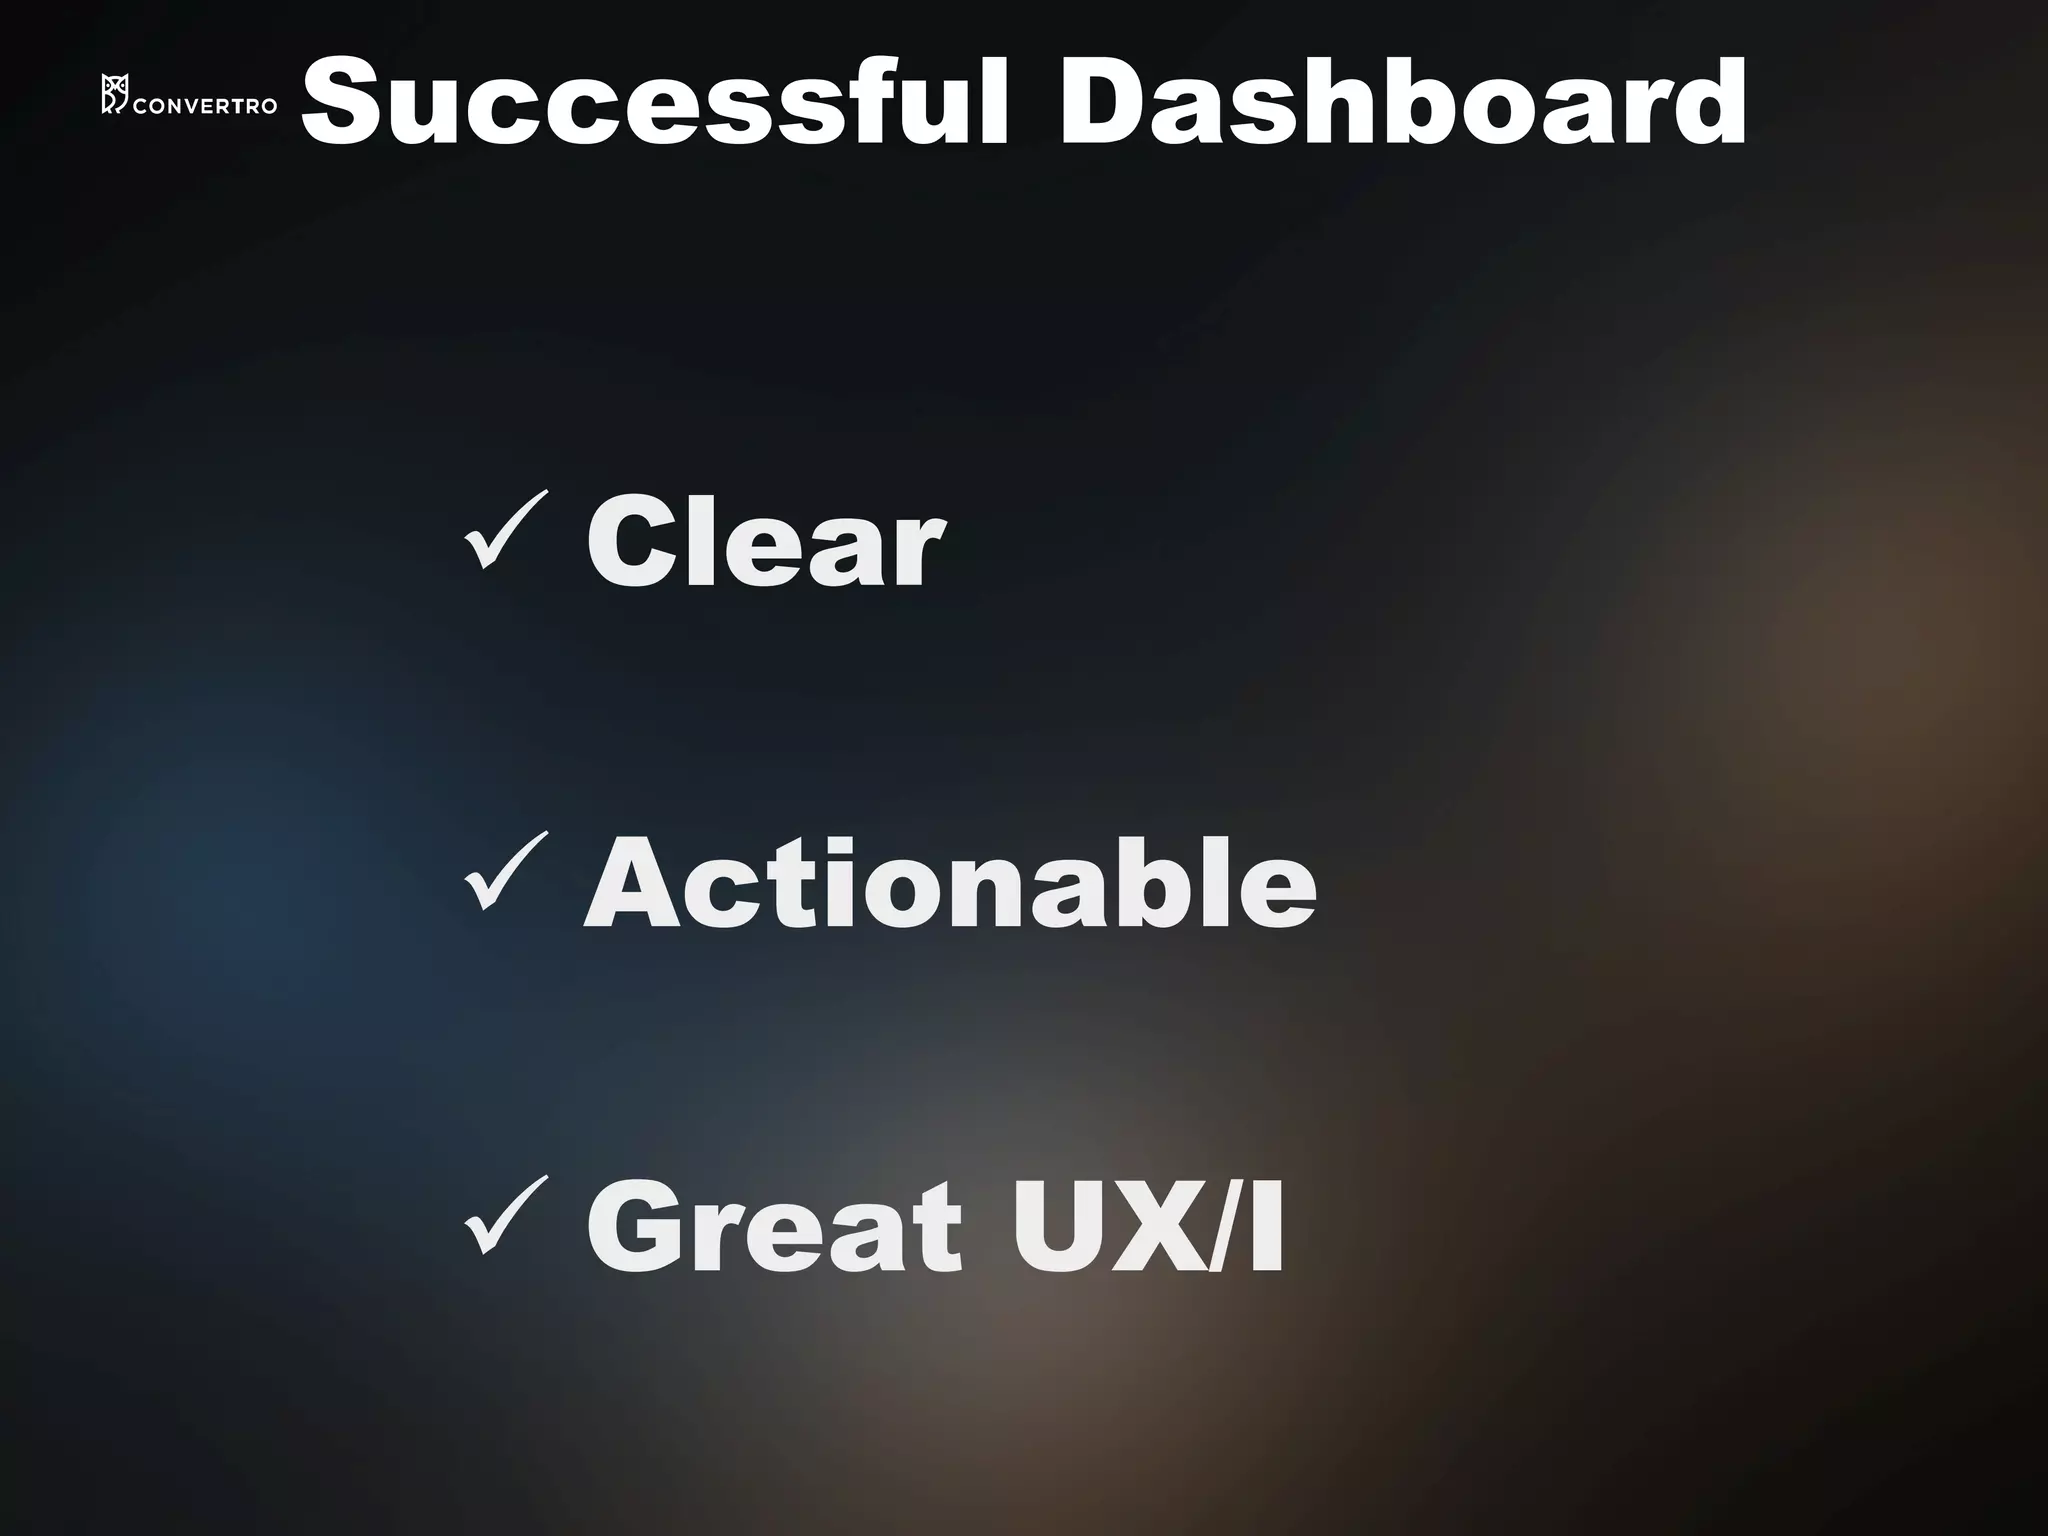
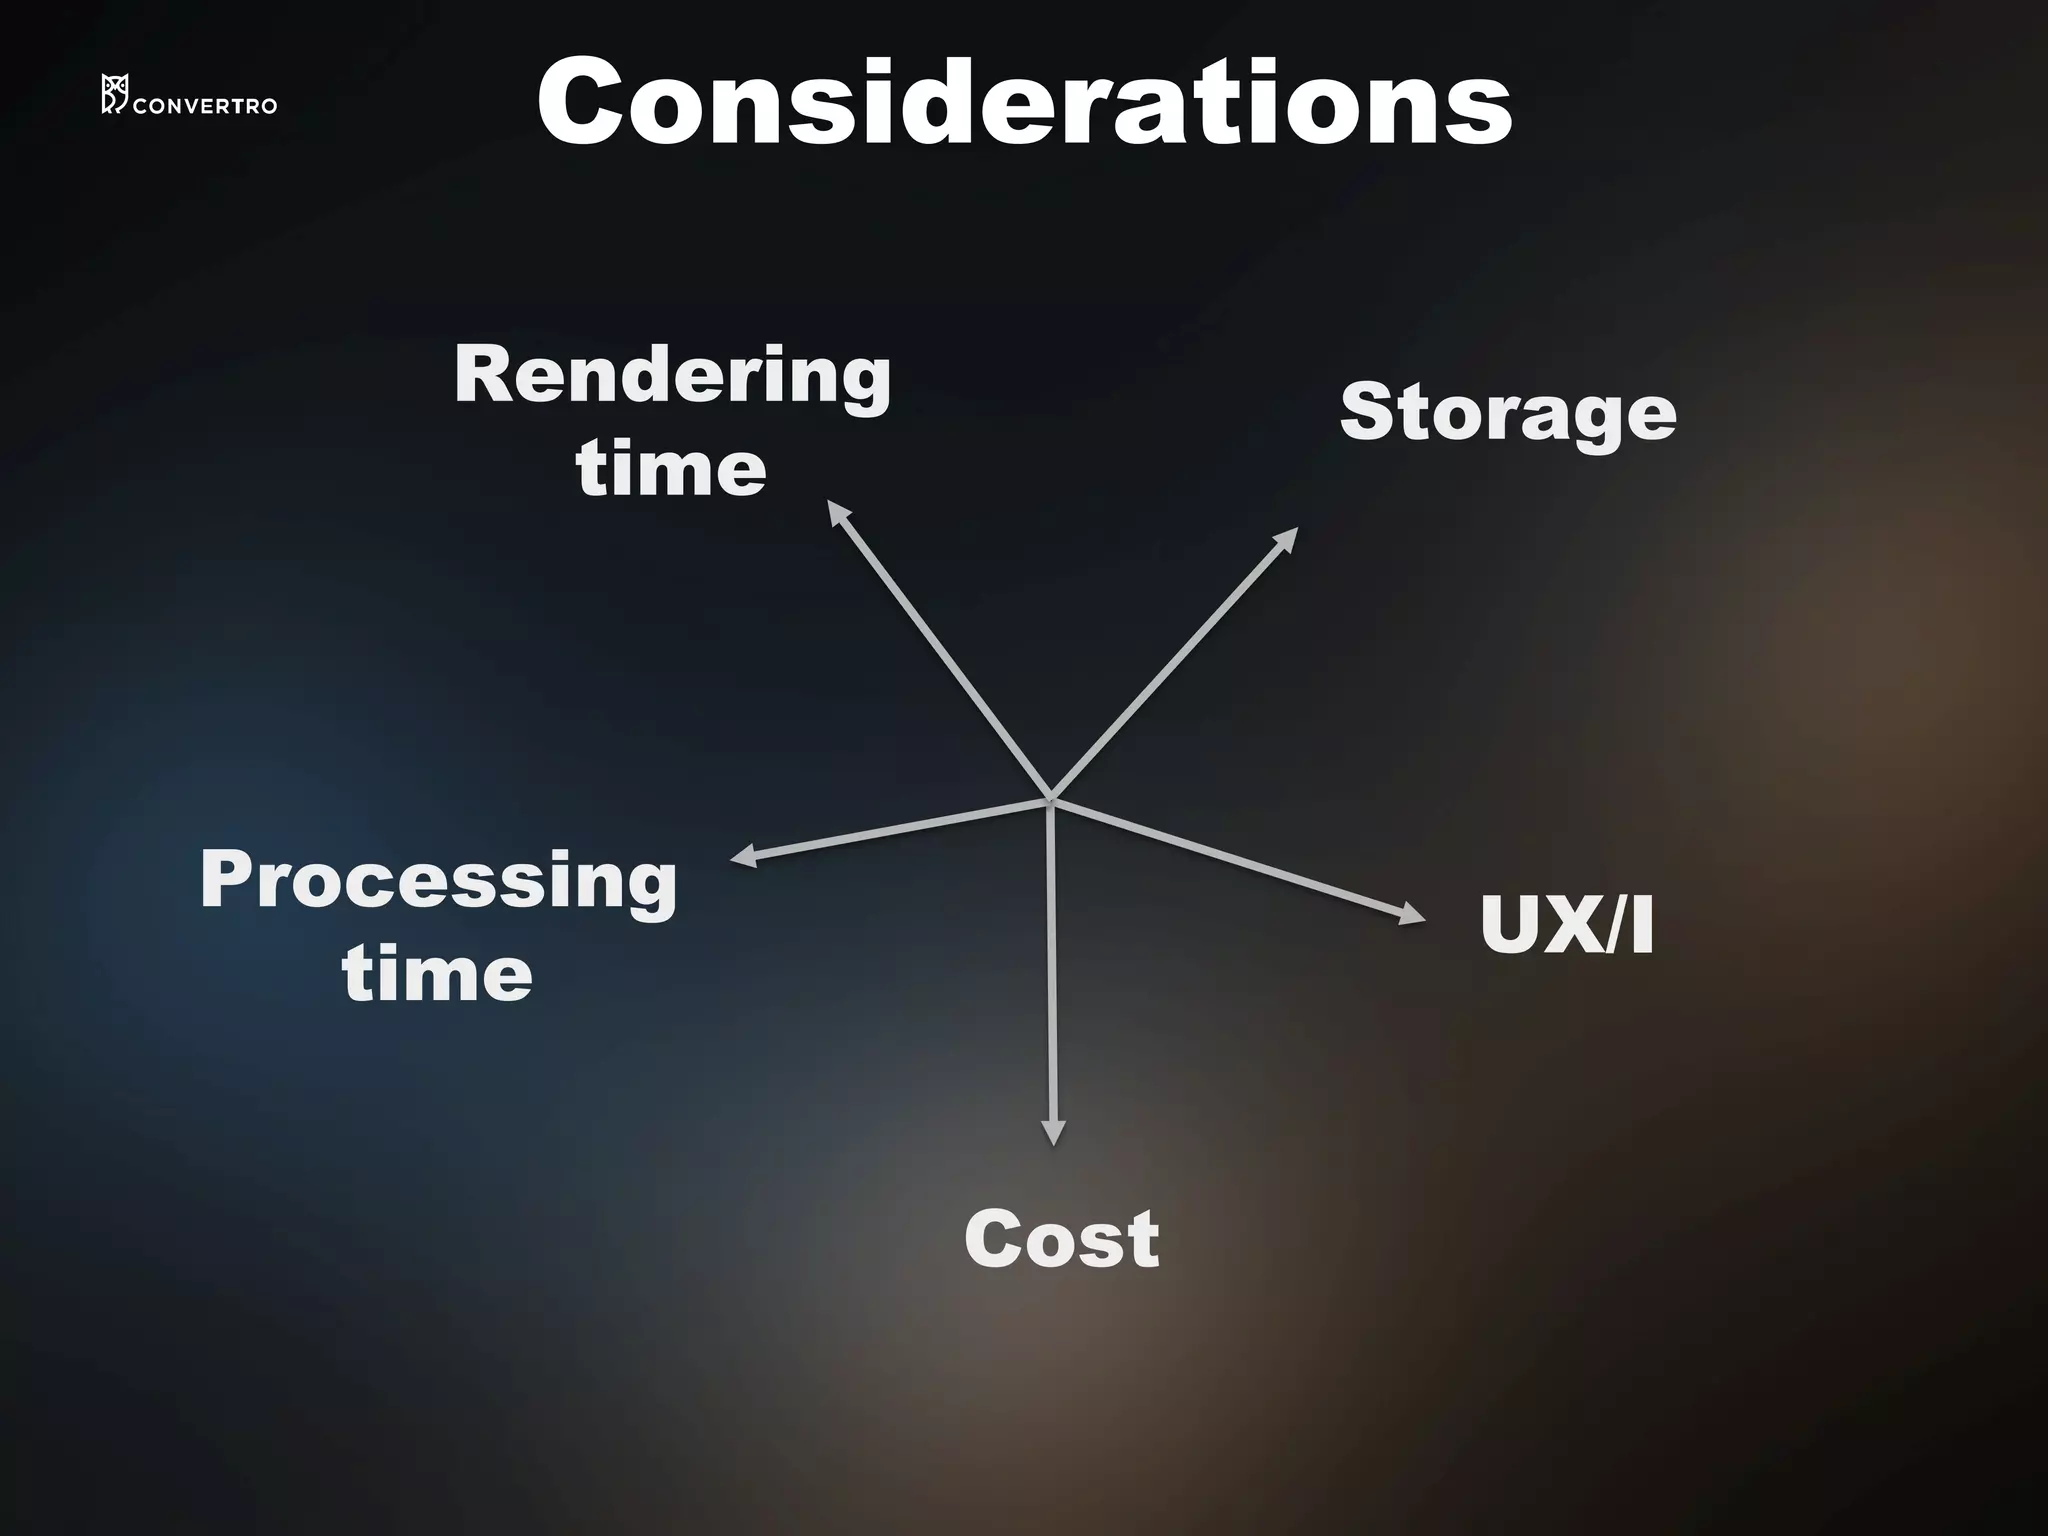
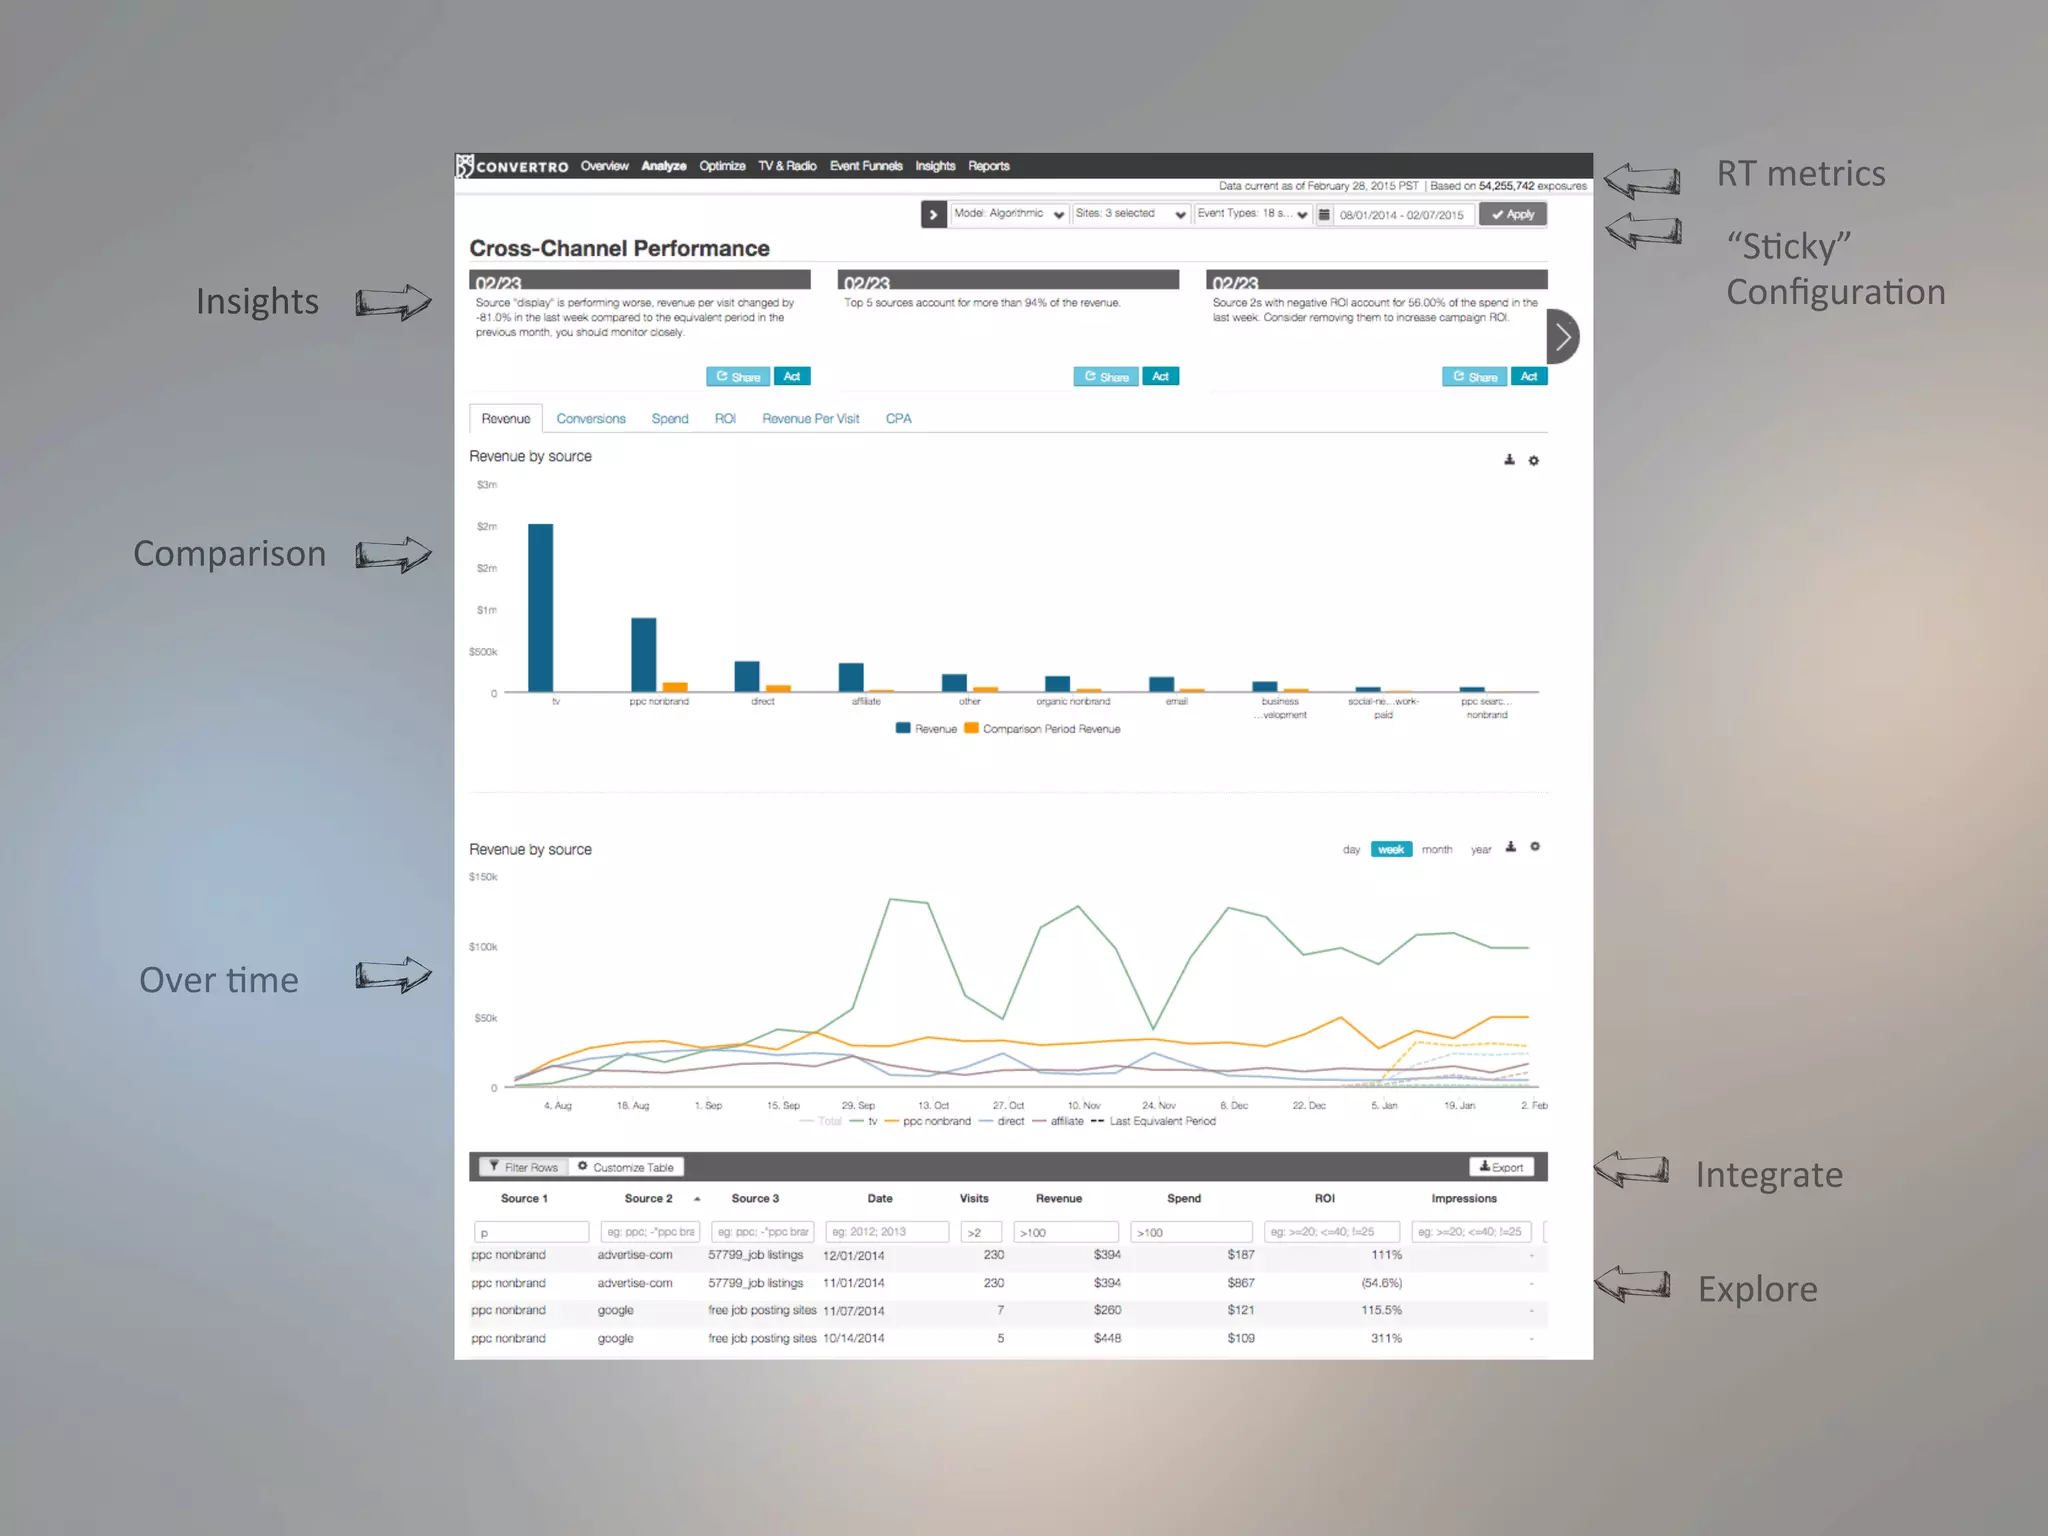

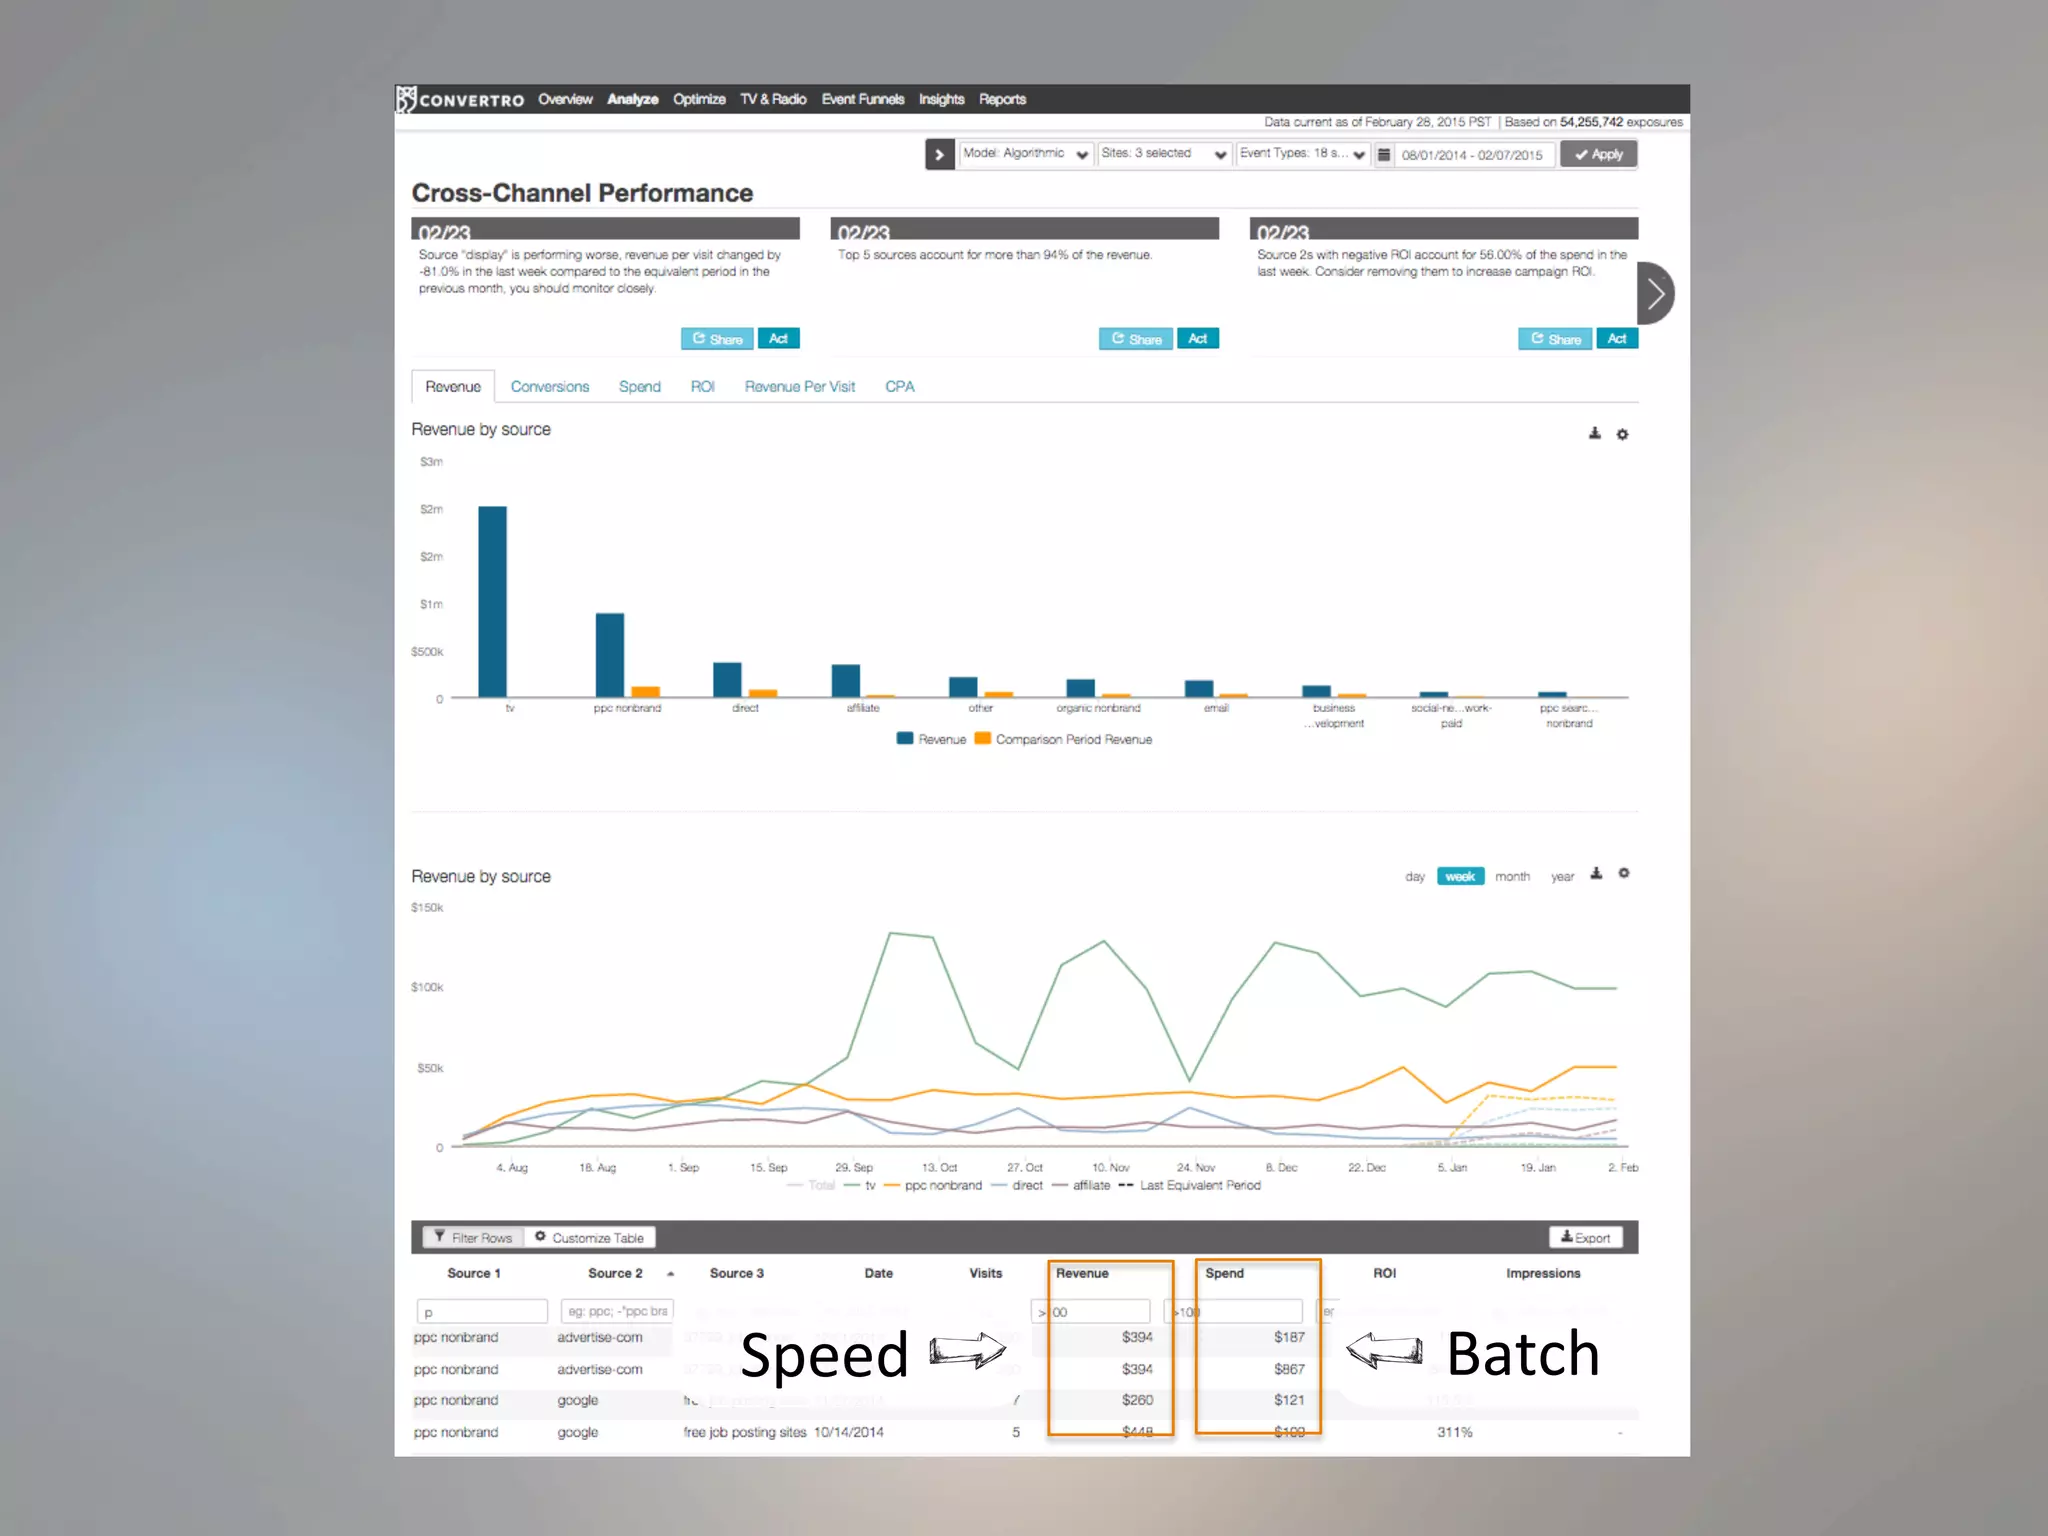


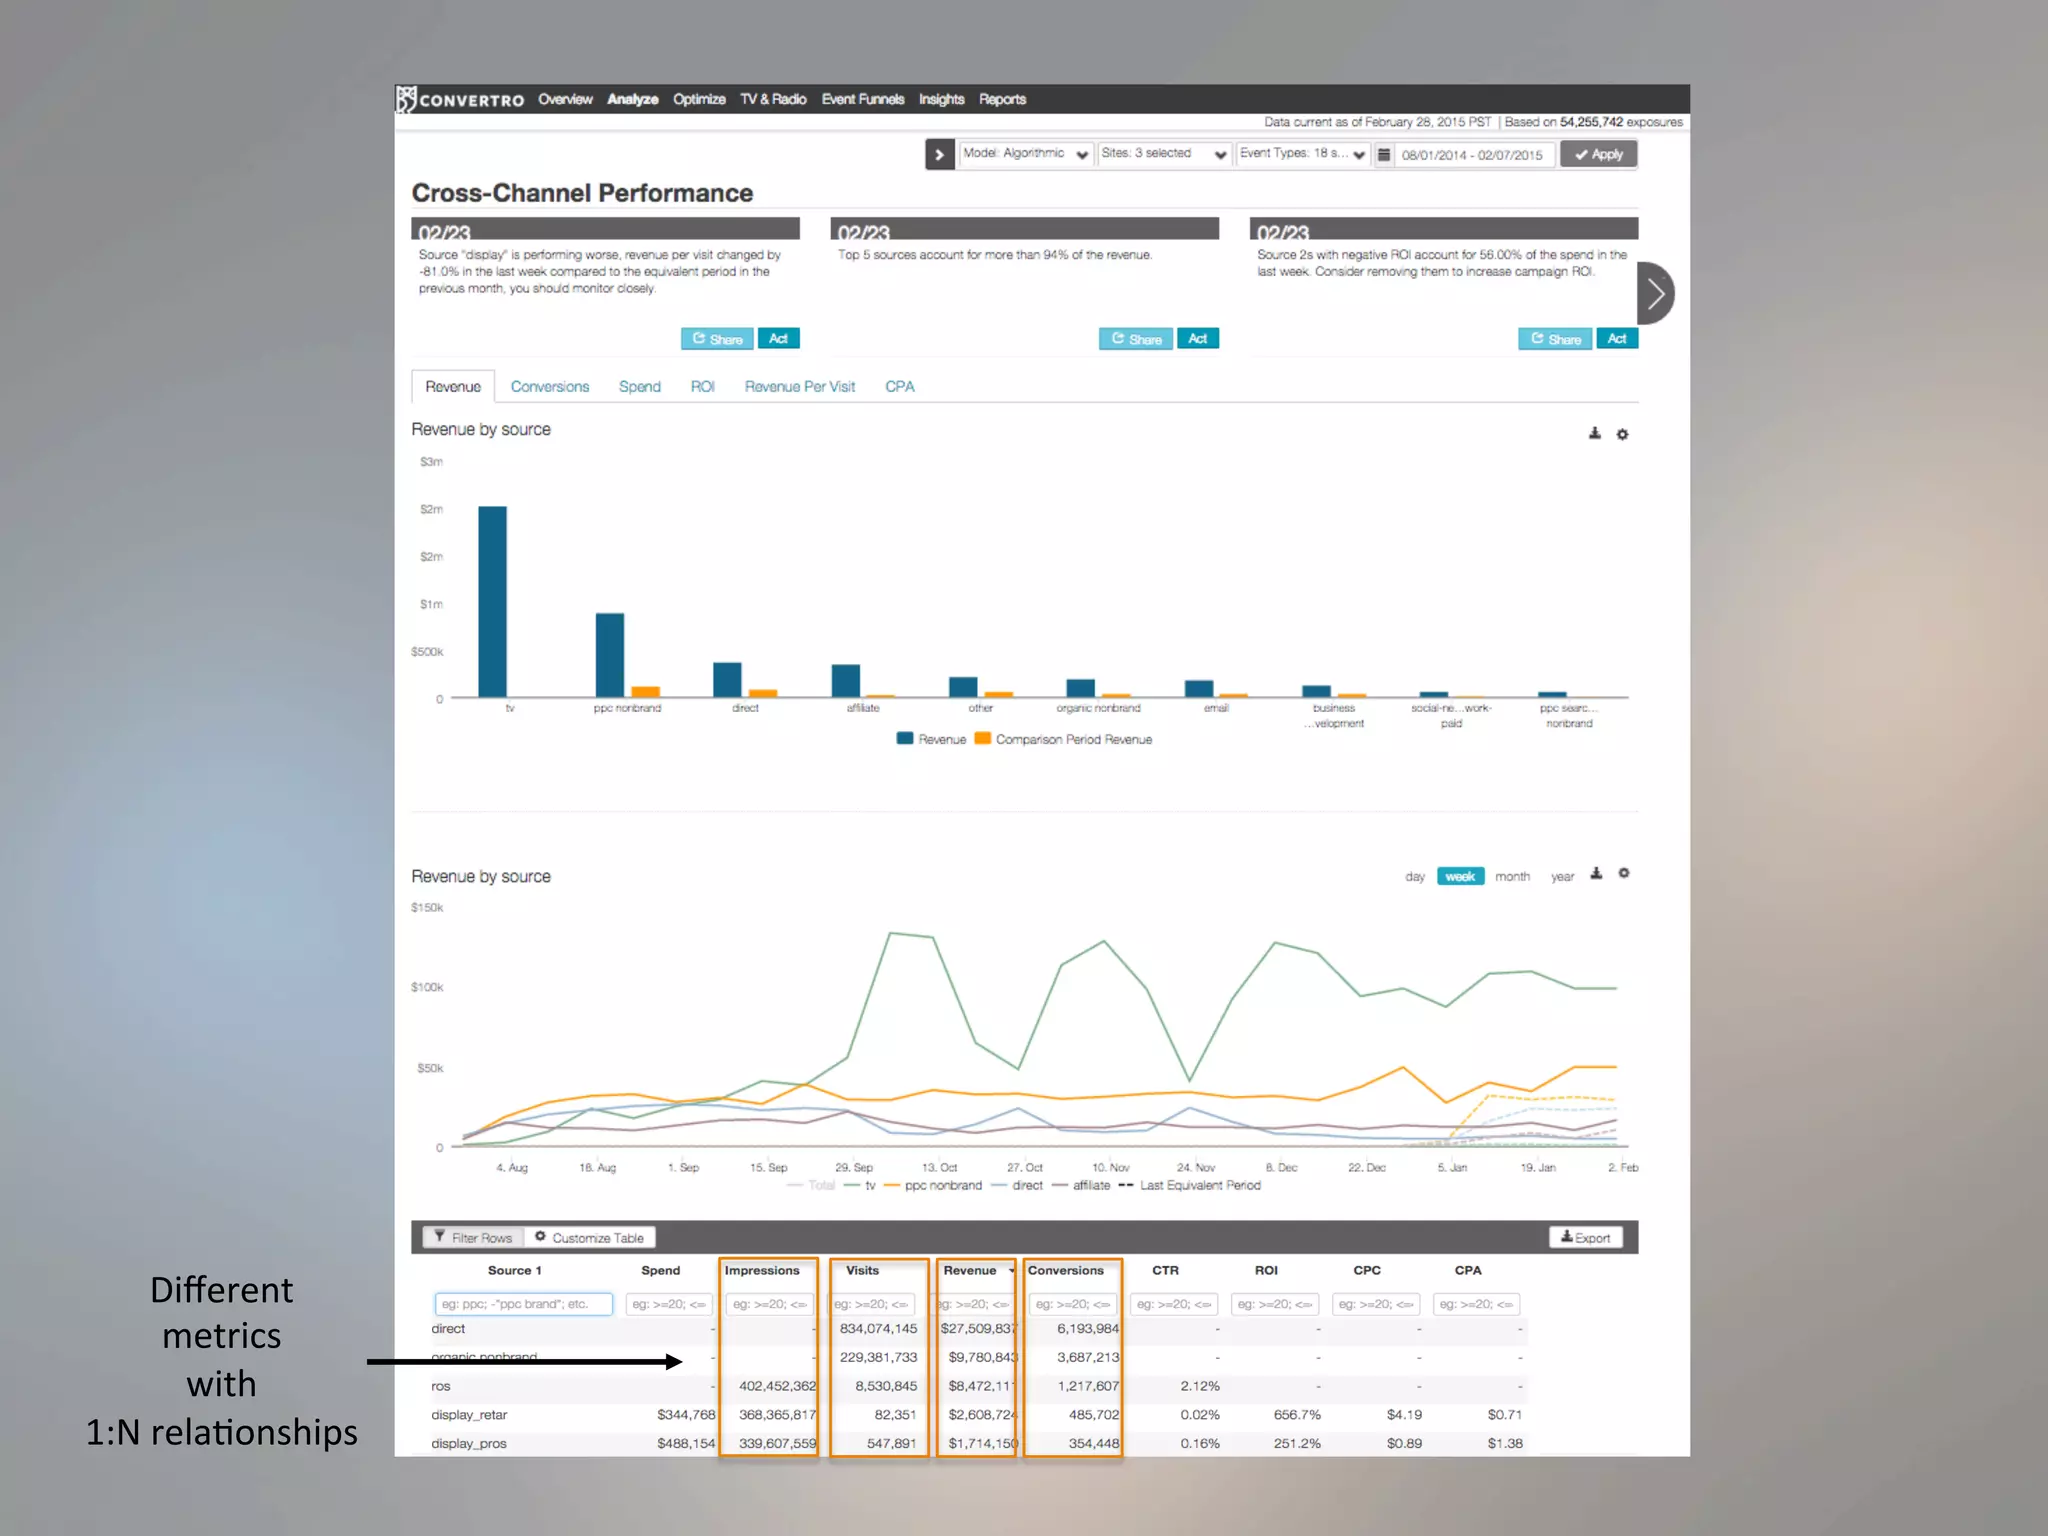
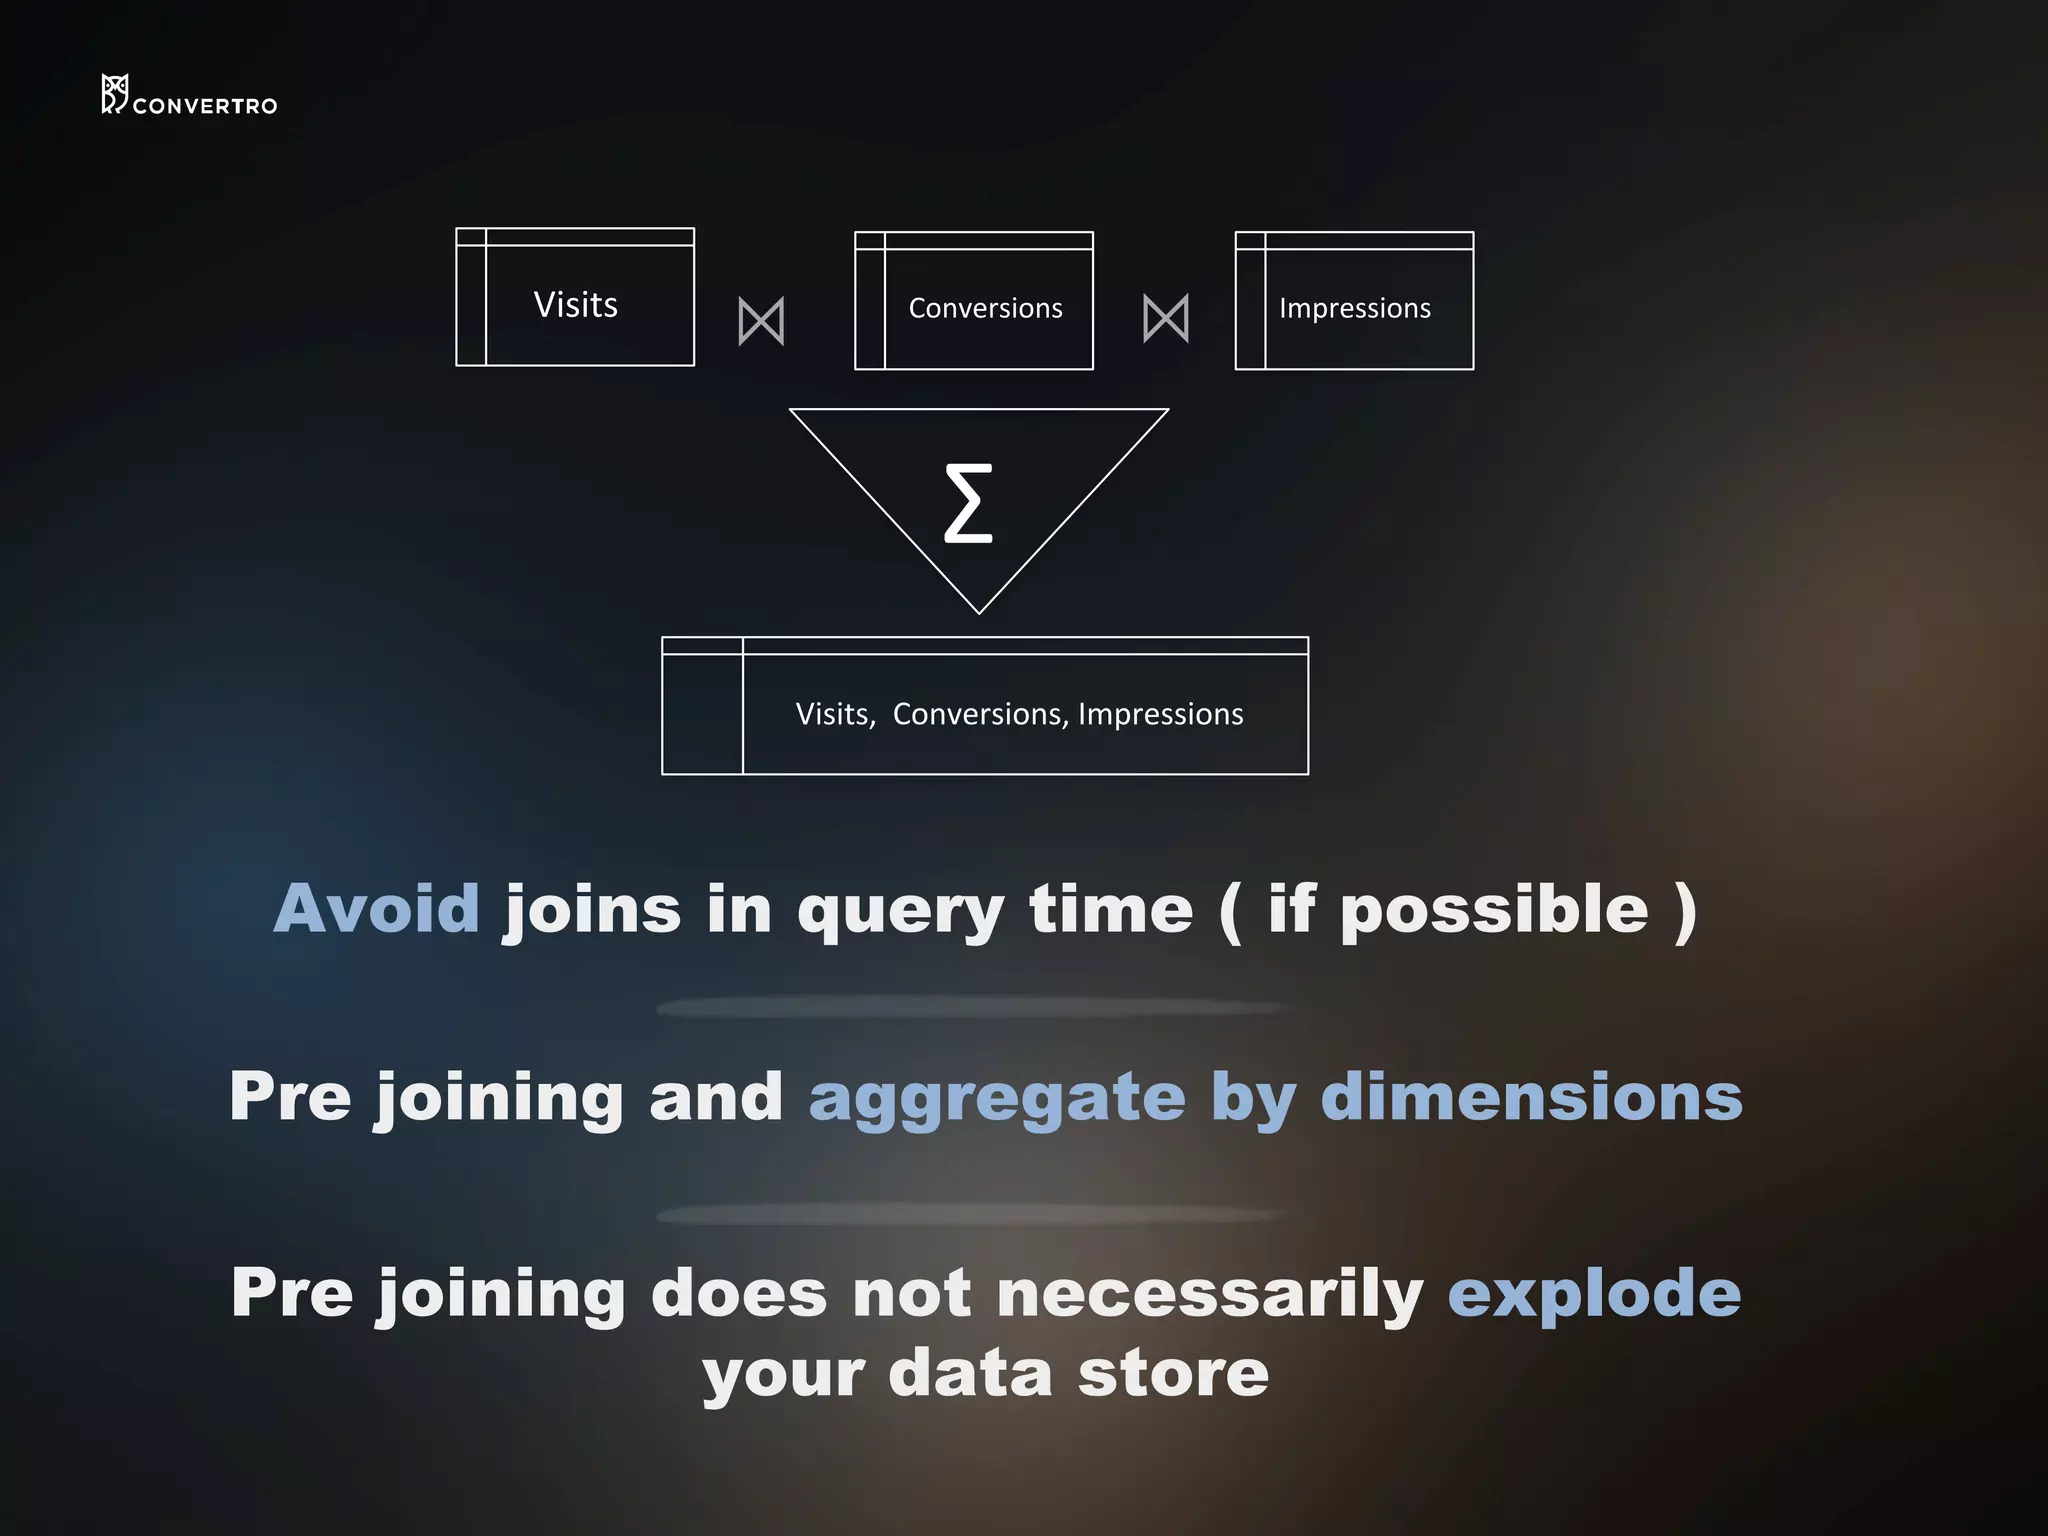

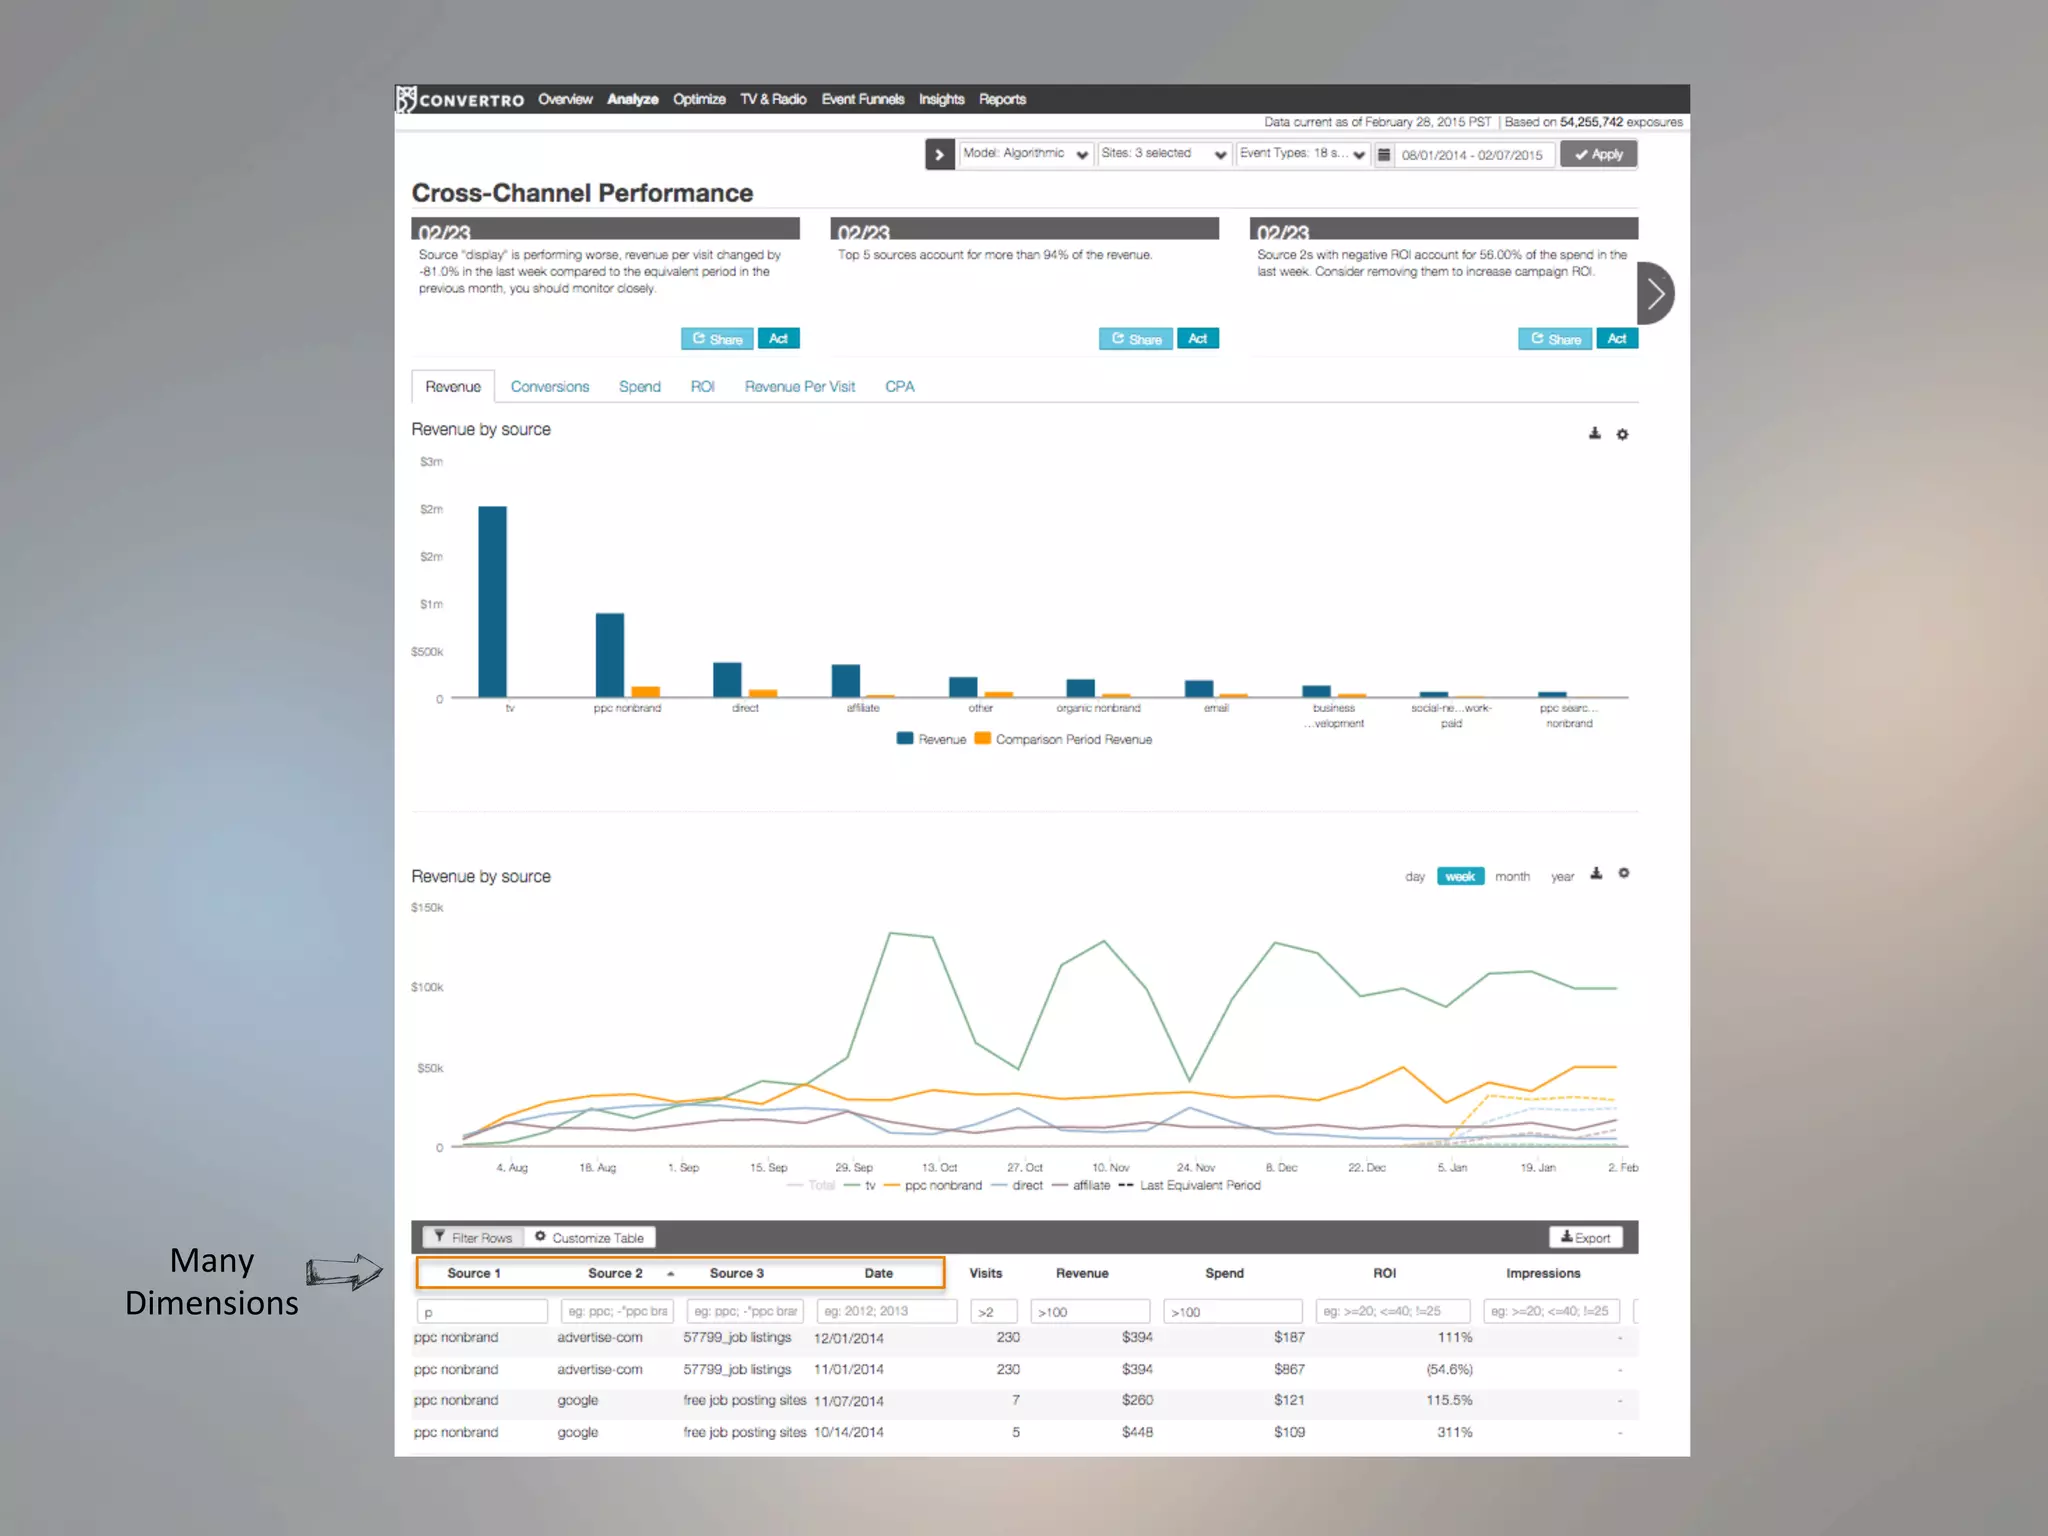
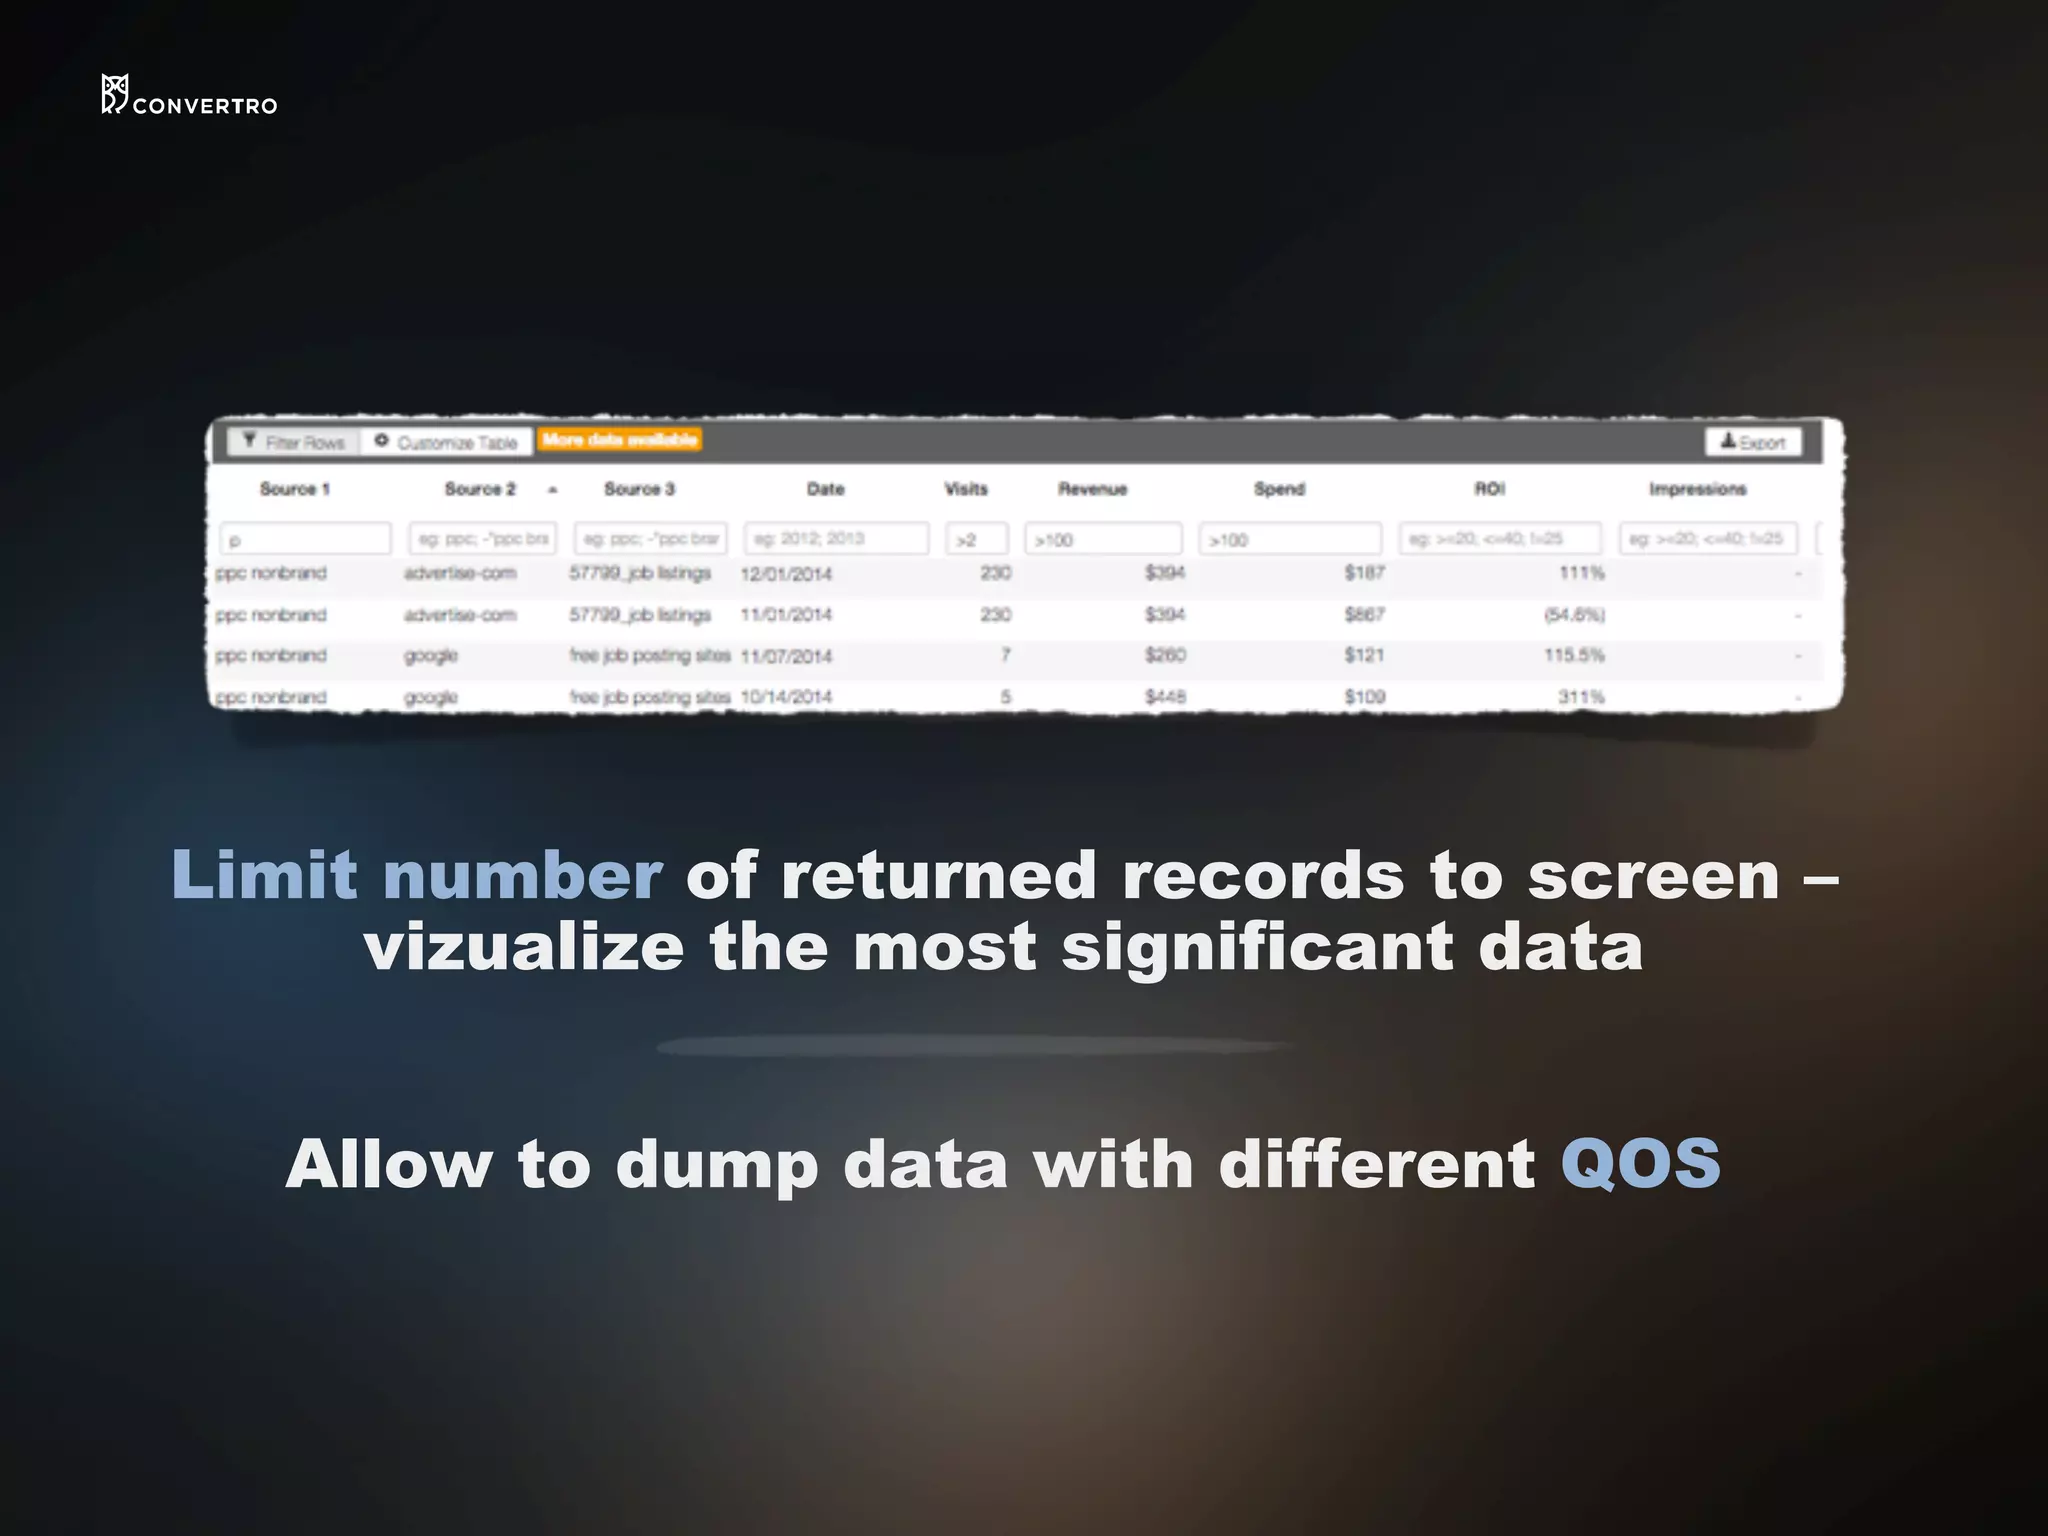
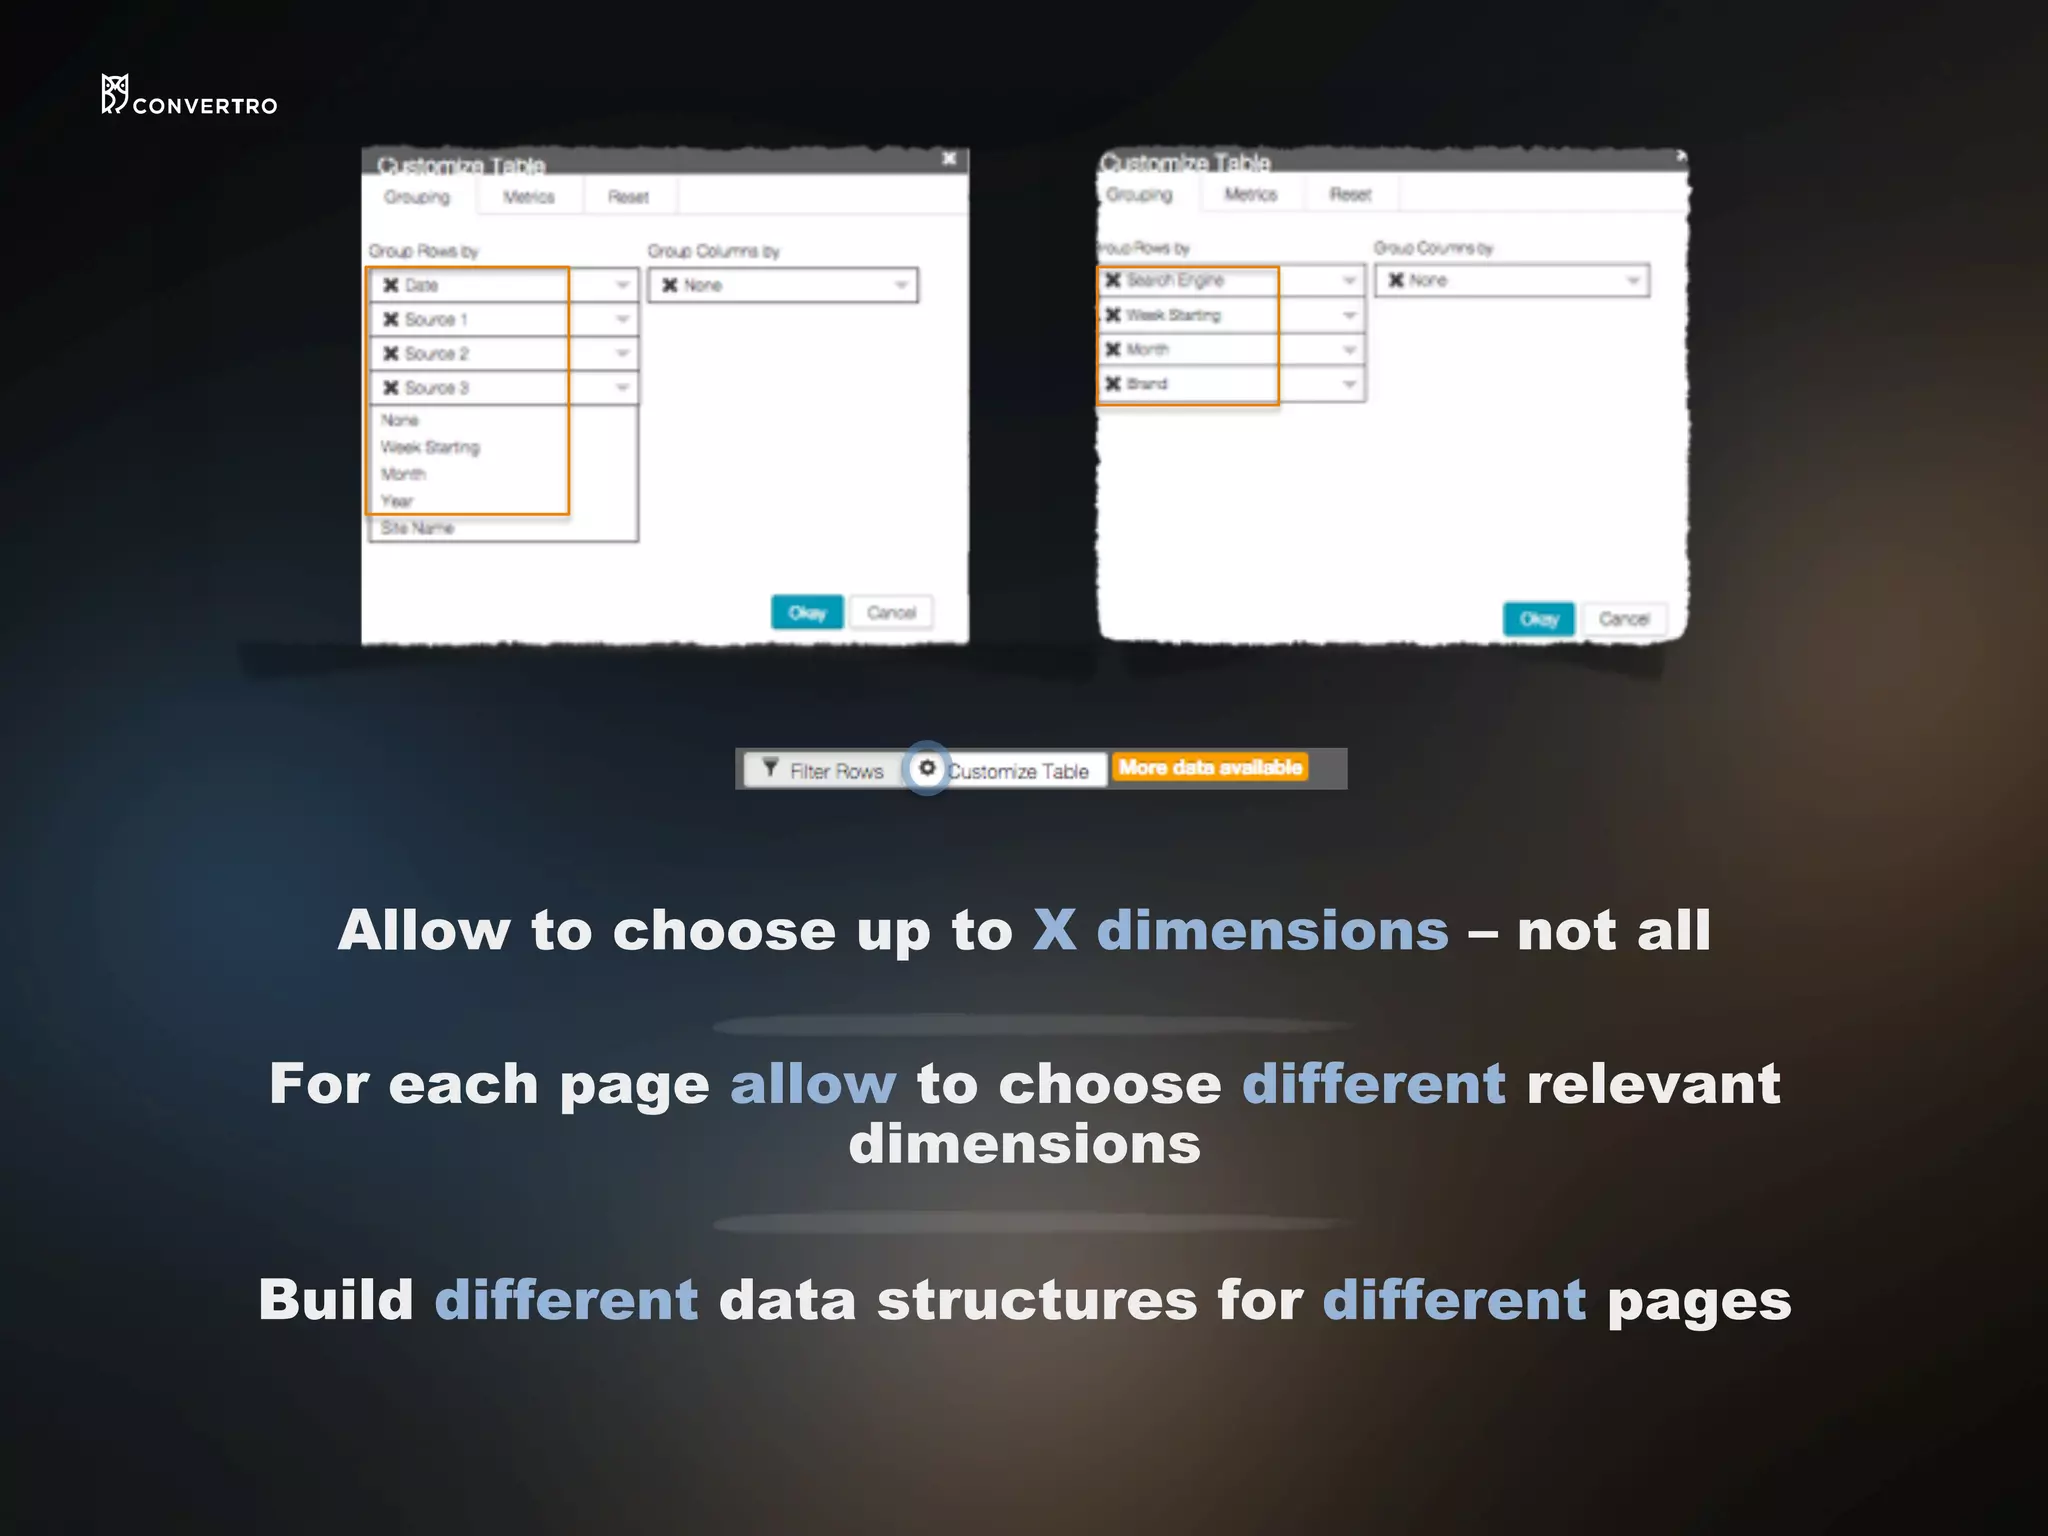

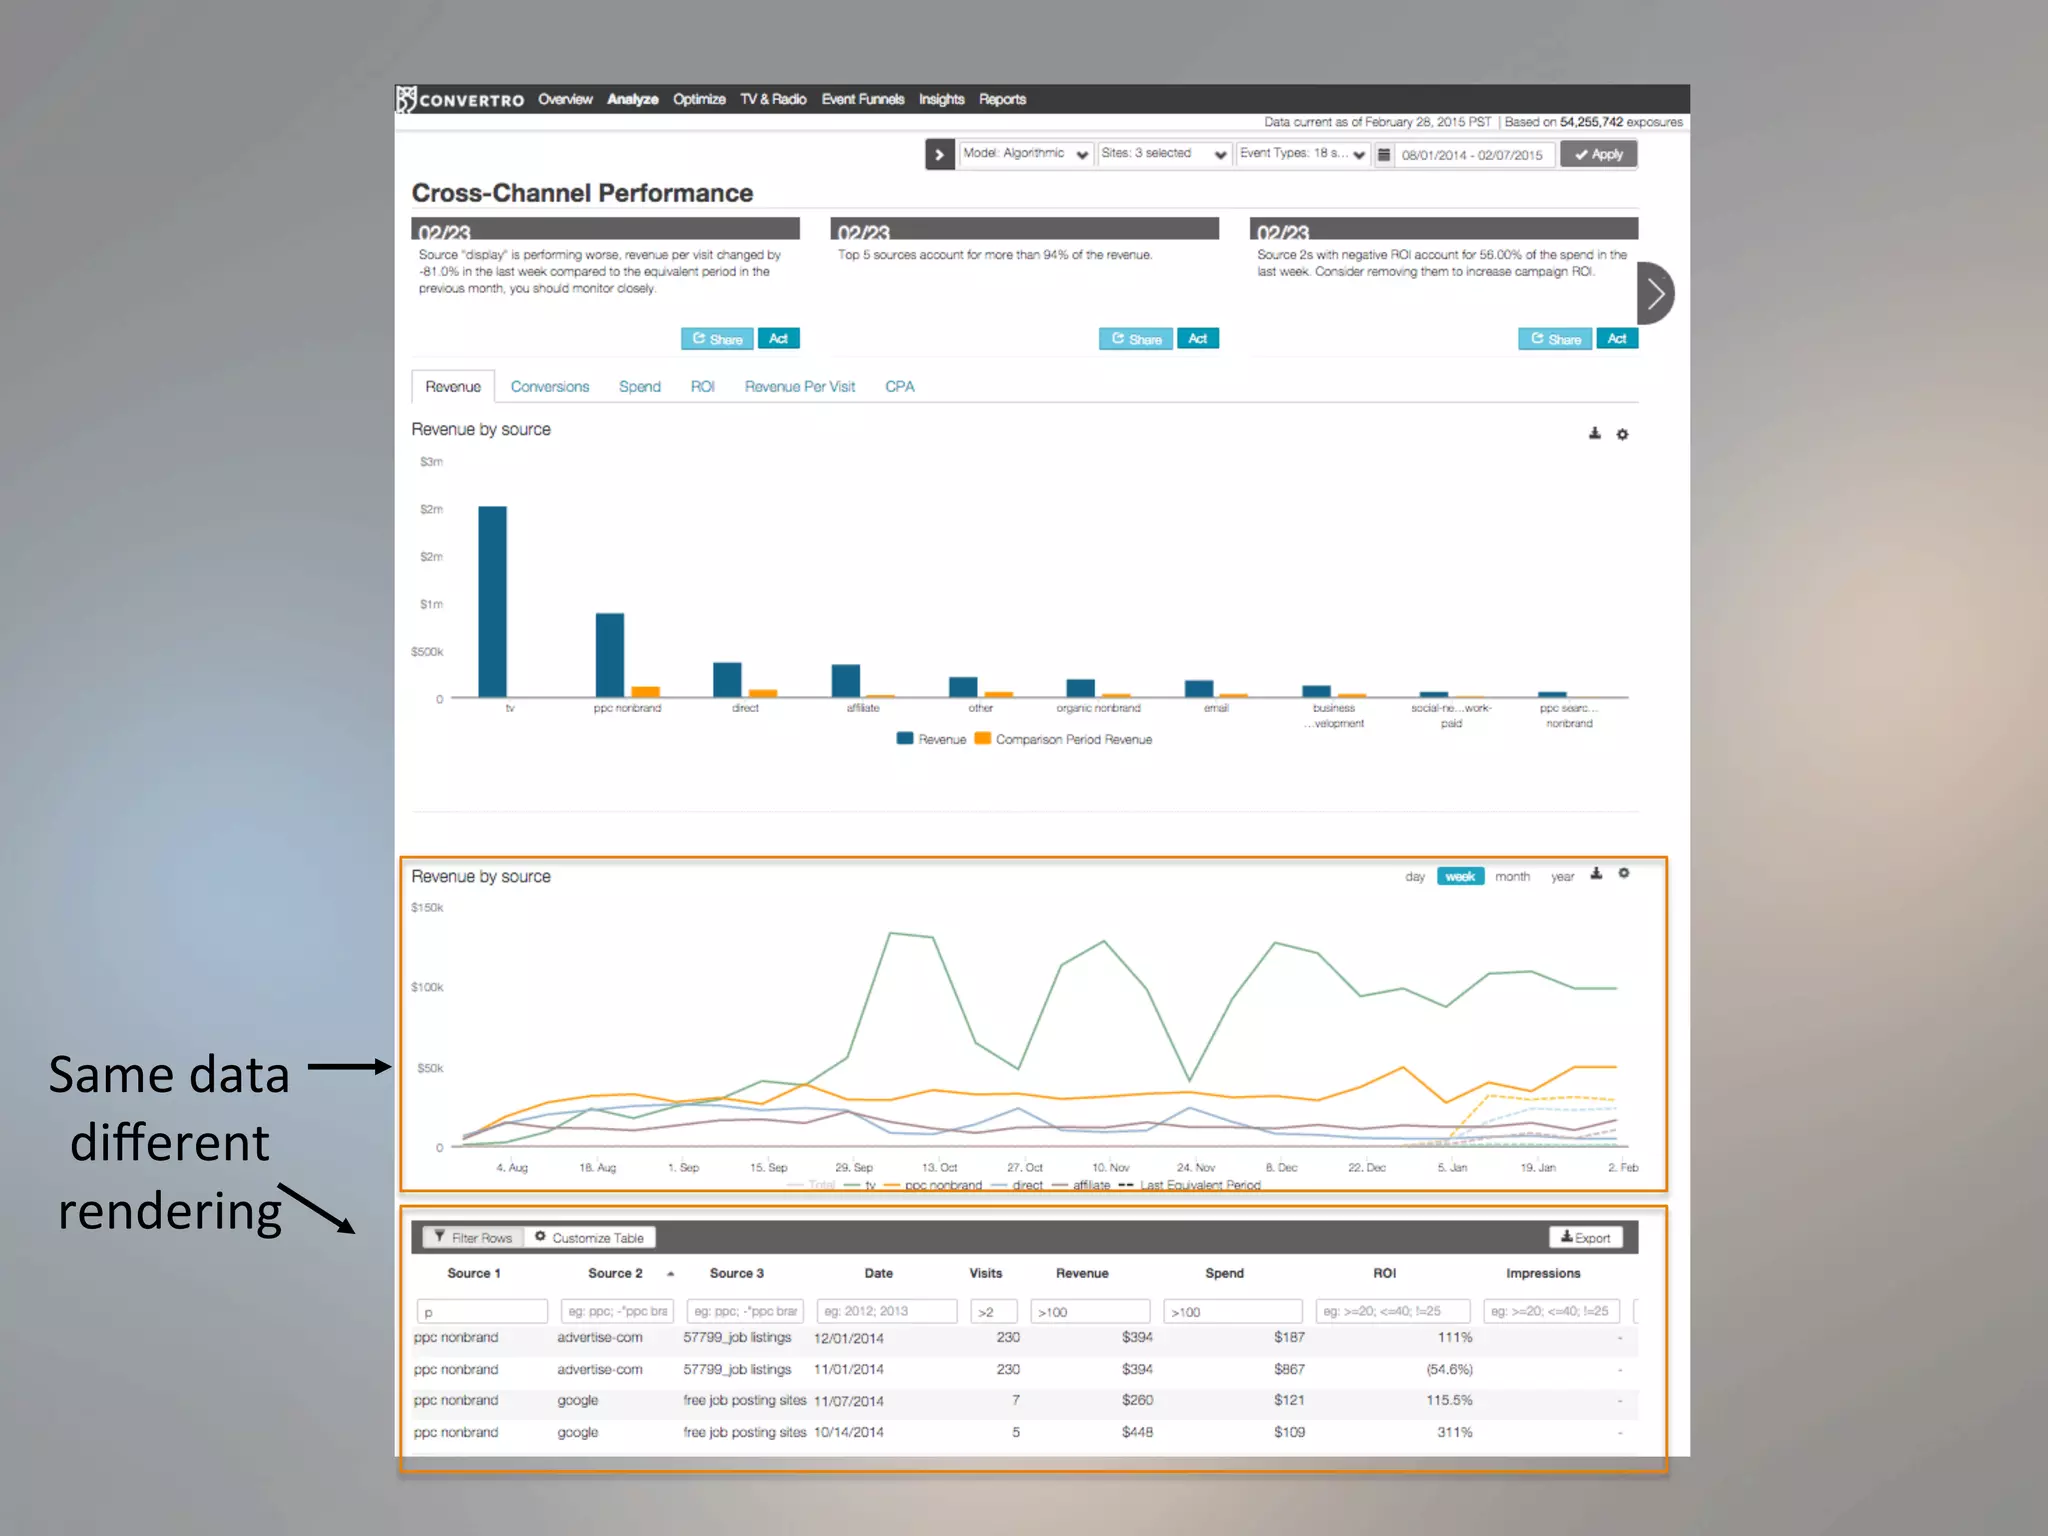
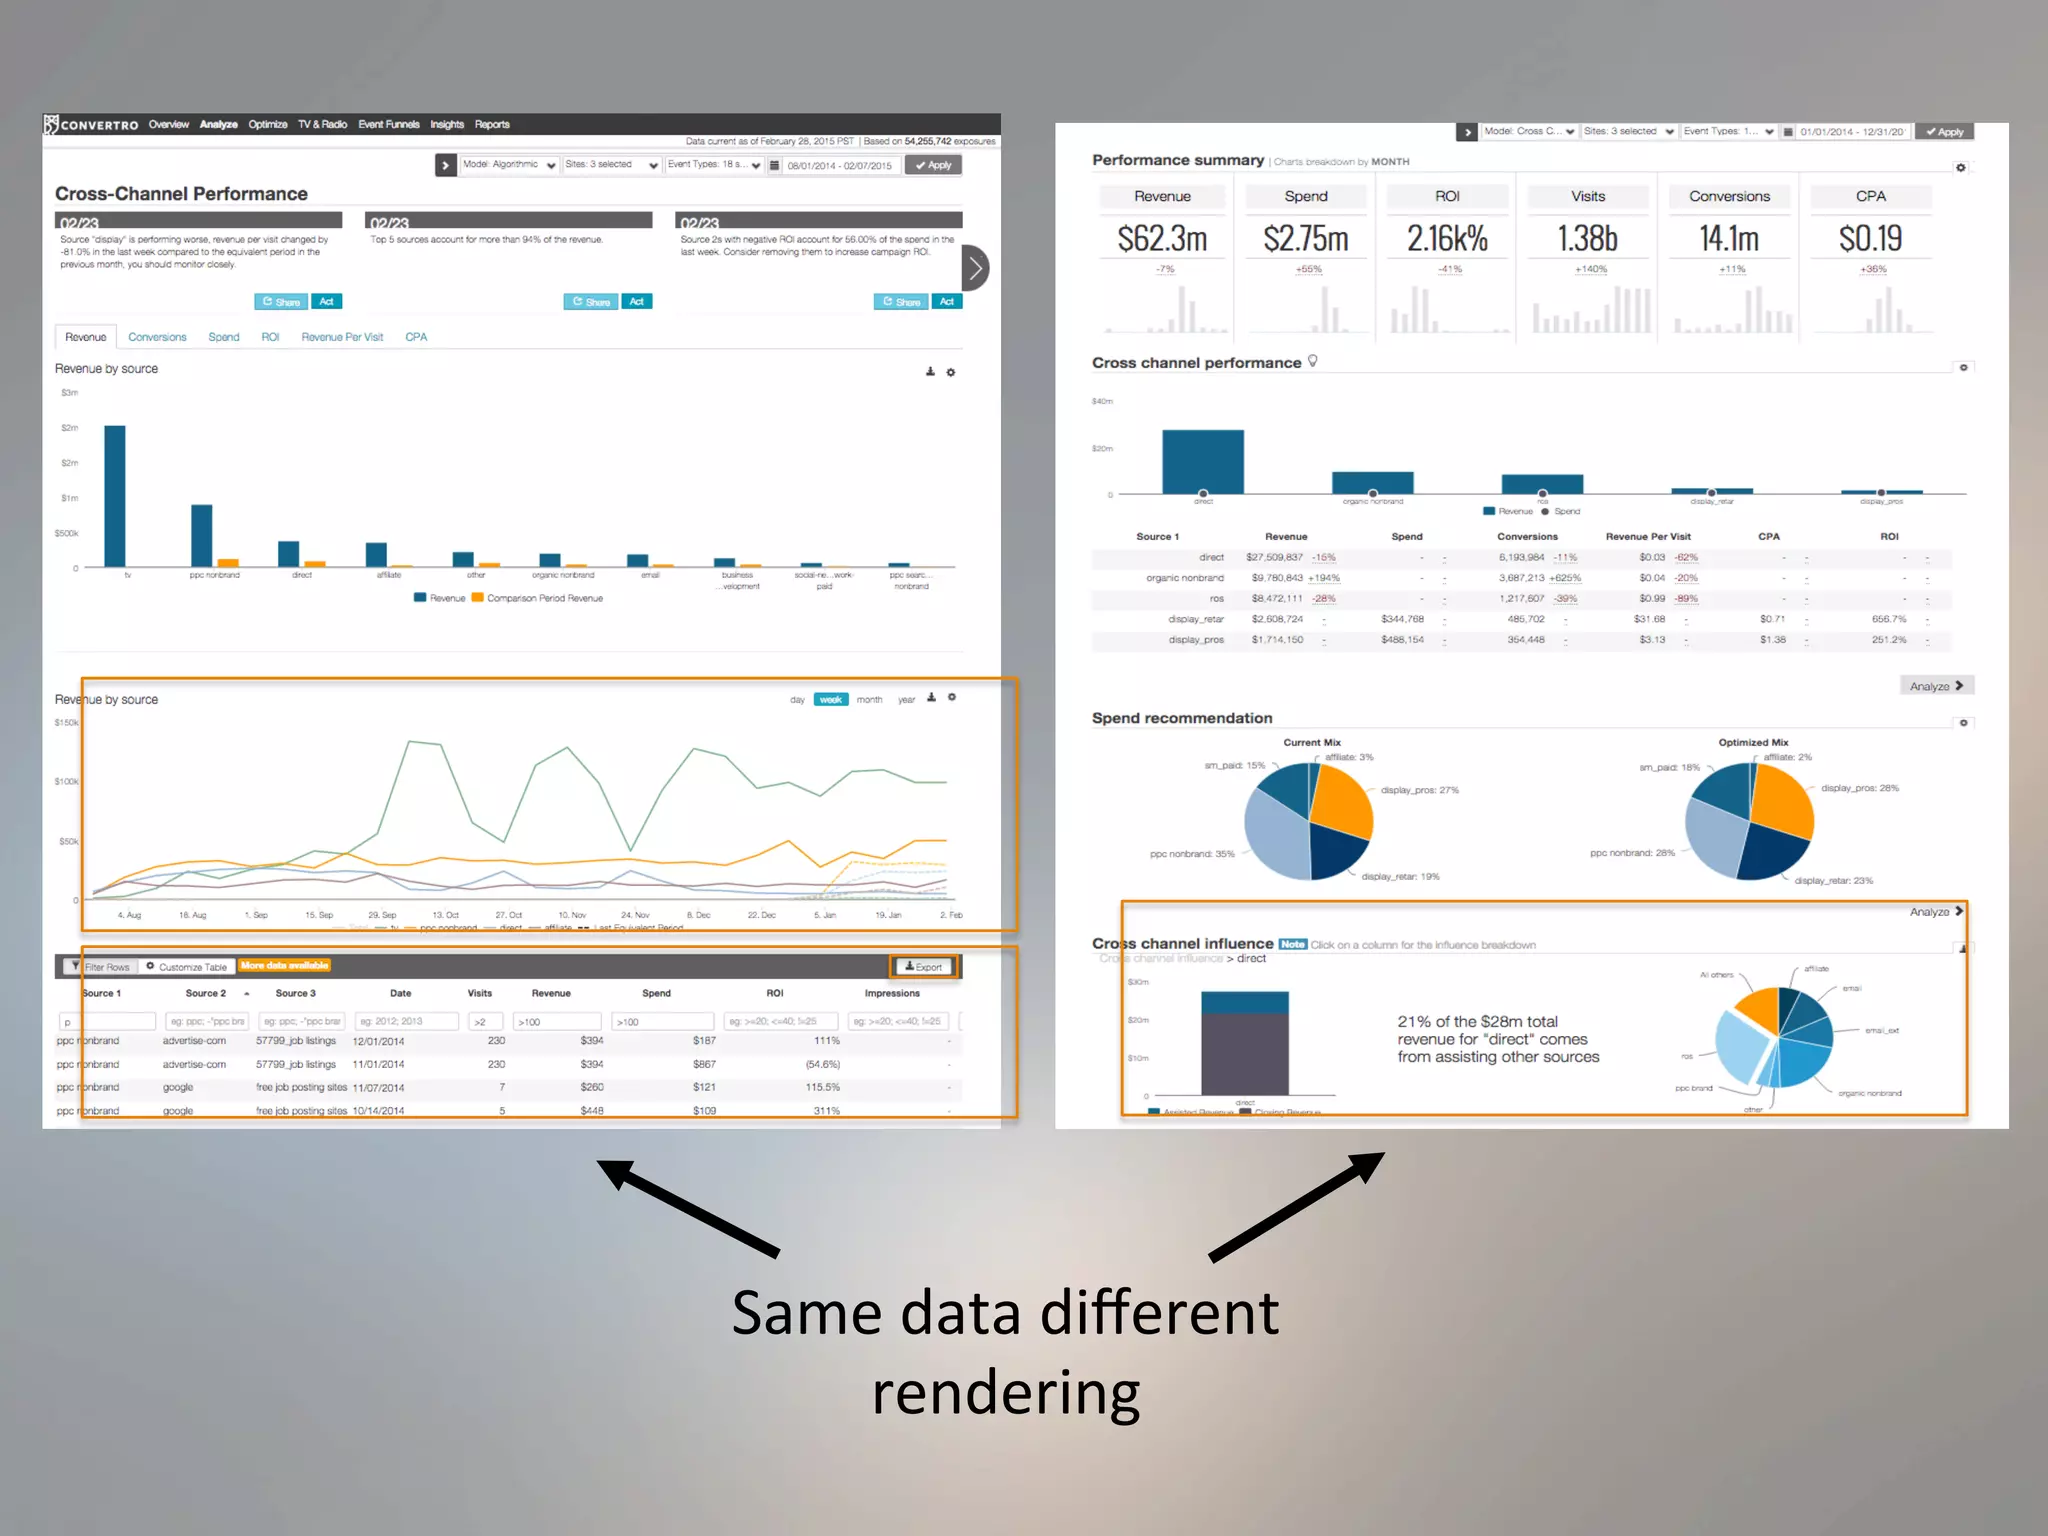
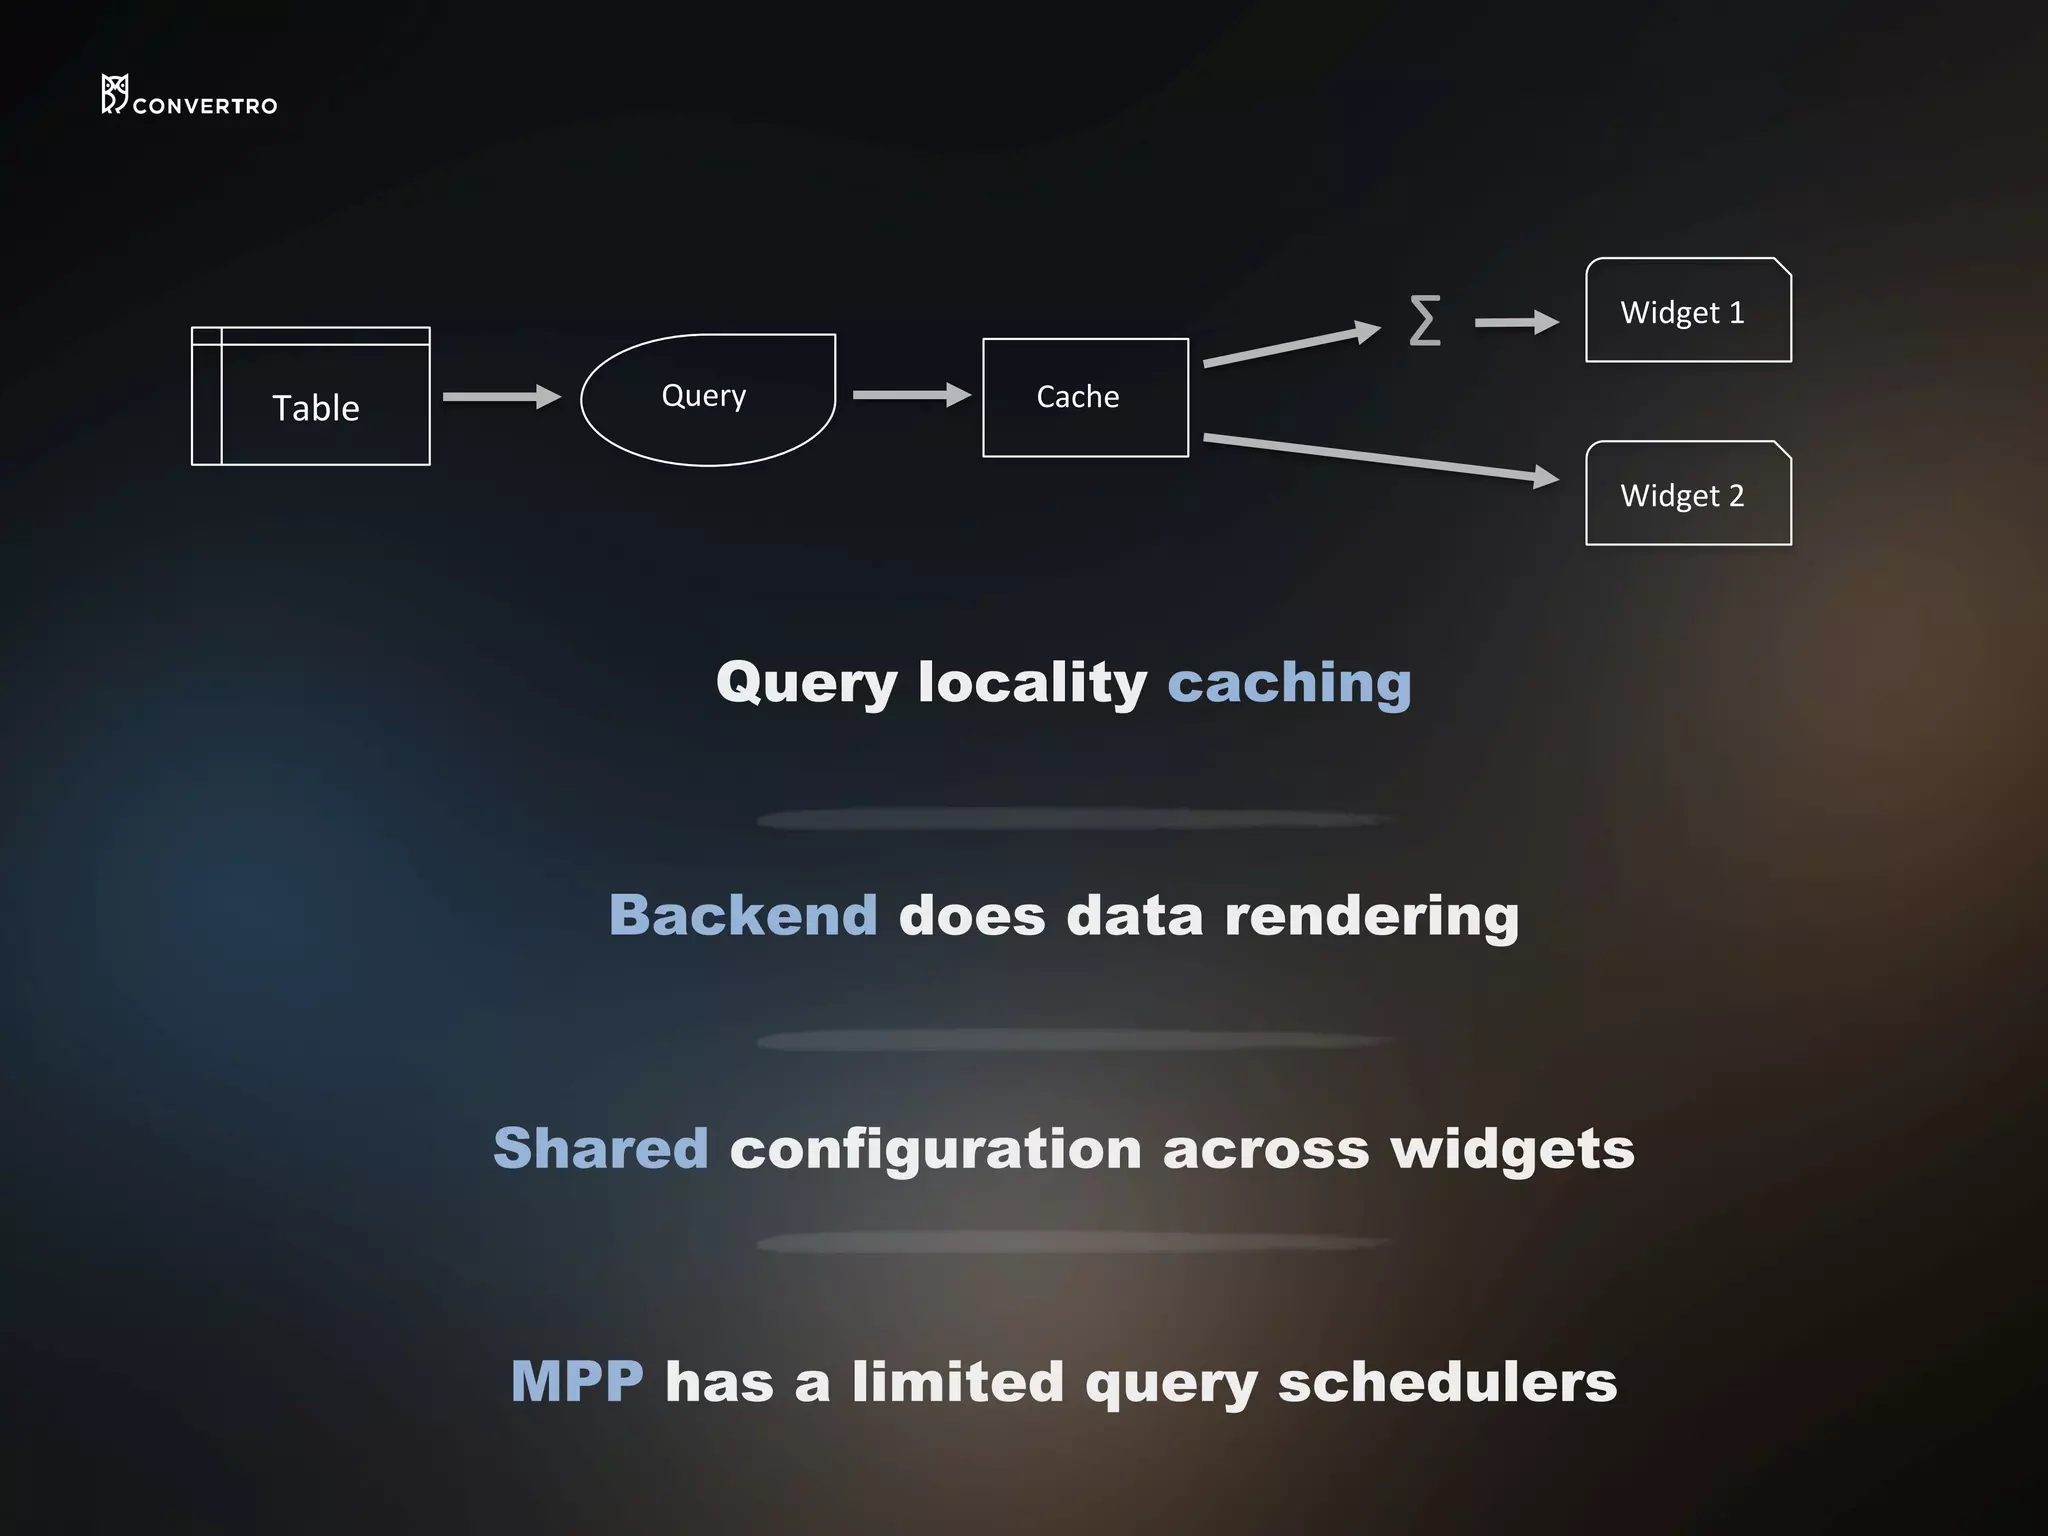

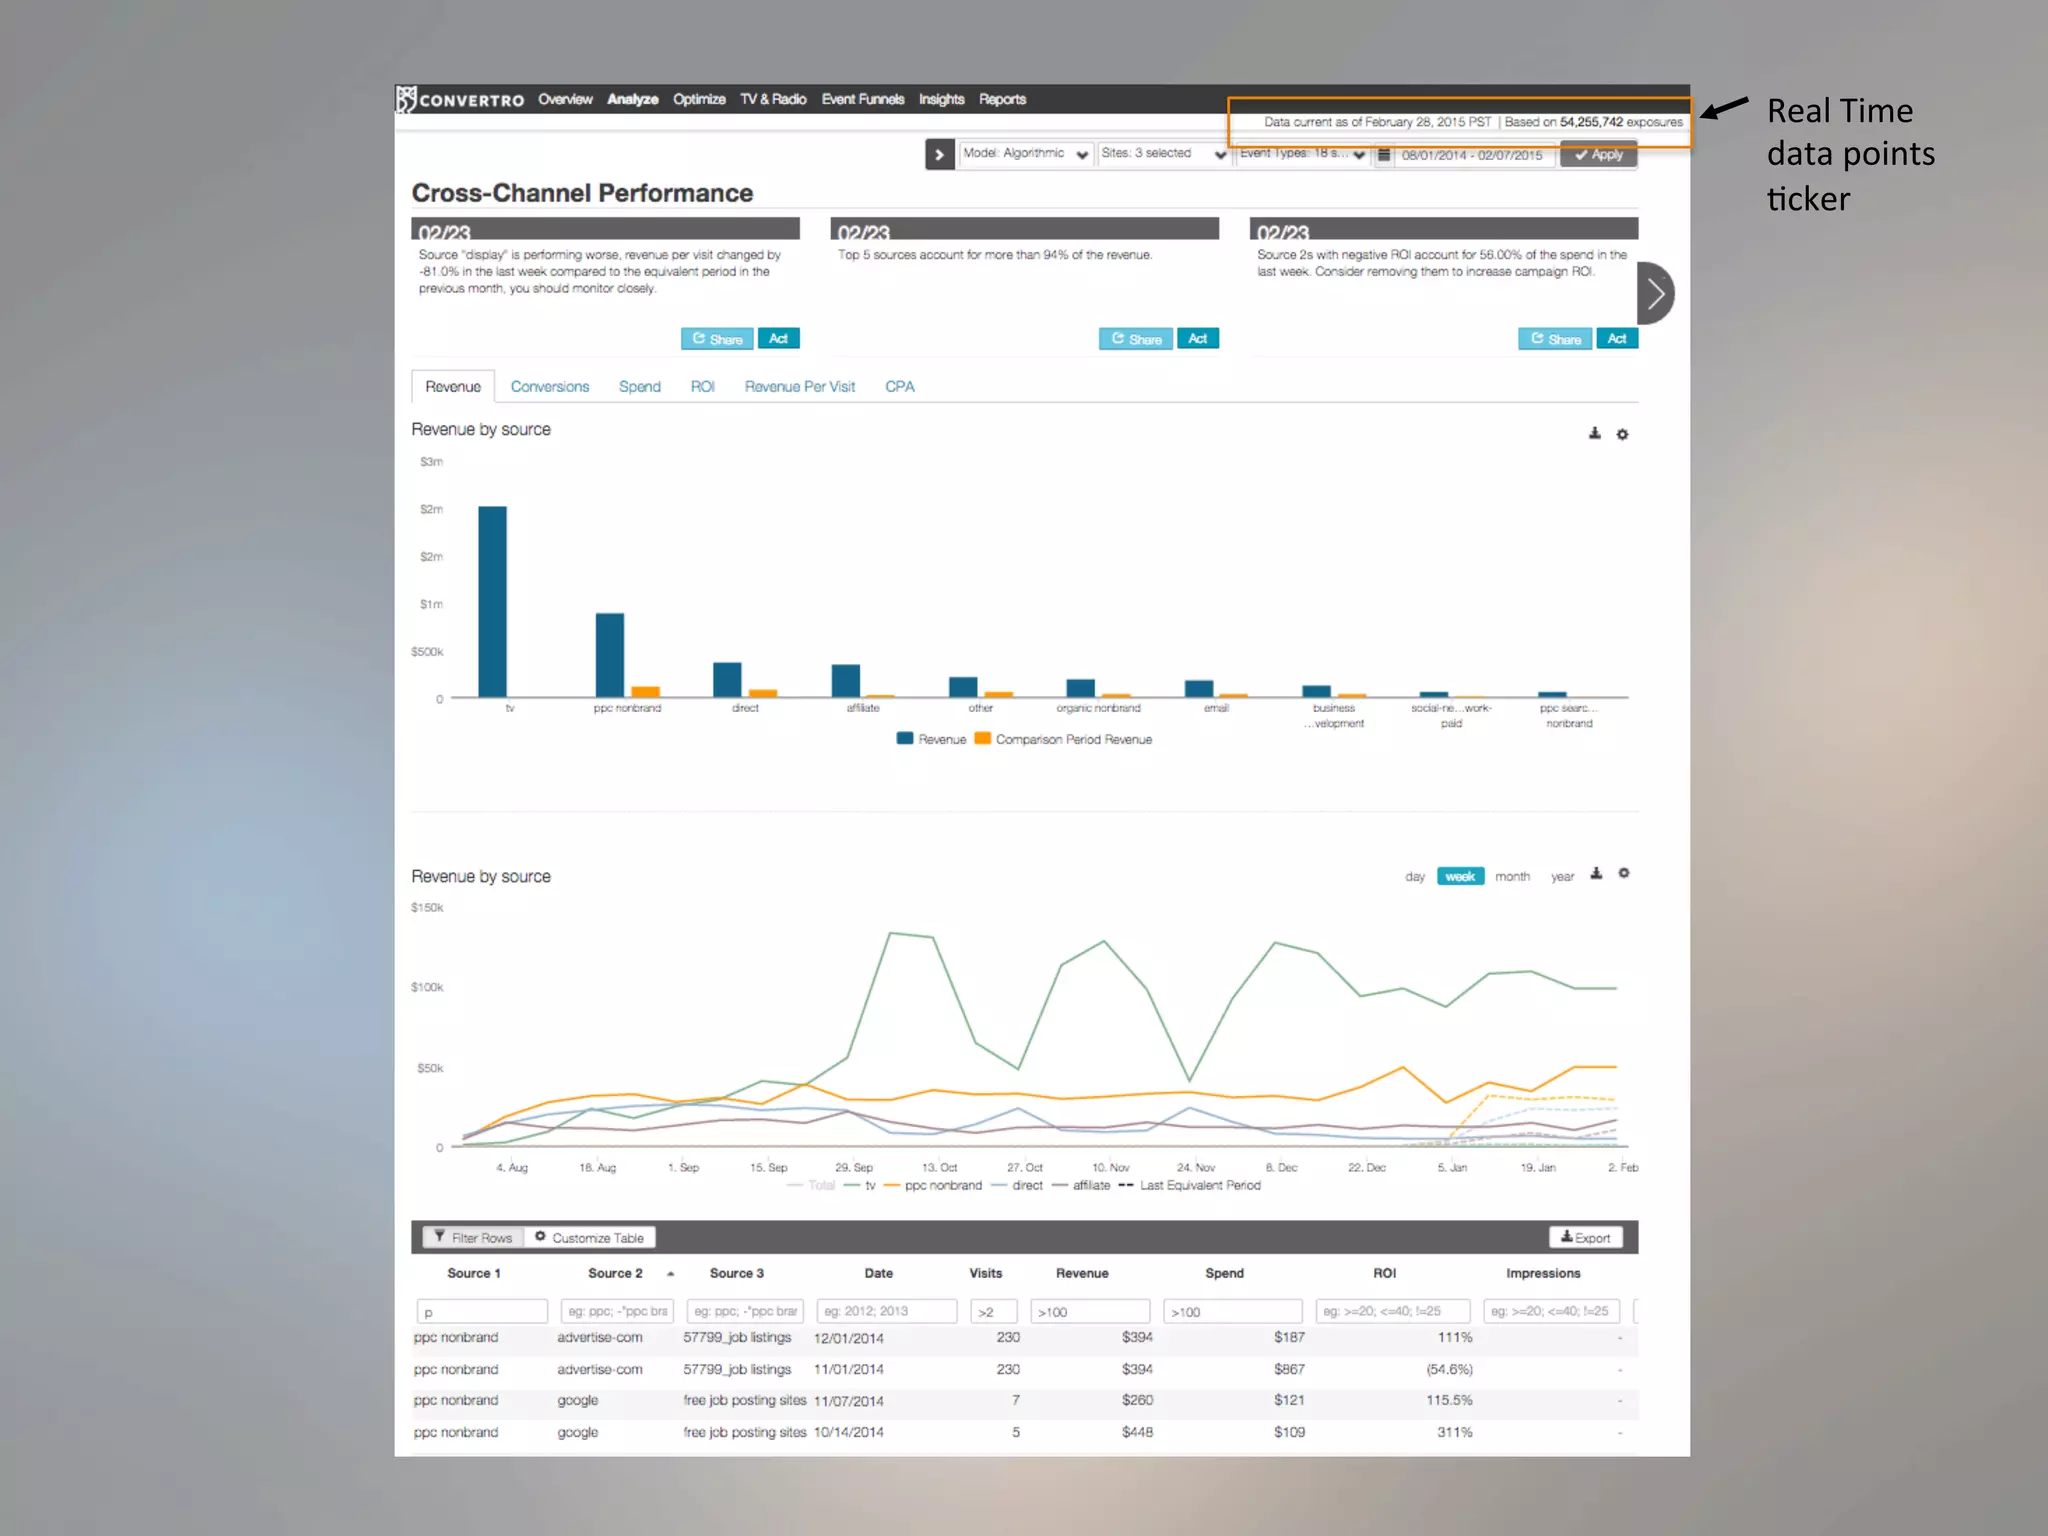
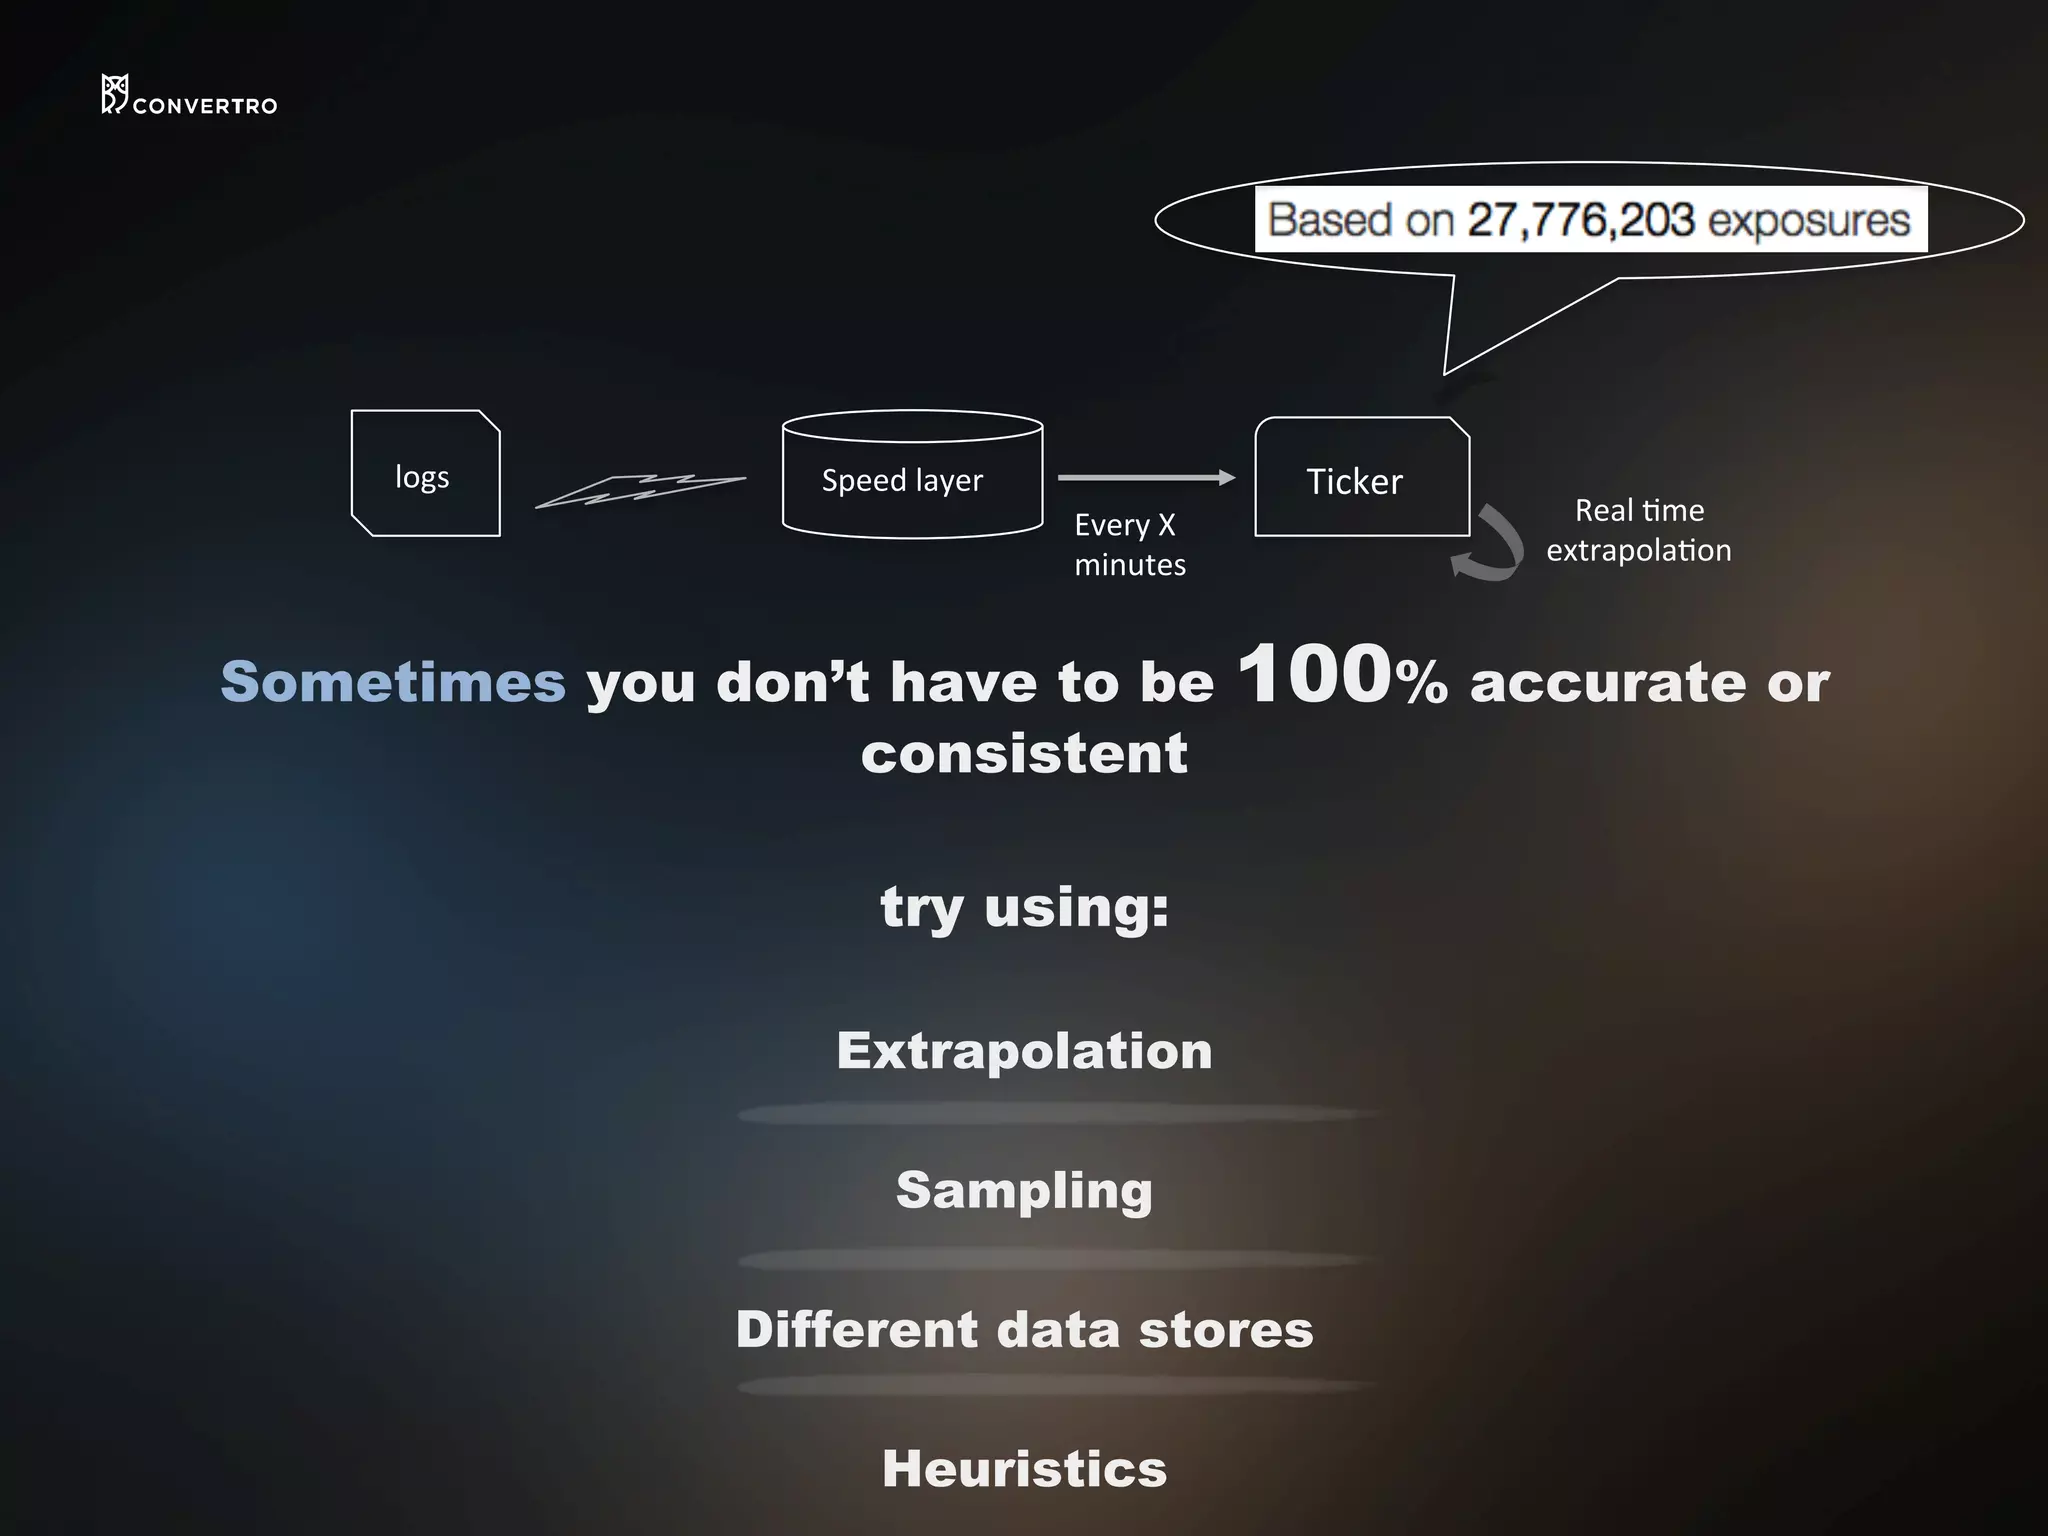
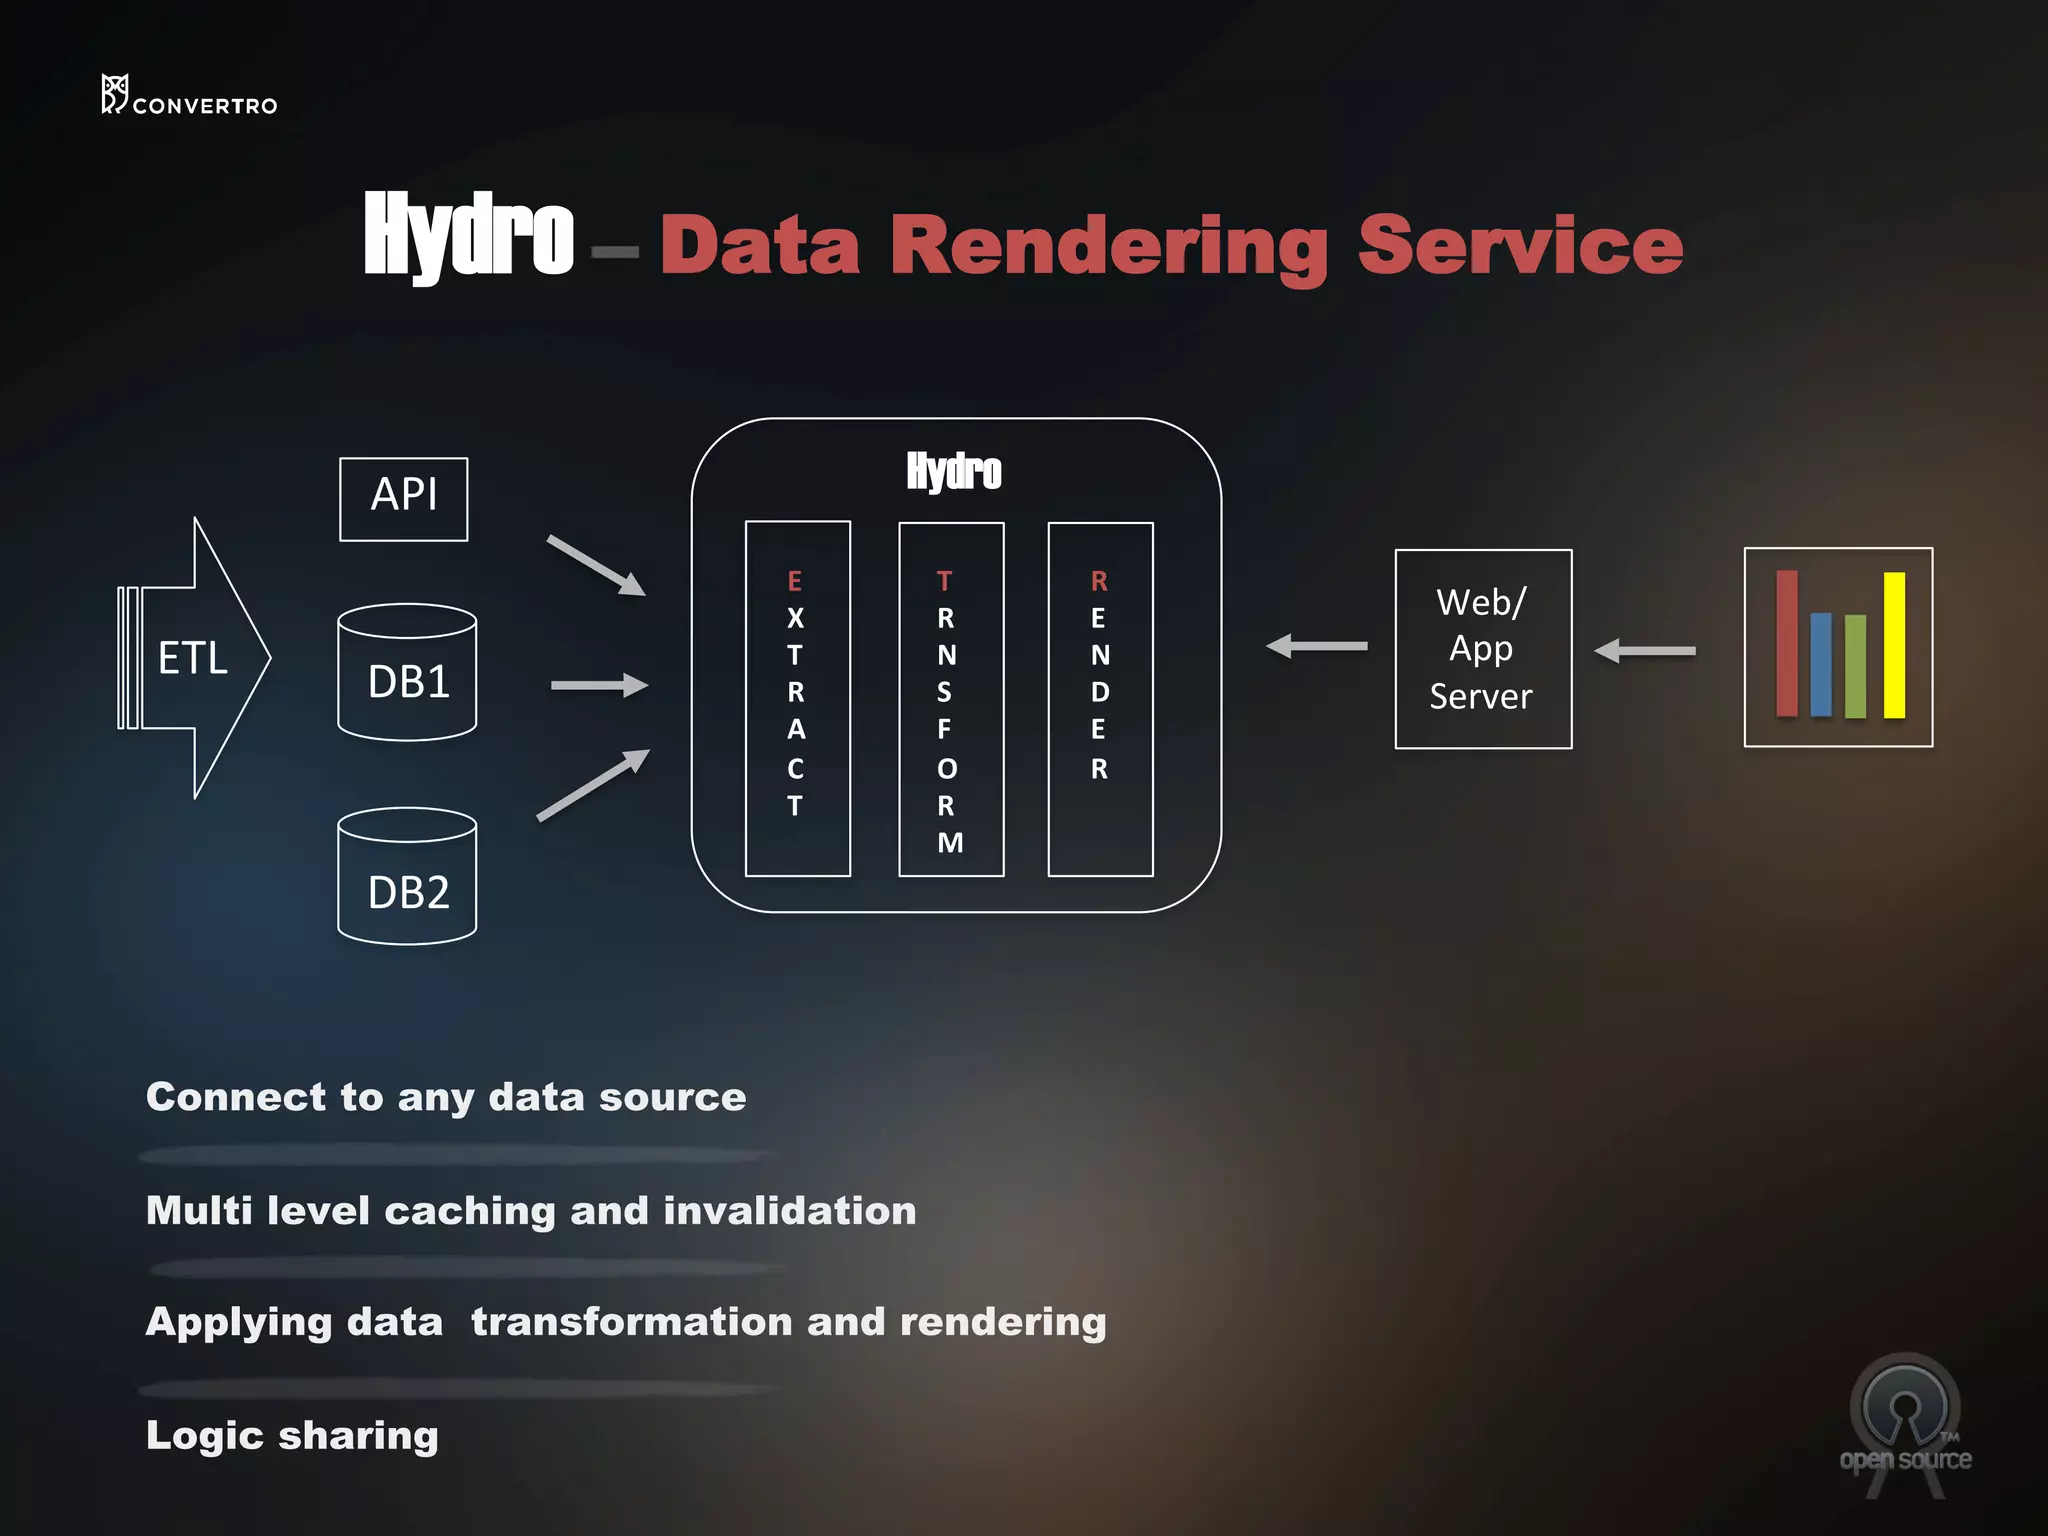


Convertro, founded in 2009 and acquired by AOL in 2014, utilizes a big data stack to help marketers optimize spending across various channels and devices. The document outlines multiple use cases for effective data handling and visualization, emphasizing performance considerations and architecture choices. Key highlights include leveraging sorted data structures for speed, pre-aggregating data, and accommodating various metrics without costly joins.


![Coded Agents – with UiPath SDK + LangGraph [Virtual Hands-on Workshop]](https://cdn.slidesharecdn.com/ss_thumbnails/codedagentsdeck-251215155422-5497c599-thumbnail.jpg?width=640&height=640&fit=bounds)


