Downloaded 10 times


![Most literature reviews cherry-pick the evidence
(that’s why I’m not identifying this specific e.g.)
“Regardless of etiology, cerebellar neuropathology
commonly occurs in autistic individuals. Cerebellar
hypoplasia and reduced cerebellar Purkinje cell
numbers are the most consistent neuropathologies
linked to autism [8, 9, 10, 11, 12, 13]. MRI studies
report that autistic children have smaller cerebellar
vermal volume in comparison to typically developing
children [14].”
Example: Study published in 2013
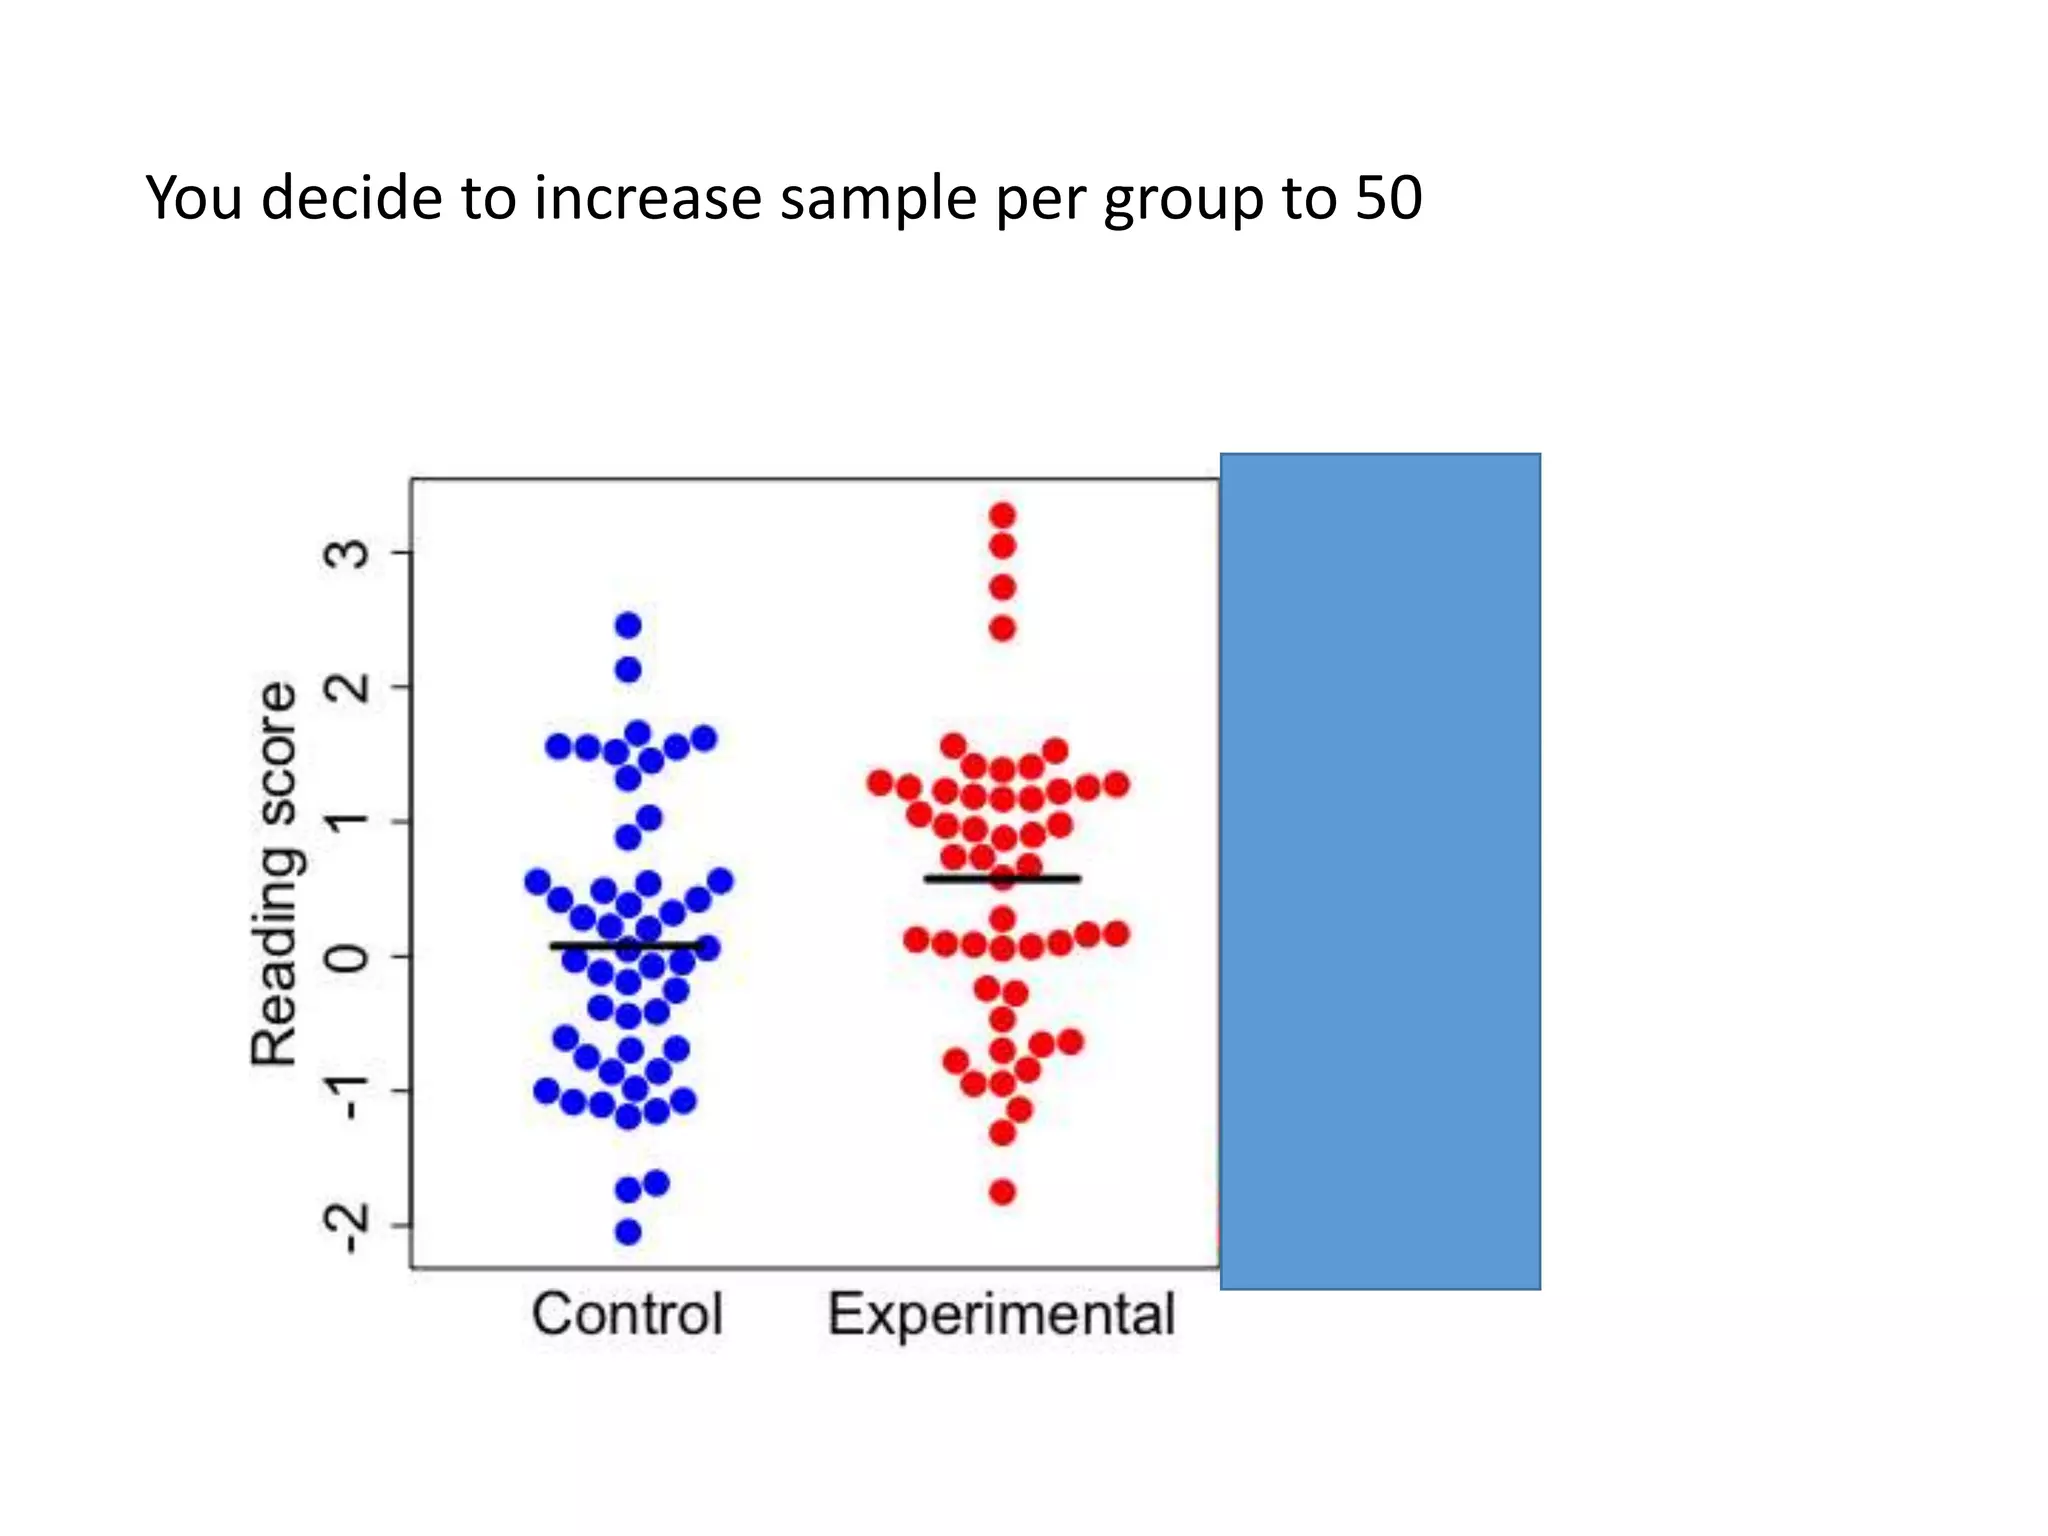
• I was surprised by this introduction to a paper, as it did not fit my impression of the
literature on neuropathology in autism: but the authors seemed to cite a lot of
supportive evidence
• I checked to see if there was a relevant meta-analysis: there was….](https://image.slidesharecdn.com/psychapproachesreproducibilityslideshare-191206170937/75/Insights-from-psychology-on-lack-of-reproducibility-41-2048.jpg)
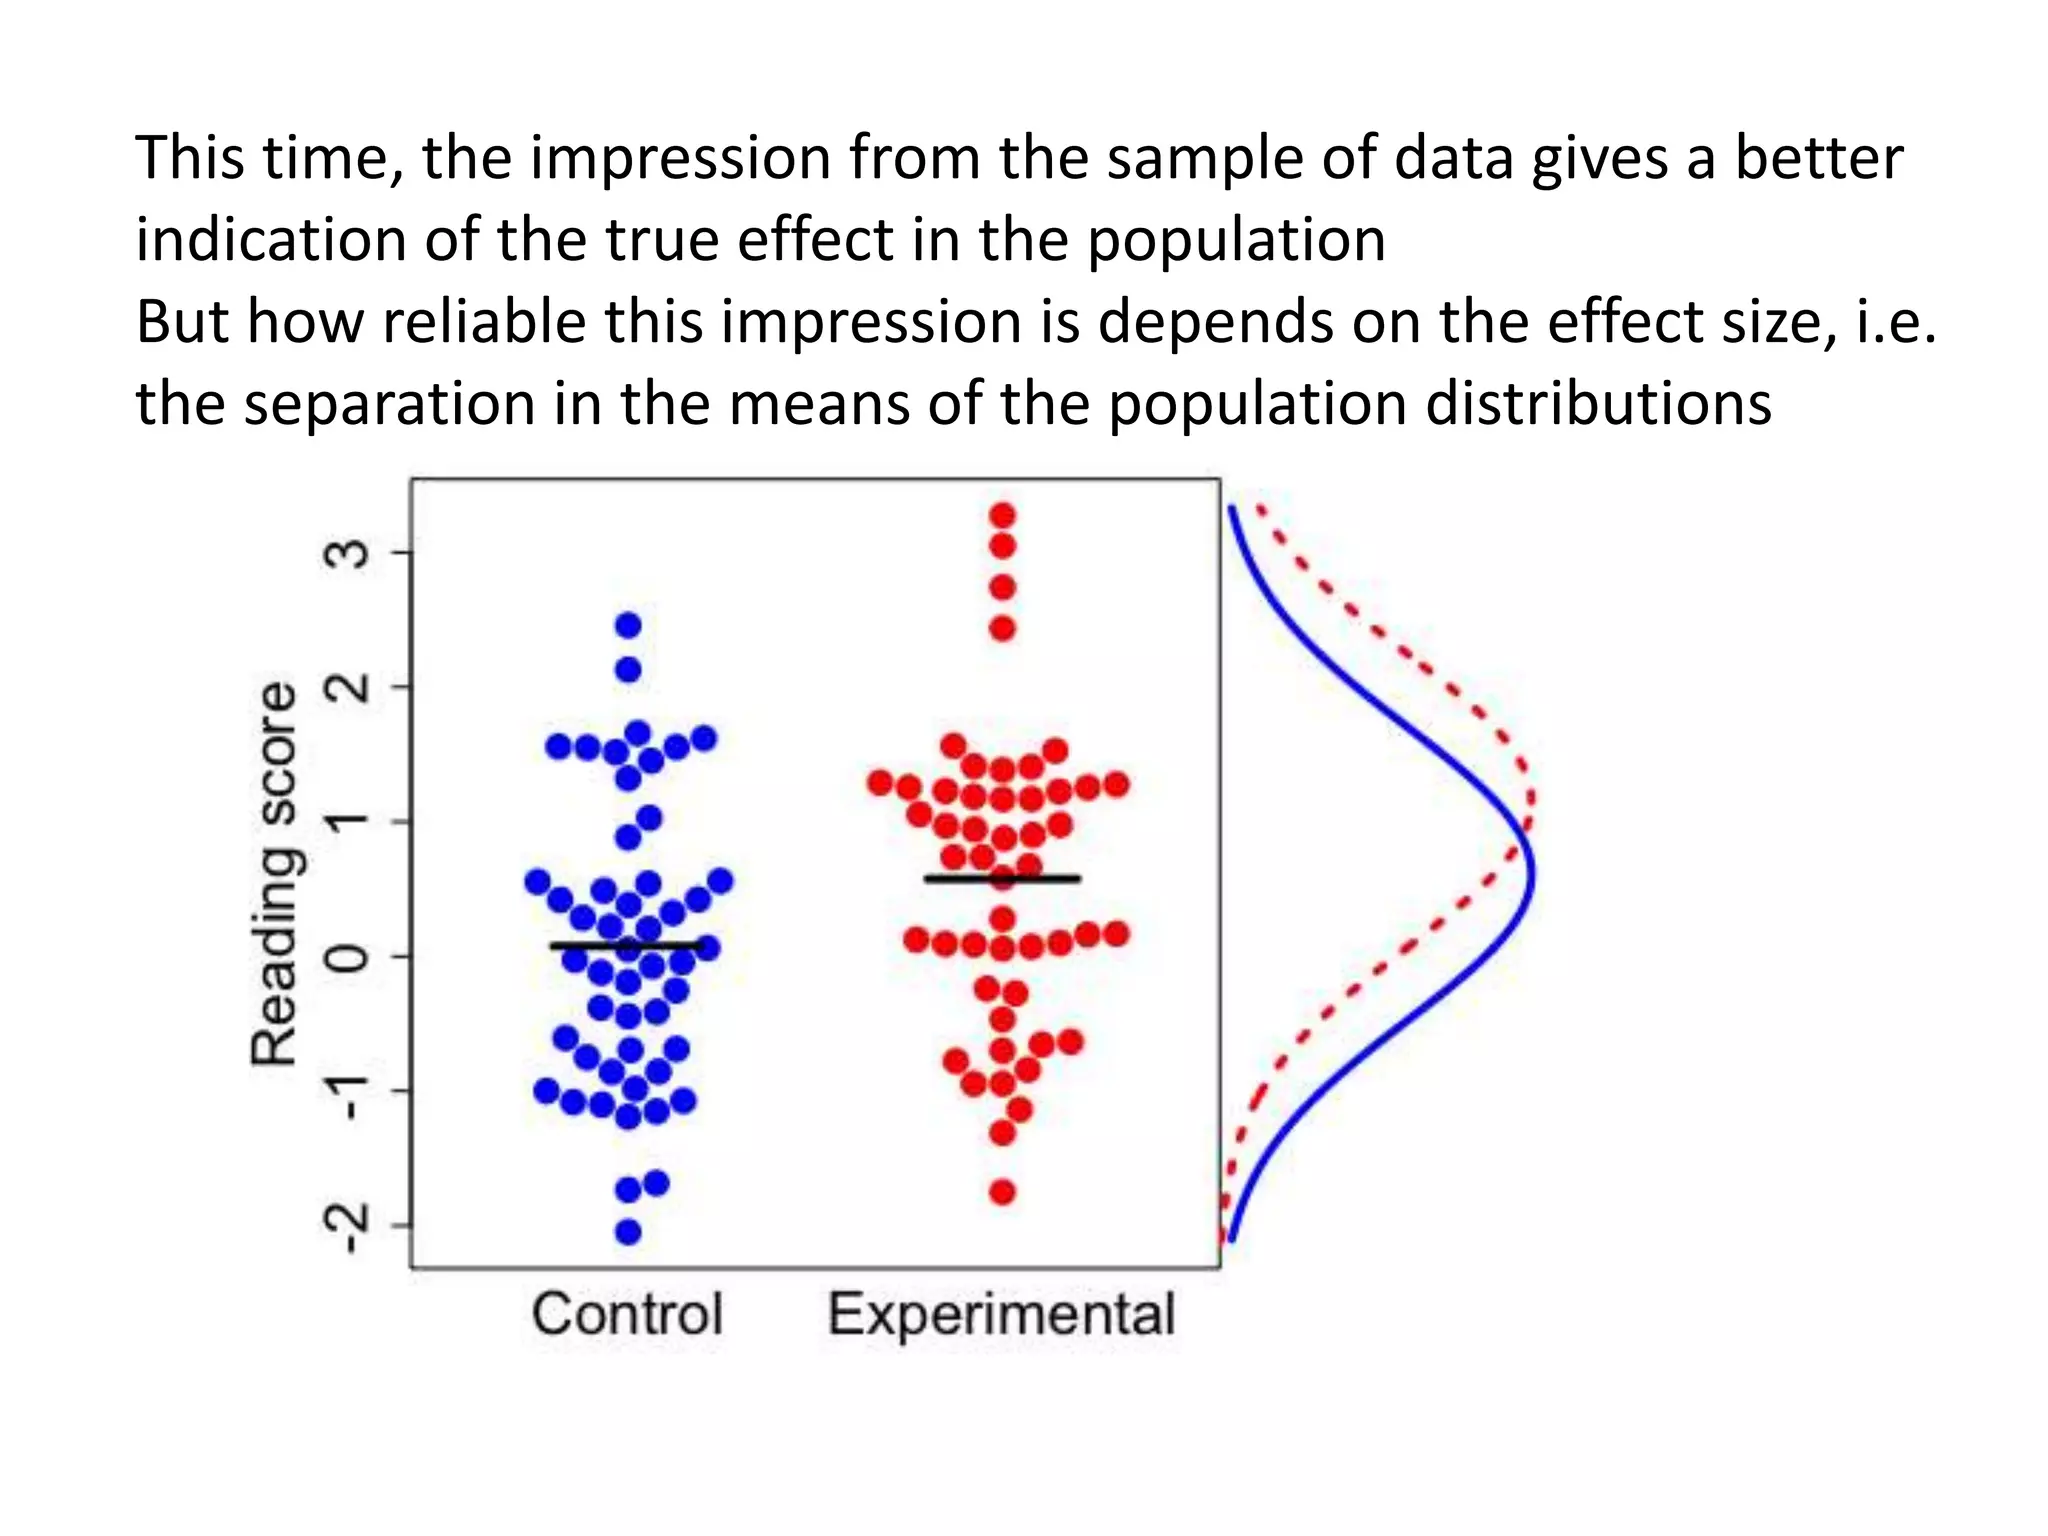
![Standardized mean difference is +ve when cerebellar volume is greater in ASD
Meta-analysis: Traut et al (2018) https://doi.org/10.1016/j.biopsych.2017.09.029
Though Webb et al (ref 14) did find area of vermis smaller in ASD after covarying cerebellum size
Ref [14] –
larger
cerebellum
Other studies
mostly found
no difference
or increase –
opposite of
what claimed
in 2013 paper](https://image.slidesharecdn.com/psychapproachesreproducibilityslideshare-191206170937/75/Insights-from-psychology-on-lack-of-reproducibility-42-2048.jpg)

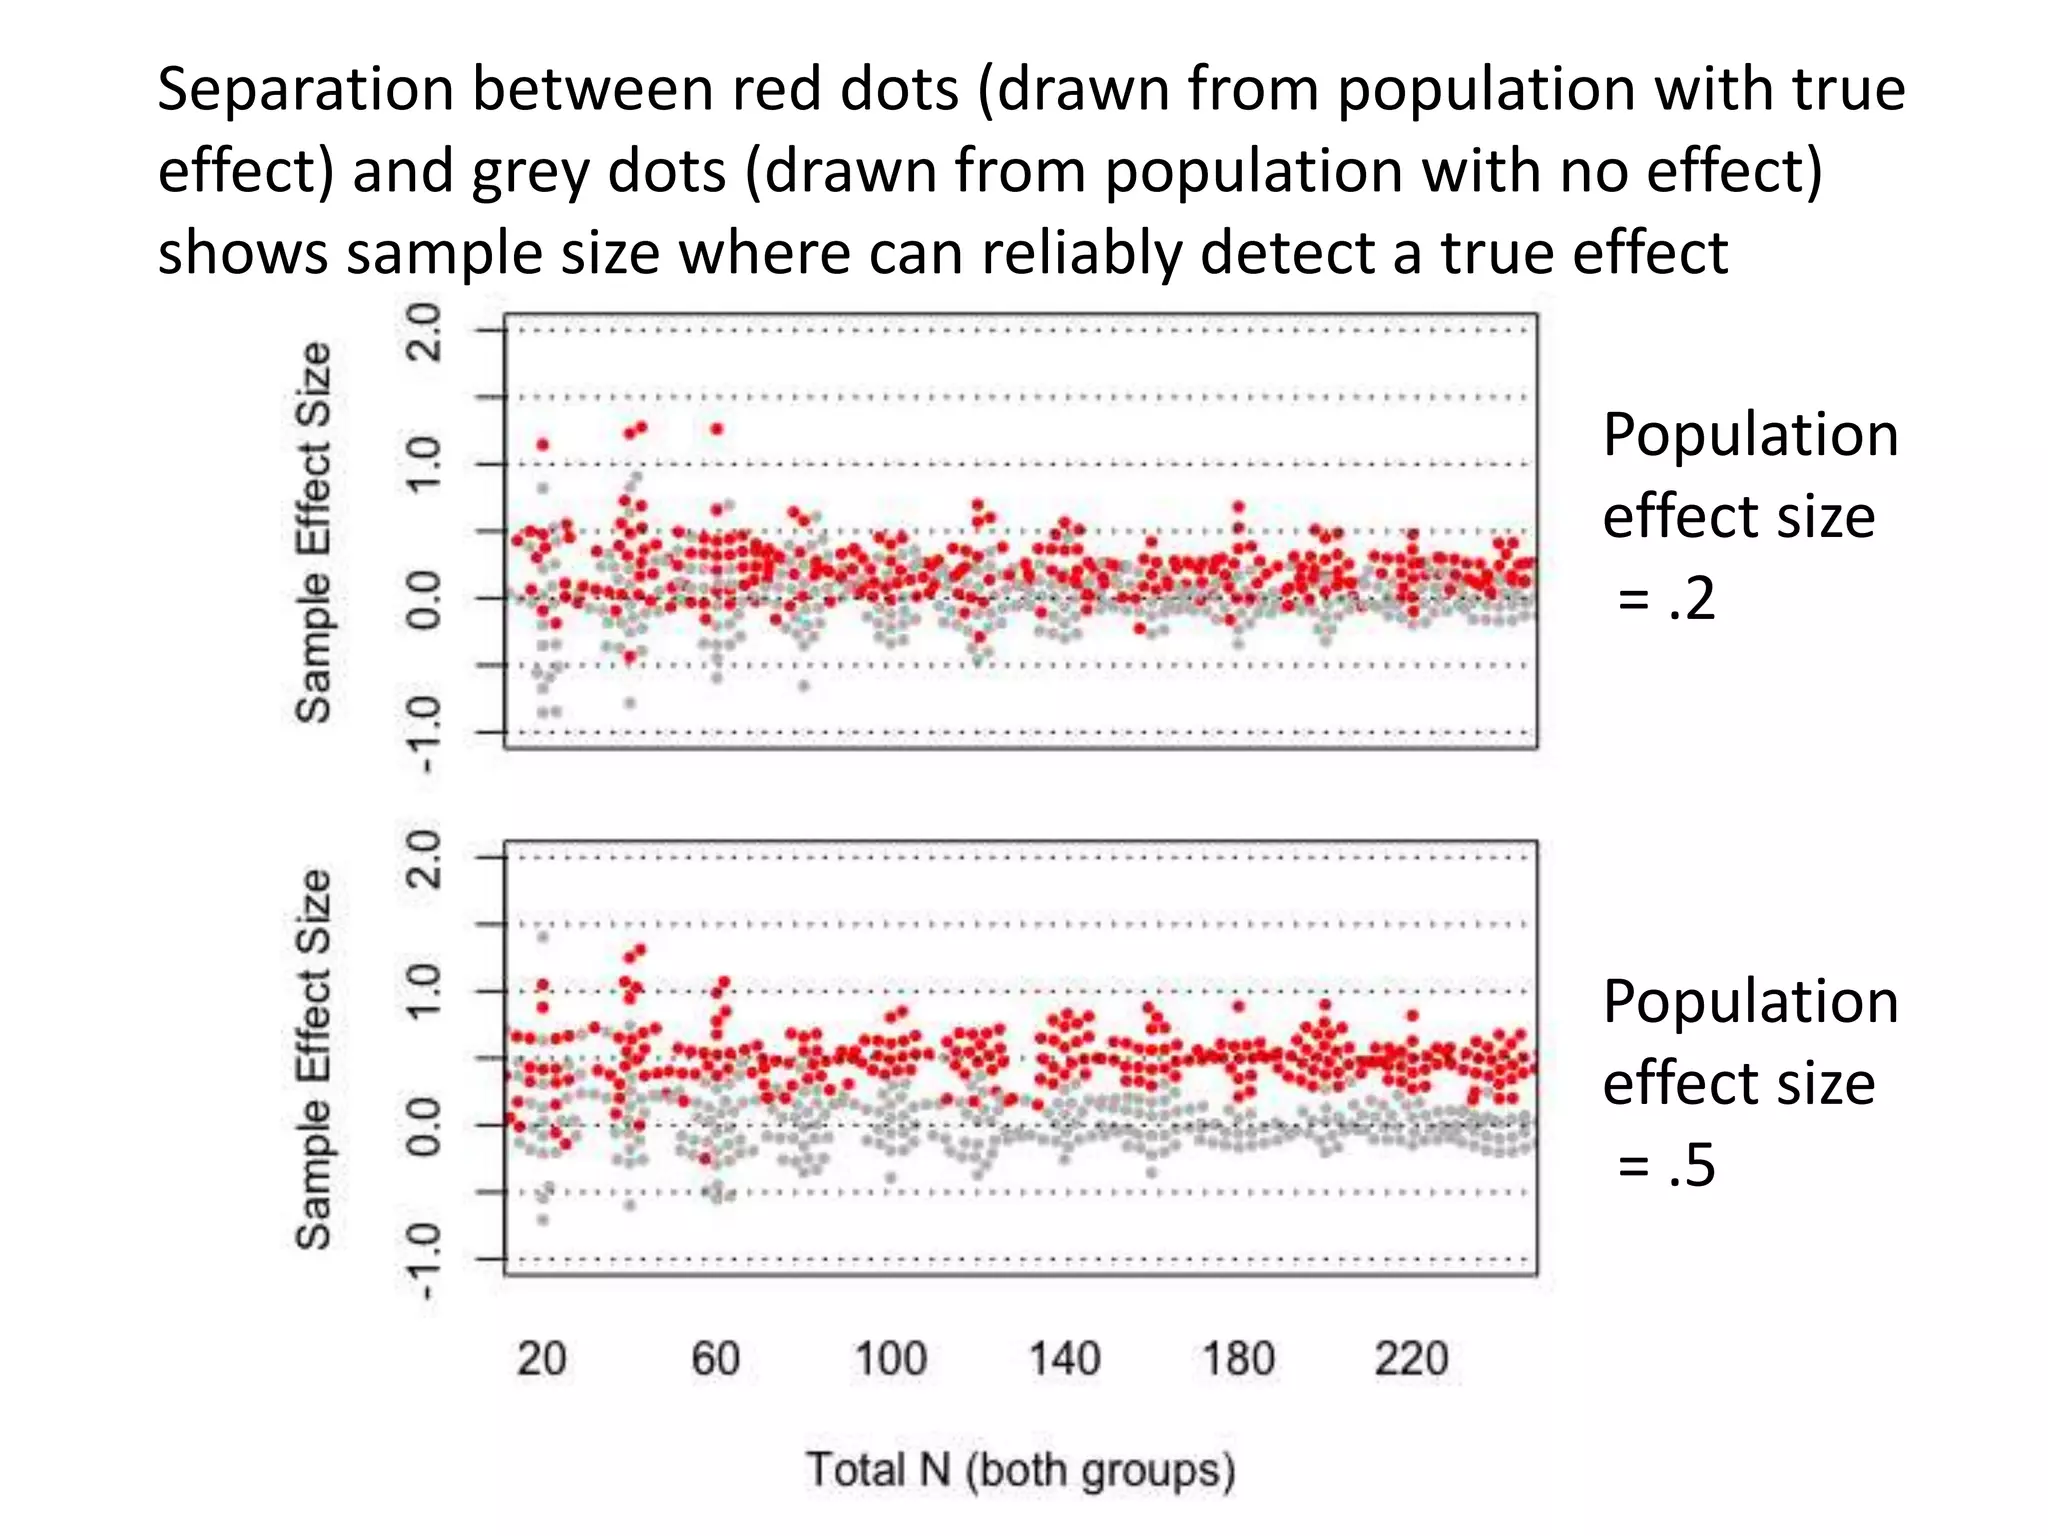
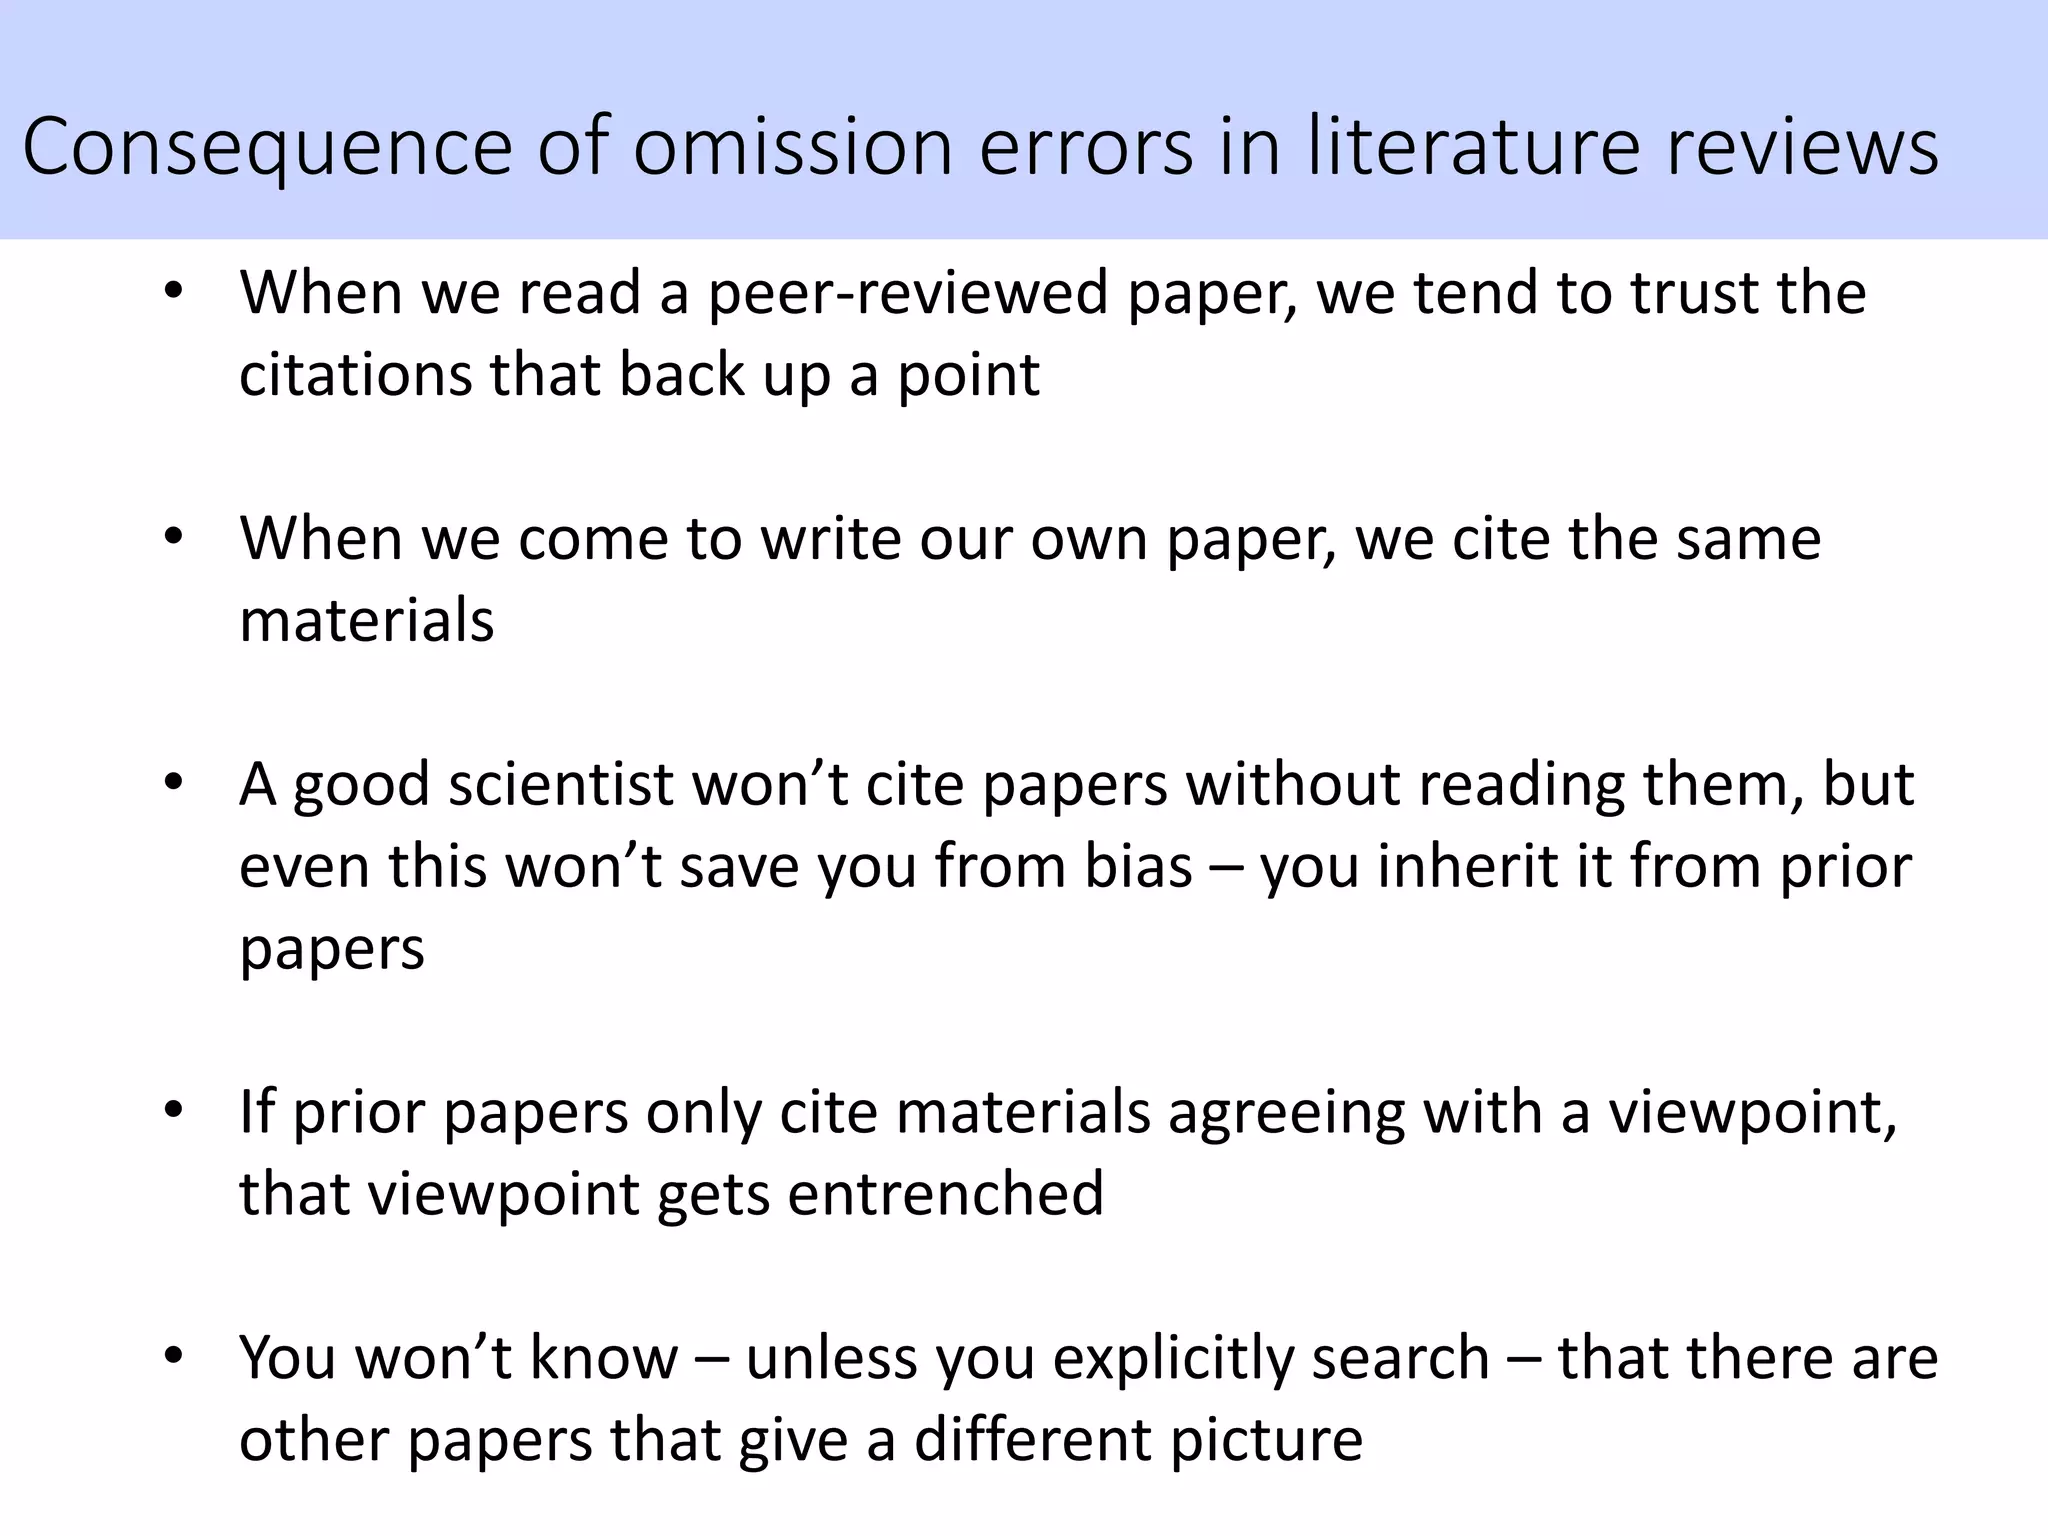
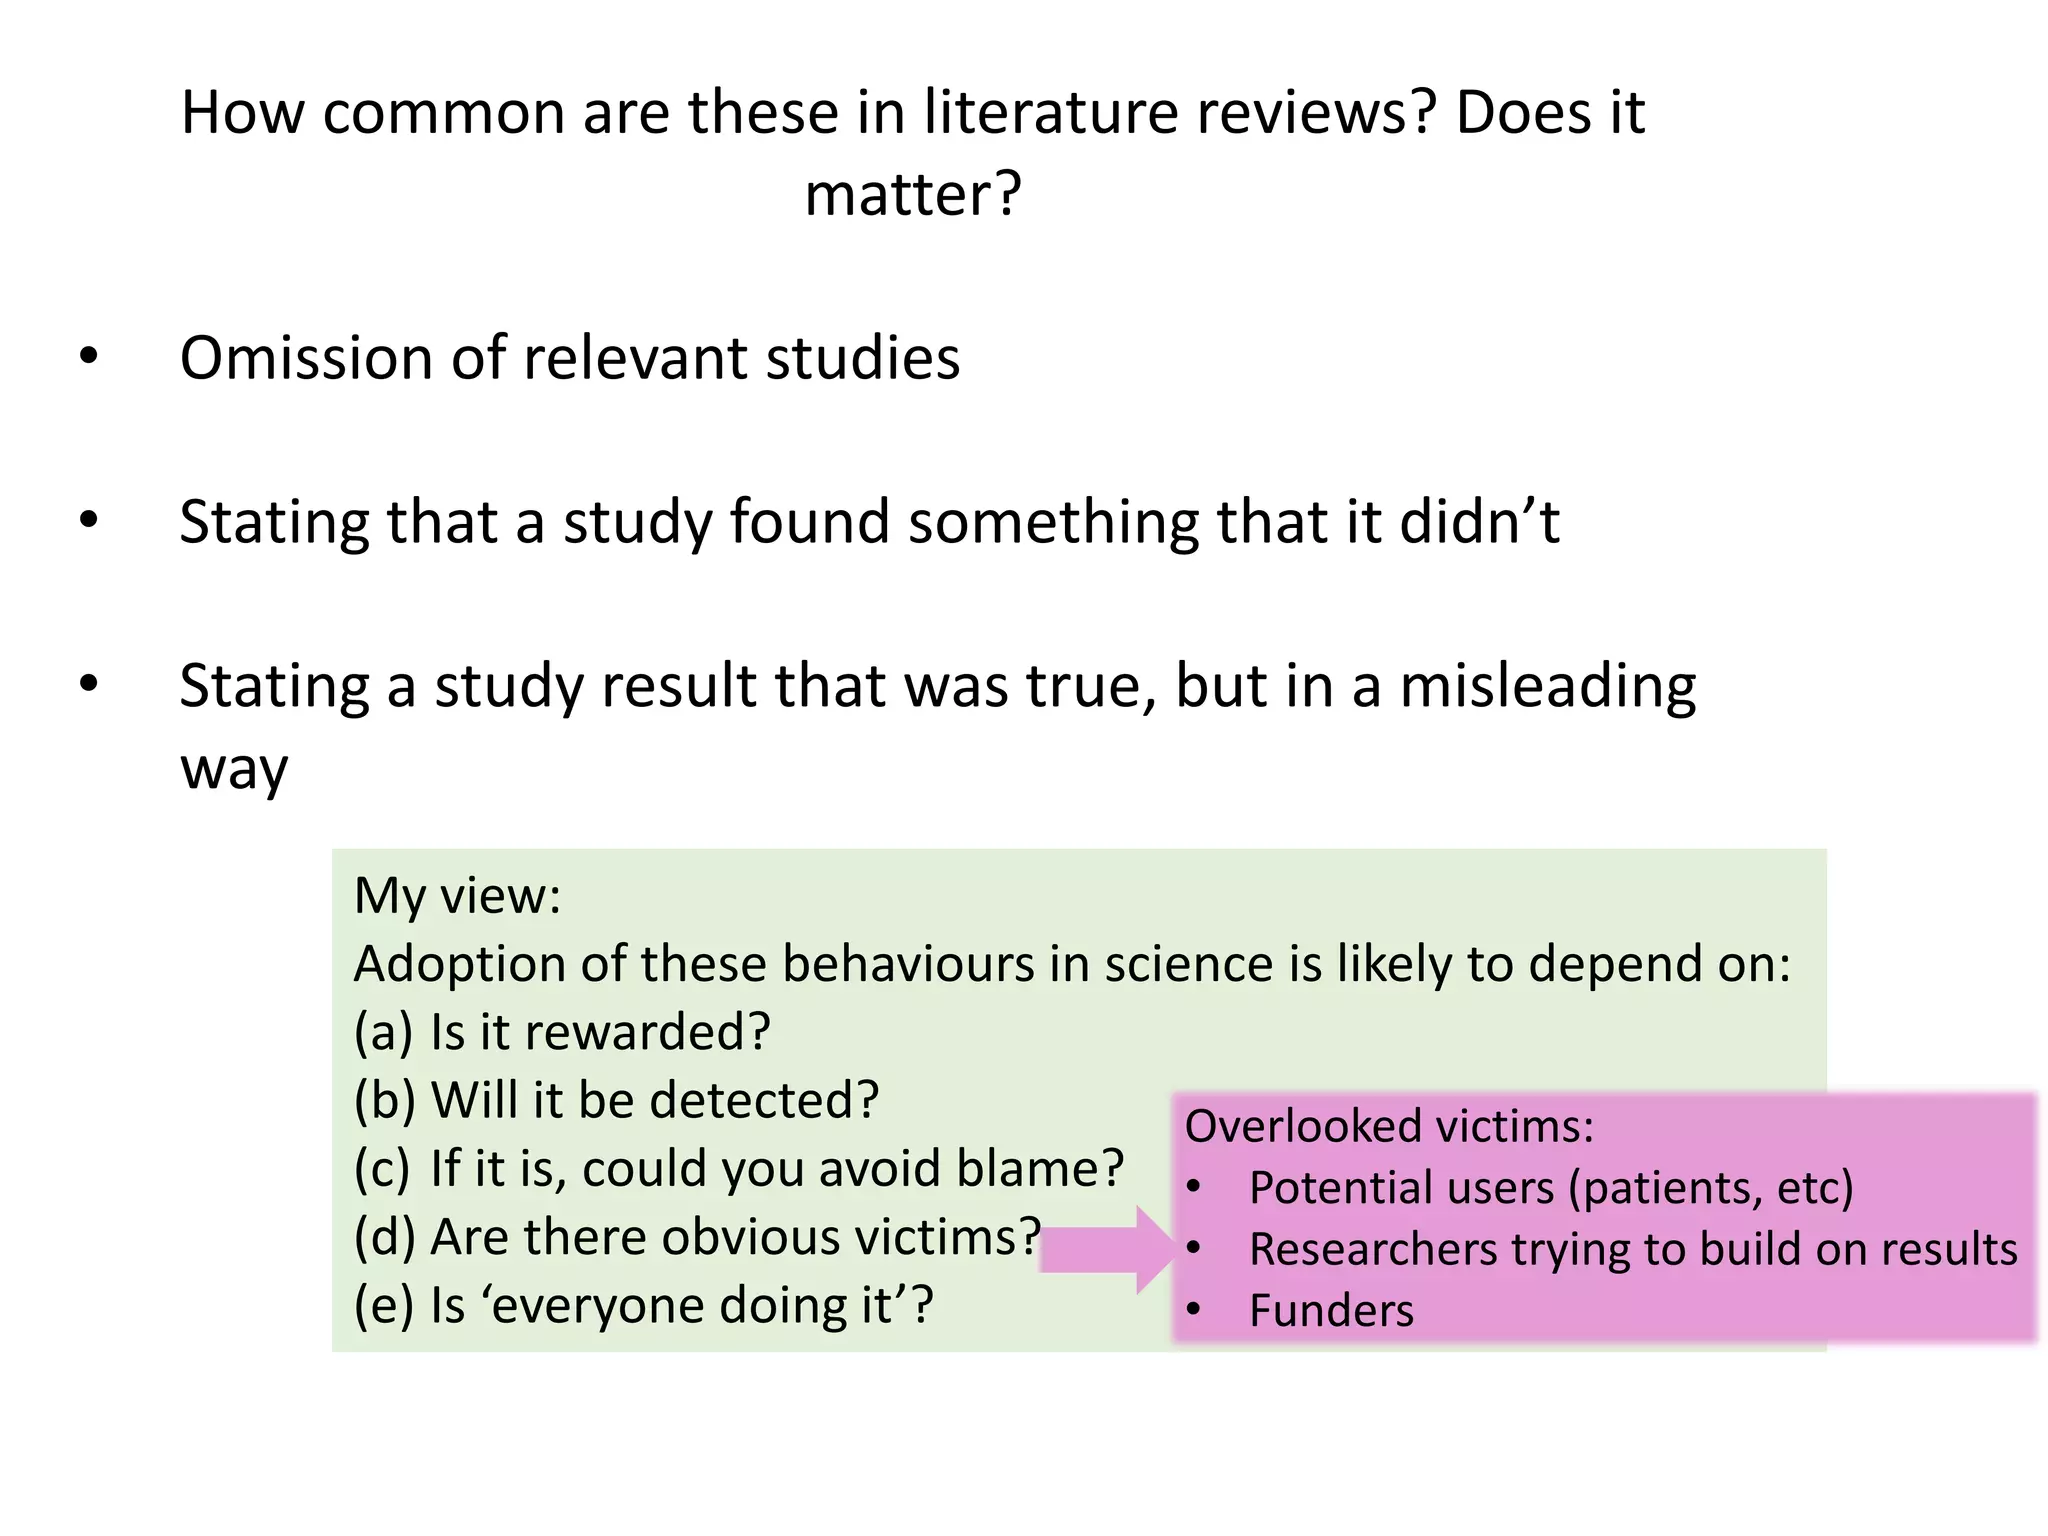
![Errors of omission in reporting research
“[I]t is a truly gross ethical violation for a researcher to
suppress reporting of difficult-to-explain or embarrassing
data in order to present a neat and attractive package
to a journal editor.” (Greenwald, 1975, p. 19)
“Failure to report results from a clinical trial is equivalent
to fraud.” Iain Chalmers, personal communication](https://image.slidesharecdn.com/psychapproachesreproducibilityslideshare-191206170937/75/Insights-from-psychology-on-lack-of-reproducibility-44-2048.jpg)


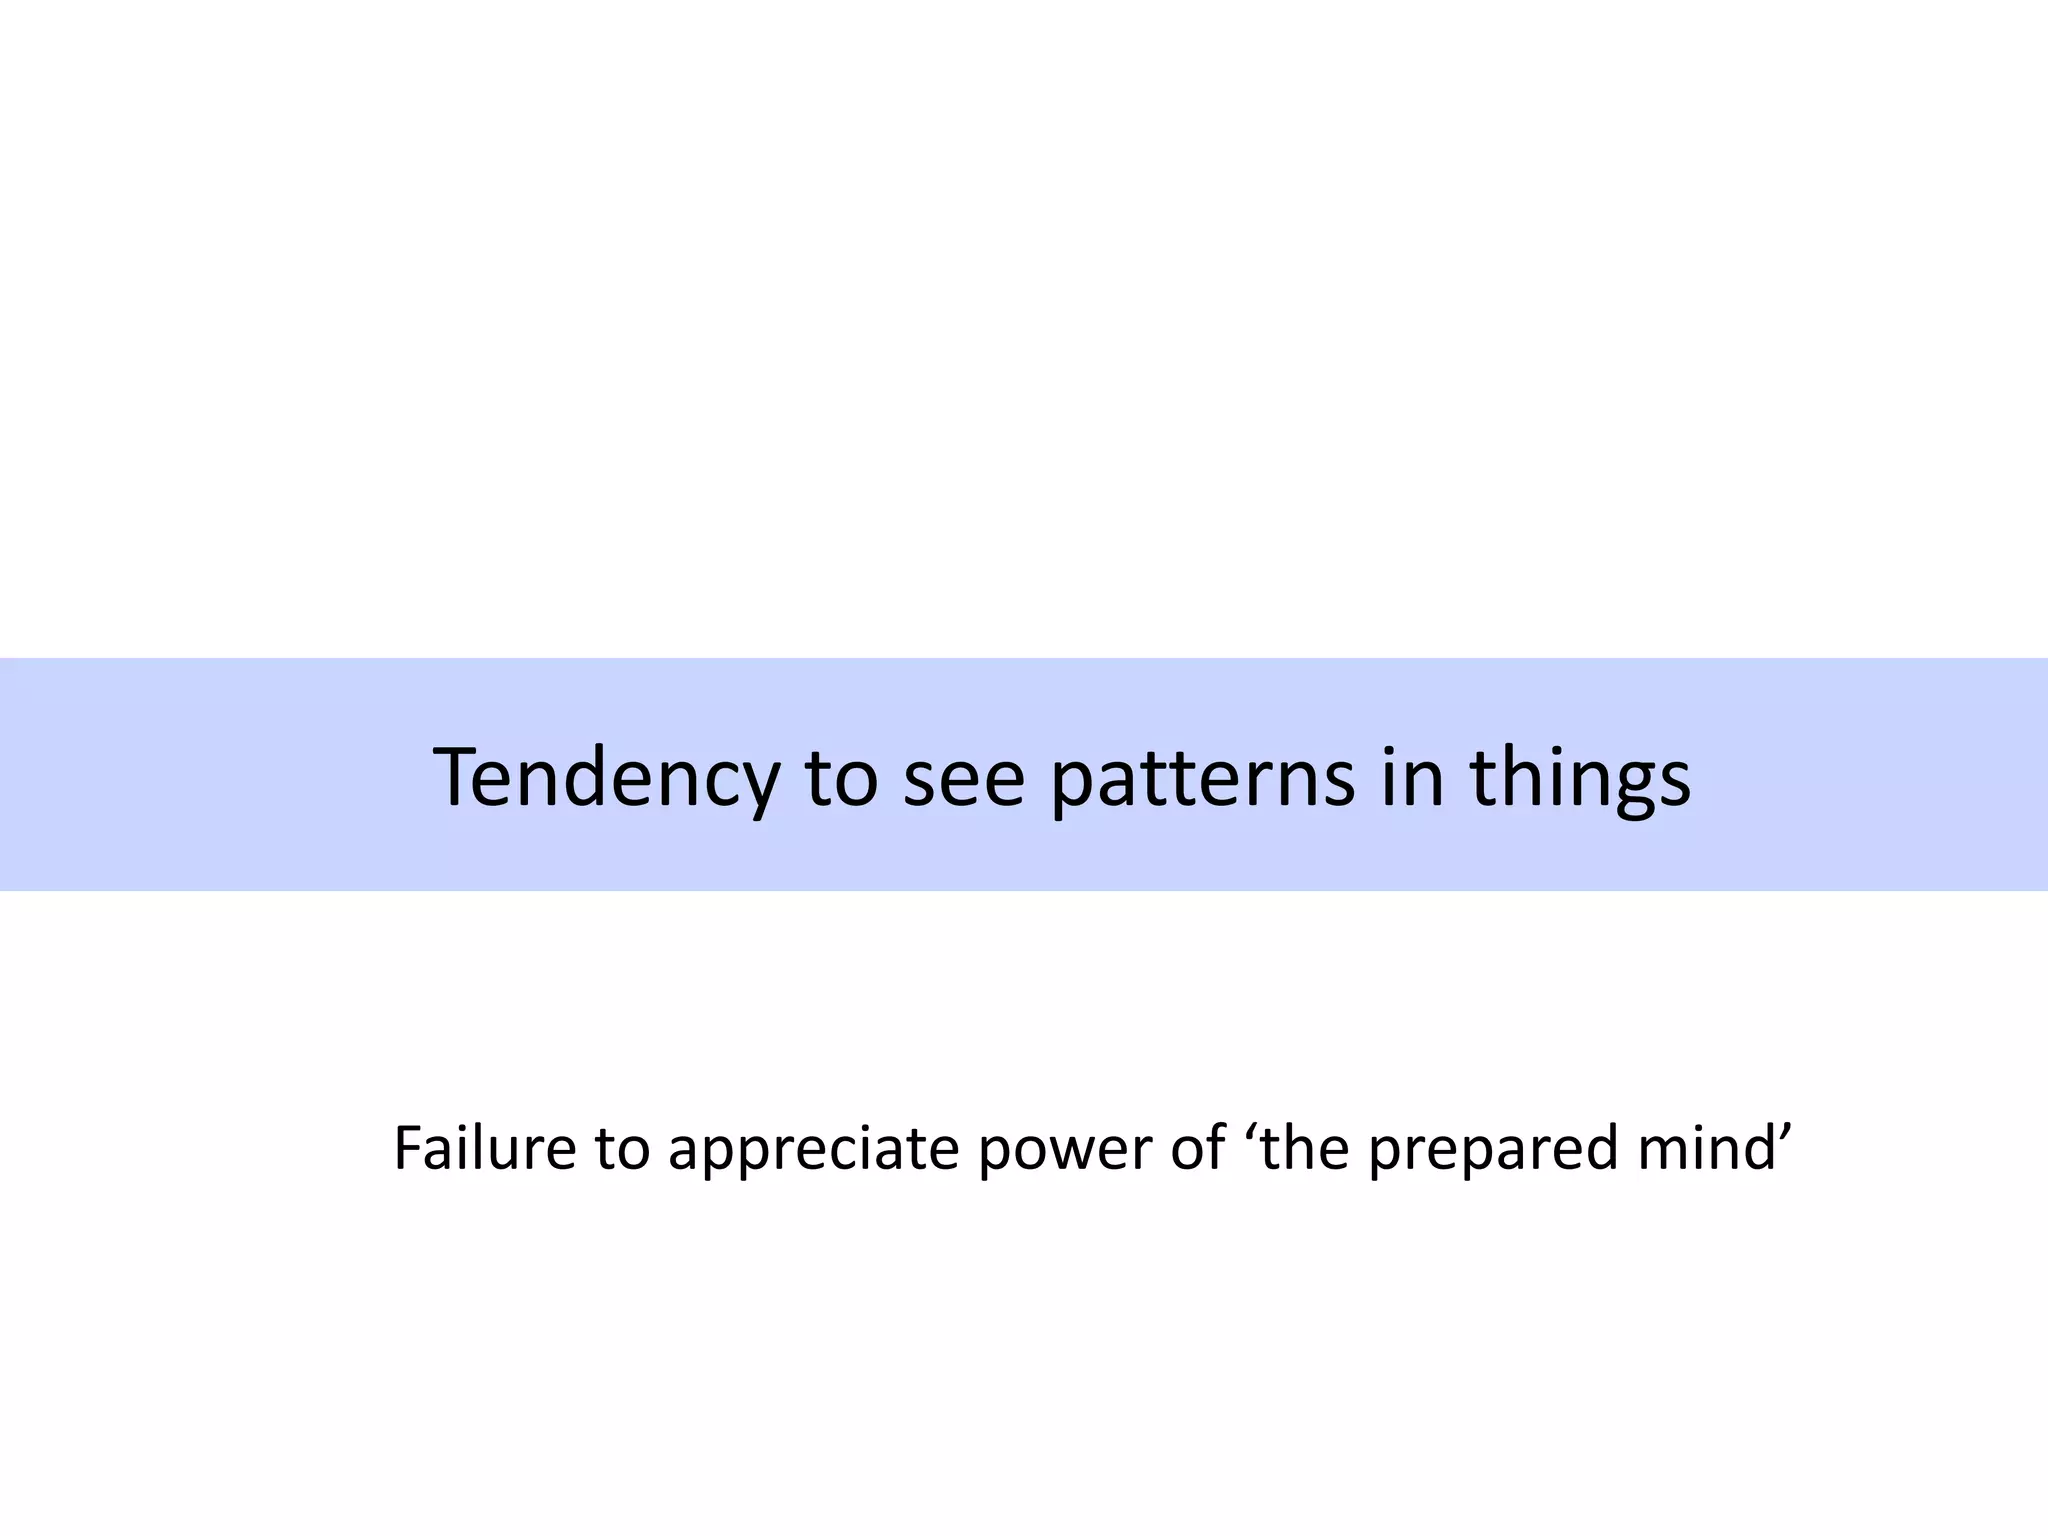
![Let’s take another look at that cerebellum paper:
statements that are not untrue, but are misleading
“Regardless of etiology, cerebellar neuropathology
commonly occurs in autistic individuals. Cerebellar
hypoplasia and reduced cerebellar Purkinje cell
numbers are the most consistent neuropathologies
linked to autism [8, 9, 10, 11, 12, 13]. MRI studies
report that autistic children have smaller cerebellar
vermal volume in comparison to typically developing
children [14].” Impression of large body of work, but
mostly reviews of same few studies
Study 14 by Webb et al: found overall increase in cerebellum size:
smaller vermis effect only after adjusting total cerebellar volume](https://image.slidesharecdn.com/psychapproachesreproducibilityslideshare-191206170937/75/Insights-from-psychology-on-lack-of-reproducibility-49-2048.jpg)


The document discusses the issue of reproducibility in psychological research, highlighting common problems such as p-hacking, publication bias, and low statistical power that contribute to the lack of reproducibility. It explores cognitive biases that hinder scientific integrity, emphasizing the need for open research practices and systematic reviews to counteract these biases. The talk advocates for improved experimental design and increased rigor in reporting research to enhance the reliability of scientific findings.